
#cryptocharts
cryptocharts
821,037 views
2,932 Discussing
Hot
Latest

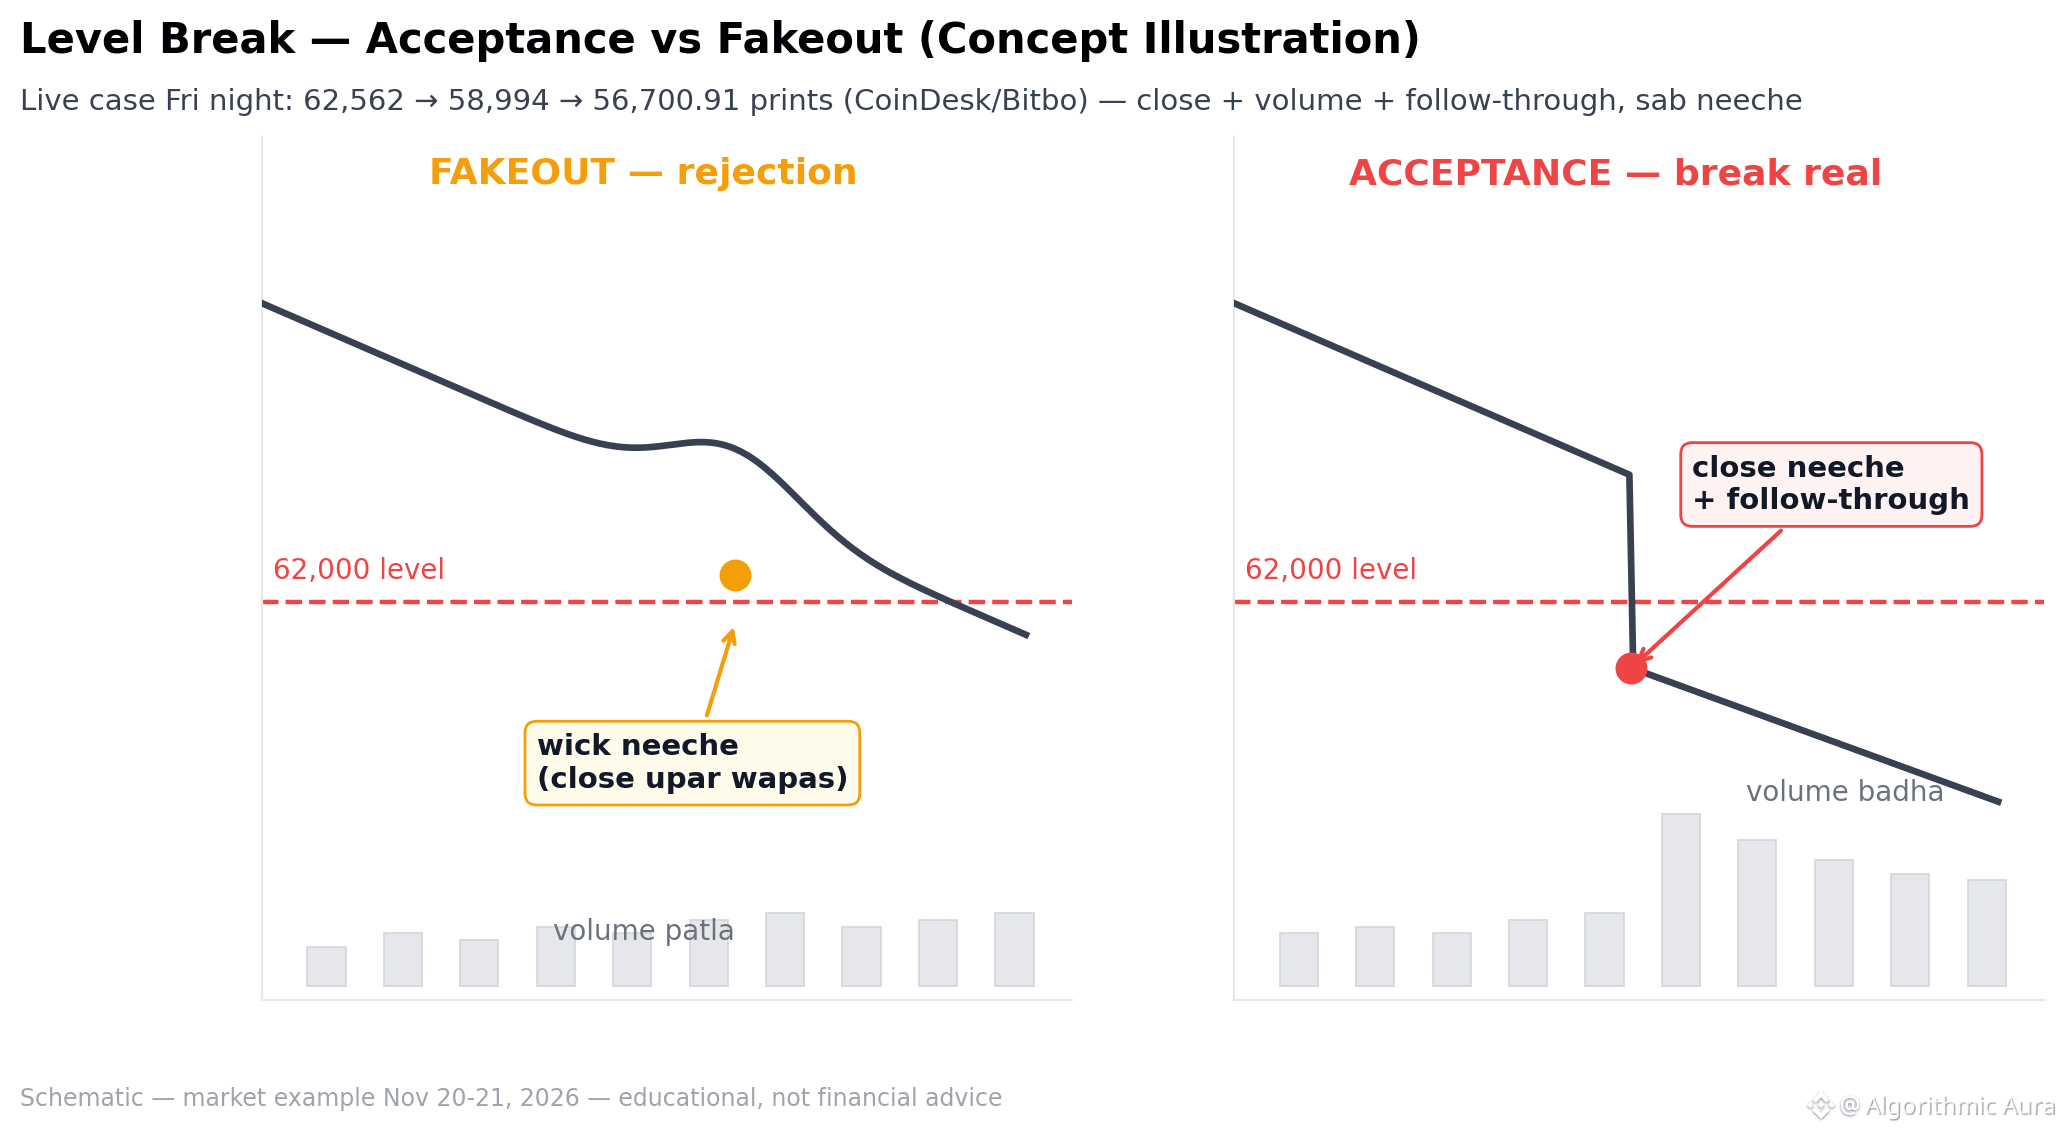
📊 One chart: when is a level break “real” — a live case at 62K.
🧊 1) Fakeout: wick below, close back inside the range, thin volume — rejection.
📉 2) Acceptance: candles close below, volume above average, follow-through in subsequent candles, and the retest doesn’t return inside.
⚠️ 3) Friday night opened like this: 62,562 → 58,994 → 56,700.91 prints — close + volume + follow-through, all three pointing down.
👀 Rule of thumb: the close matters more than the wick; volume confirms it. A wick alone isn’t a signal.
Educational illustration — not financial advice.
$BTC
#Bitcoin #CryptoCharts #MarketStructure
📊 One chart: when is a level break “real” — a live case at 62K.
🧊 1) Fakeout: wick below, close back inside the range, thin volume — rejection.
📉 2) Acceptance: candles close below, volume above average, follow-through in subsequent candles, and the retest doesn’t return inside.
⚠️ 3) Friday night opened like this: 62,562 → 58,994 → 56,700.91 prints — close + volume + follow-through, all three pointing down.
👀 Rule of thumb: the close matters more than the wick; volume confirms it. A wick alone isn’t a signal.
Educational illustration — not financial advice.
$BTC
#Bitcoin #CryptoCharts #MarketStructure
🧊 1) Fakeout: wick below, close back inside the range, thin volume — rejection.
📉 2) Acceptance: candles close below, volume above average, follow-through in subsequent candles, and the retest doesn’t return inside.
⚠️ 3) Friday night opened like this: 62,562 → 58,994 → 56,700.91 prints — close + volume + follow-through, all three pointing down.
👀 Rule of thumb: the close matters more than the wick; volume confirms it. A wick alone isn’t a signal.
Educational illustration — not financial advice.
$BTC
#Bitcoin #CryptoCharts #MarketStructure
8
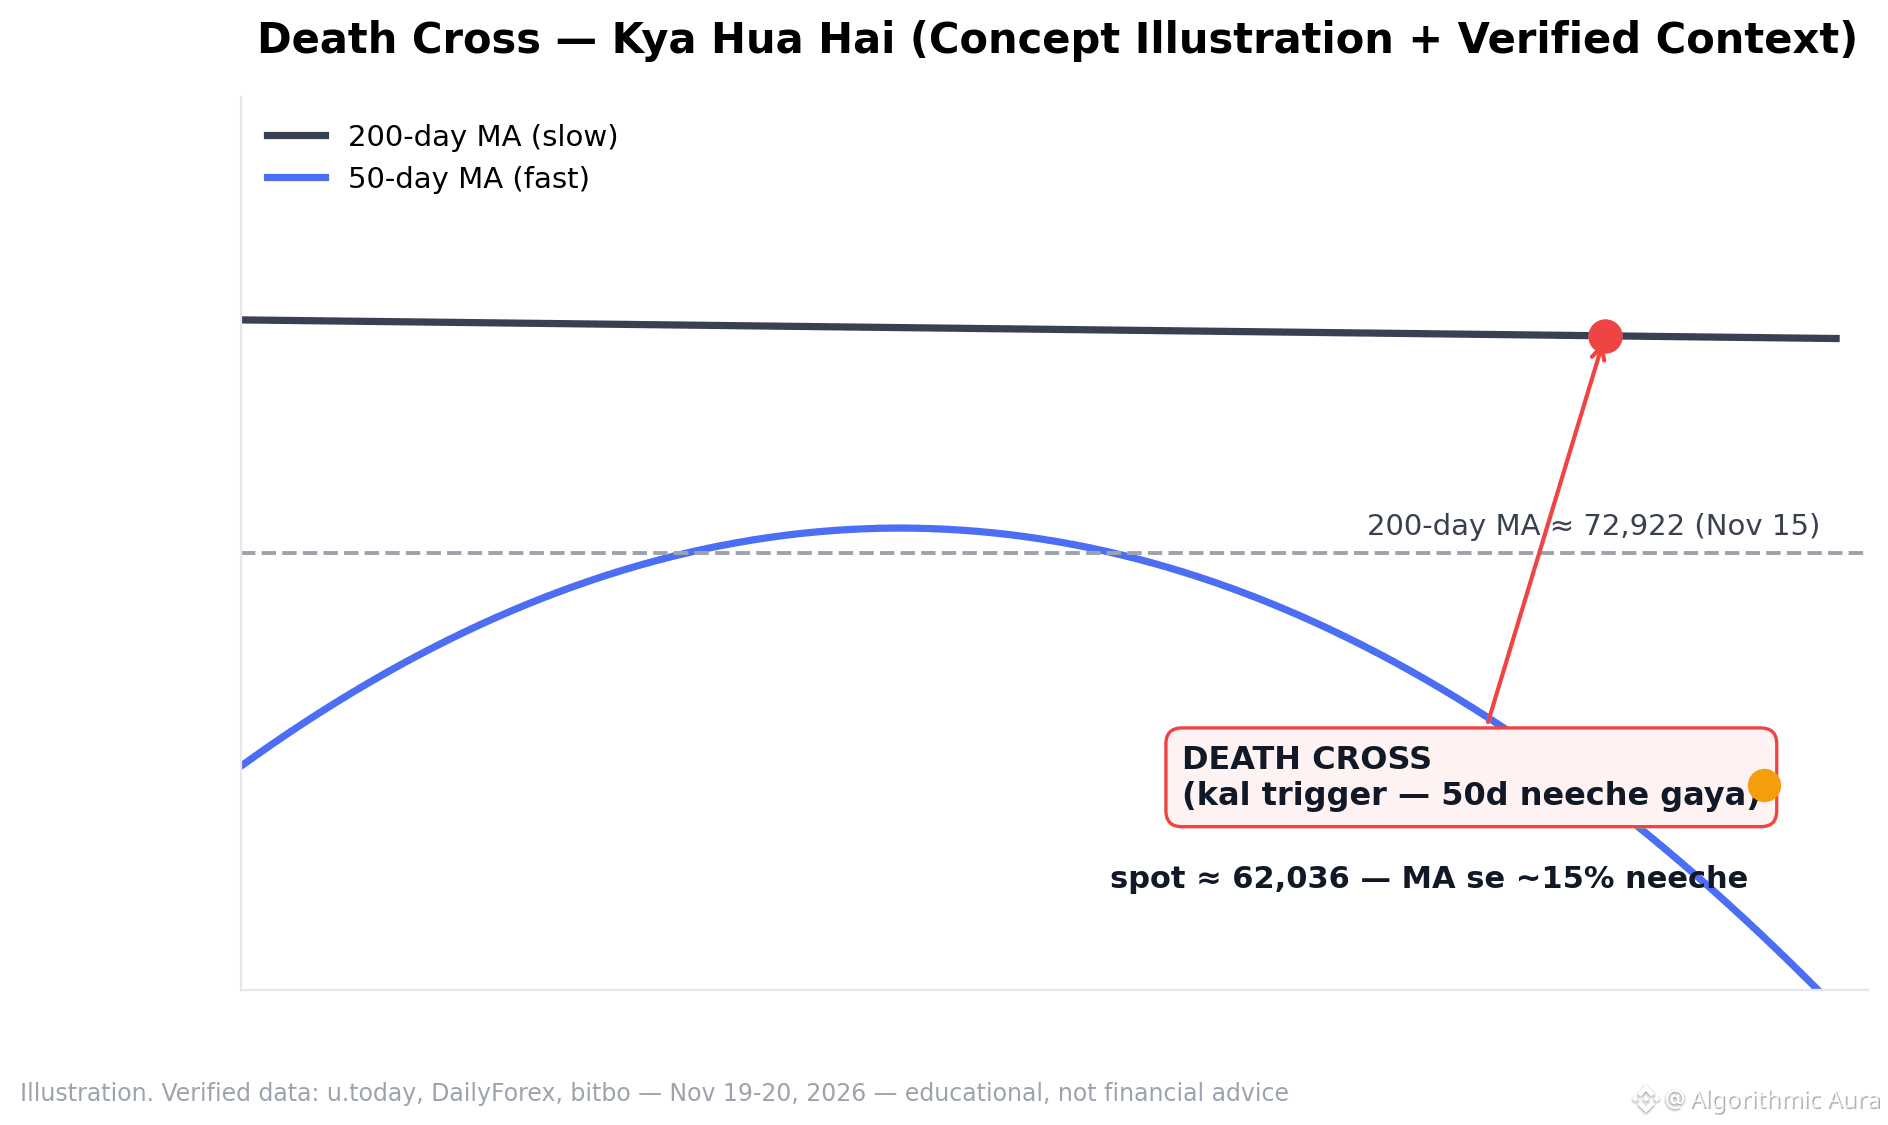
📊 One chart: death cross — what happened, where we are.
Concept + today's verified numbers:
📉 1) The 50-day MA crossed below the 200-day MA — triggered yesterday.
📍 2) The 200-day MA is ~72,922 (Nov 15); spot is ~62,036, about 15% below it.
⚠️ 3) All three major MAs cluster around ~75,500 — an overhead zone.
👀 This pattern provides context, not a decision. Historically, both bounces and declines have followed.
Read the chart, make a plan first — not financial advice.
$BTC
#Bitcoin #DeathCross #CryptoCharts
📊 One chart: death cross — what happened, where we are.
Concept + today's verified numbers:
📉 1) The 50-day MA crossed below the 200-day MA — triggered yesterday.
📍 2) The 200-day MA is ~72,922 (Nov 15); spot is ~62,036, about 15% below it.
⚠️ 3) All three major MAs cluster around ~75,500 — an overhead zone.
👀 This pattern provides context, not a decision. Historically, both bounces and declines have followed.
Read the chart, make a plan first — not financial advice.
$BTC
#Bitcoin #DeathCross #CryptoCharts
Concept + today's verified numbers:
📉 1) The 50-day MA crossed below the 200-day MA — triggered yesterday.
📍 2) The 200-day MA is ~72,922 (Nov 15); spot is ~62,036, about 15% below it.
⚠️ 3) All three major MAs cluster around ~75,500 — an overhead zone.
👀 This pattern provides context, not a decision. Historically, both bounces and declines have followed.
Read the chart, make a plan first — not financial advice.
$BTC
#Bitcoin #DeathCross #CryptoCharts
43

·
--
How crypto charts work — simple guide for beginners
A chart shows the price of a coin over time. Here is how to read it.
1. Green candle = price went up in that time. Red candle = price went down.
2. Each candle is one time period — 1 hour, 1 day, or 1 week. You can change it.
3. The line at the top of a candle is the highest price, the bottom is the lowest price.
4. A chart shows the past, not the future. It never tells you what will happen next.
5. Do not buy just because a chart goes up fast — that is often when it falls.
Charts help you understand $BTC and $ETH price moves — but learn first, trade later.
Not financial advice. DYOR.
#CryptoCharts #CryptoForBeginners #learncrypto
How crypto charts work — simple guide for beginners
A chart shows the price of a coin over time. Here is how to read it.
1. Green candle = price went up in that time. Red candle = price went down.
2. Each candle is one time period — 1 hour, 1 day, or 1 week. You can change it.
3. The line at the top of a candle is the highest price, the bottom is the lowest price.
4. A chart shows the past, not the future. It never tells you what will happen next.
5. Do not buy just because a chart goes up fast — that is often when it falls.
Charts help you understand $BTC and $ETH price moves — but learn first, trade later.
Not financial advice. DYOR.
#CryptoCharts #CryptoForBeginners #learncrypto
A chart shows the price of a coin over time. Here is how to read it.
1. Green candle = price went up in that time. Red candle = price went down.
2. Each candle is one time period — 1 hour, 1 day, or 1 week. You can change it.
3. The line at the top of a candle is the highest price, the bottom is the lowest price.
4. A chart shows the past, not the future. It never tells you what will happen next.
5. Do not buy just because a chart goes up fast — that is often when it falls.
Charts help you understand $BTC and $ETH price moves — but learn first, trade later.
Not financial advice. DYOR.
#CryptoCharts #CryptoForBeginners #learncrypto
104

·
--
Bearish
📊 ONE CHART. THREE SIGNALS. A BETTER WAY TO UNDERSTAND MARKET CONDITIONS.
You don't always need ten indicators covering your entire screen.
Sometimes three carefully selected tools can provide useful market context.
Here's a simple combination worth understanding:
🔵 1. Moving Average (MA)
Helps identify the broader price direction and potential dynamic support or resistance areas.
🟢 2. Relative Strength Index (RSI)
Provides information about momentum and possible overbought or oversold conditions.
🟡 3. Volume
Shows trading activity and helps evaluate participation behind price movements.
Why combine them?
Because each indicator measures something different:
• Moving averages: Trend context.
• RSI: Momentum context.
• Volume: Market participation.
When these signals align, they can provide a more complete picture.
However, indicators can produce misleading signals, especially during volatile market conditions.
Use them as analytical tools, not prediction machines.
💬 What's your favorite three-indicator combination? #TradingIndicators #CryptoCharts #RedwanCrypto #BinancePicks
#JobsReportRaisesHikeOdds $BTC
📊 ONE CHART. THREE SIGNALS. A BETTER WAY TO UNDERSTAND MARKET CONDITIONS.
You don't always need ten indicators covering your entire screen.
Sometimes three carefully selected tools can provide useful market context.
Here's a simple combination worth understanding:
🔵 1. Moving Average (MA)
Helps identify the broader price direction and potential dynamic support or resistance areas.
🟢 2. Relative Strength Index (RSI)
Provides information about momentum and possible overbought or oversold conditions.
🟡 3. Volume
Shows trading activity and helps evaluate participation behind price movements.
Why combine them?
Because each indicator measures something different:
• Moving averages: Trend context.
• RSI: Momentum context.
• Volume: Market participation.
When these signals align, they can provide a more complete picture.
However, indicators can produce misleading signals, especially during volatile market conditions.
Use them as analytical tools, not prediction machines.
💬 What's your favorite three-indicator combination? #TradingIndicators #CryptoCharts #RedwanCrypto #BinancePicks
#JobsReportRaisesHikeOdds $BTC
You don't always need ten indicators covering your entire screen.
Sometimes three carefully selected tools can provide useful market context.
Here's a simple combination worth understanding:
🔵 1. Moving Average (MA)
Helps identify the broader price direction and potential dynamic support or resistance areas.
🟢 2. Relative Strength Index (RSI)
Provides information about momentum and possible overbought or oversold conditions.
🟡 3. Volume
Shows trading activity and helps evaluate participation behind price movements.
Why combine them?
Because each indicator measures something different:
• Moving averages: Trend context.
• RSI: Momentum context.
• Volume: Market participation.
When these signals align, they can provide a more complete picture.
However, indicators can produce misleading signals, especially during volatile market conditions.
Use them as analytical tools, not prediction machines.
💬 What's your favorite three-indicator combination? #TradingIndicators #CryptoCharts #RedwanCrypto #BinancePicks
#JobsReportRaisesHikeOdds $BTC
1
79

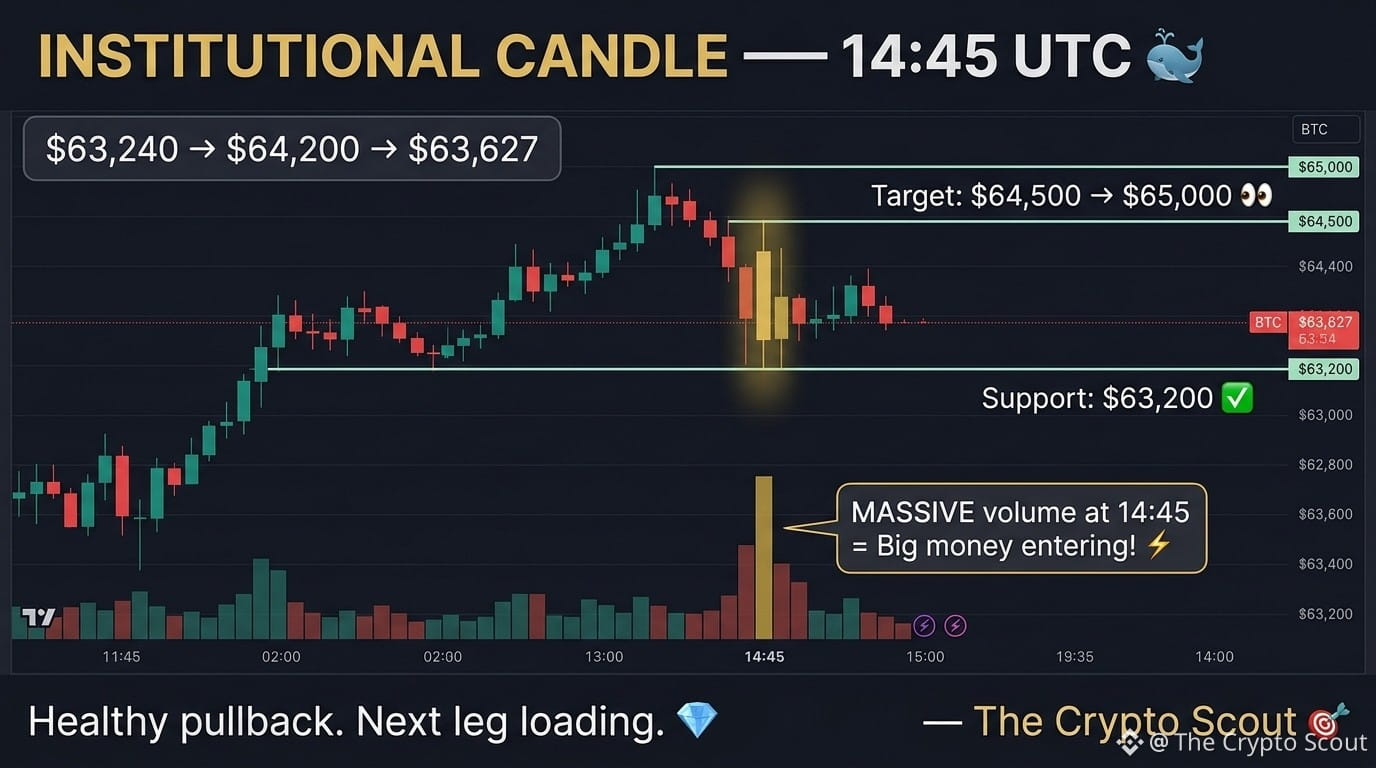
👀 BTC Chart tells today's story:
$63,240 → $64,200 → $63,627
Chart reading 🔍
14:45 UTC — Massive volume spike
Price jumped $960 in minutes! ⚡
This is called "institutional candle"
— large buy orders hitting at once 🐋
After the spike:
Natural pullback to $63,627 ✅
This is HEALTHY — not weakness
Key levels now:
📌 Support: $63,200 ✅
📌 Current: $63,627
📌 Target: $64,500 → $65,000 👀
ETH also strong: $1,705 peak!
BNB making new highs: $609! 🔥
The recovery momentum is building.
Screenshot these levels 📸
— The Crypto Scout 🎯
#Bitcoin❗ #BTC #CryptoCharts
👀 BTC Chart tells today's story:
$63,240 → $64,200 → $63,627
Chart reading 🔍
14:45 UTC — Massive volume spike
Price jumped $960 in minutes! ⚡
This is called "institutional candle"
— large buy orders hitting at once 🐋
After the spike:
Natural pullback to $63,627 ✅
This is HEALTHY — not weakness
Key levels now:
📌 Support: $63,200 ✅
📌 Current: $63,627
📌 Target: $64,500 → $65,000 👀
ETH also strong: $1,705 peak!
BNB making new highs: $609! 🔥
The recovery momentum is building.
Screenshot these levels 📸
— The Crypto Scout 🎯
#Bitcoin❗ #BTC #CryptoCharts
$63,240 → $64,200 → $63,627
Chart reading 🔍
14:45 UTC — Massive volume spike
Price jumped $960 in minutes! ⚡
This is called "institutional candle"
— large buy orders hitting at once 🐋
After the spike:
Natural pullback to $63,627 ✅
This is HEALTHY — not weakness
Key levels now:
📌 Support: $63,200 ✅
📌 Current: $63,627
📌 Target: $64,500 → $65,000 👀
ETH also strong: $1,705 peak!
BNB making new highs: $609! 🔥
The recovery momentum is building.
Screenshot these levels 📸
— The Crypto Scout 🎯
#Bitcoin❗ #BTC #CryptoCharts
1
193
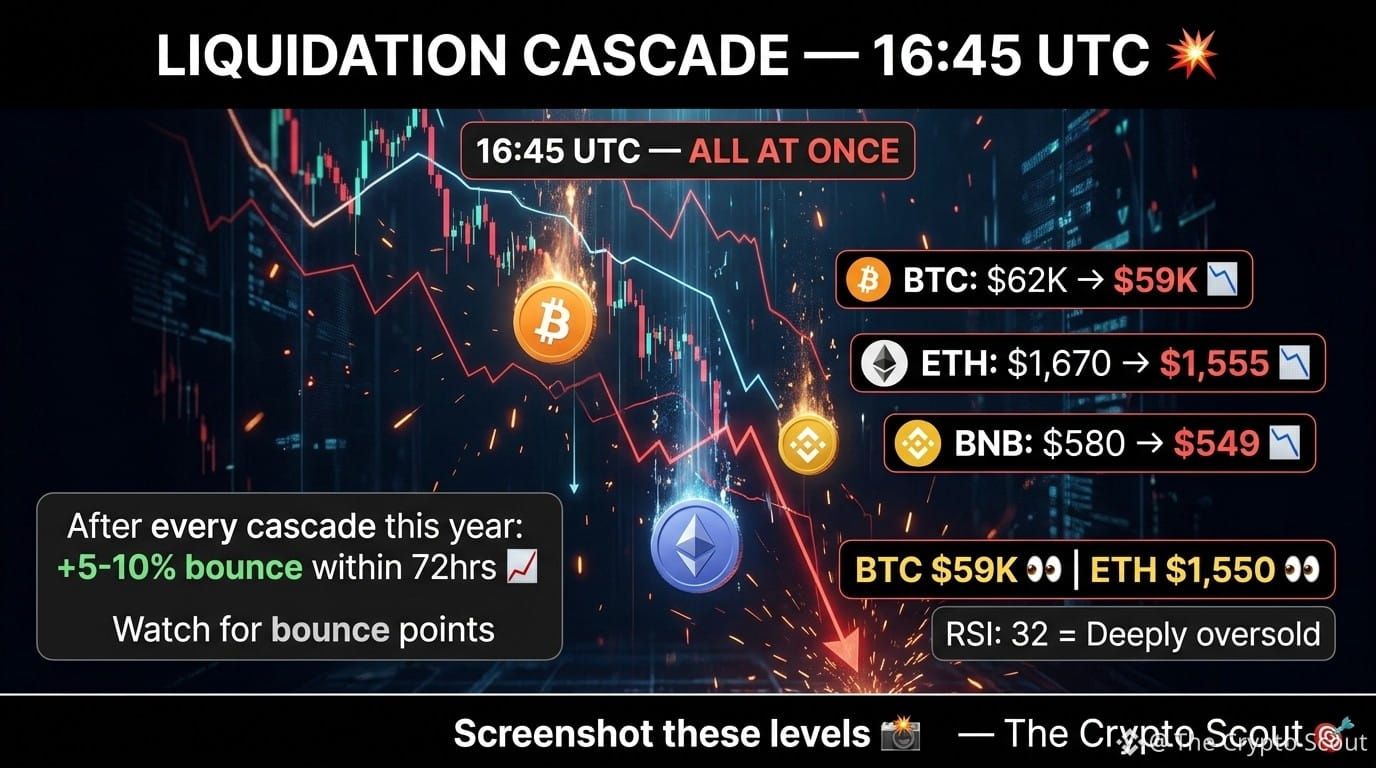
👀 Three charts. Same story.
BTC: $62,000 → $59,000 📉
ETH: $1,670 → $1,555 📉
BNB: $580 → $549 📉
All three dropped hard at 16:45 UTC
Same moment. Same volume spike.
This is called:
"Coordinated liquidation cascade" 💥
When big leverage positions
get liquidated together —
All coins drop simultaneously.
After EVERY liquidation cascade
this year?
Market bottomed within 48-72 hours
and bounced 5-10% 📈
Key levels to watch:
📌 BTC: $59,000 support 👀
📌 ETH: $1,550 support 👀
📌 RSI: 32.32 — deeply oversold
Average RSI 32 =
Last 3 times this happened?
Market recovered 15-20% 🚀
Screenshot these levels 📸
— The Crypto Scout 🎯
#bitcoin #BTC #CryptoCharts
👀 Three charts. Same story.
BTC: $62,000 → $59,000 📉
ETH: $1,670 → $1,555 📉
BNB: $580 → $549 📉
All three dropped hard at 16:45 UTC
Same moment. Same volume spike.
This is called:
"Coordinated liquidation cascade" 💥
When big leverage positions
get liquidated together —
All coins drop simultaneously.
After EVERY liquidation cascade
this year?
Market bottomed within 48-72 hours
and bounced 5-10% 📈
Key levels to watch:
📌 BTC: $59,000 support 👀
📌 ETH: $1,550 support 👀
📌 RSI: 32.32 — deeply oversold
Average RSI 32 =
Last 3 times this happened?
Market recovered 15-20% 🚀
Screenshot these levels 📸
— The Crypto Scout 🎯
#bitcoin #BTC #CryptoCharts
BTC: $62,000 → $59,000 📉
ETH: $1,670 → $1,555 📉
BNB: $580 → $549 📉
All three dropped hard at 16:45 UTC
Same moment. Same volume spike.
This is called:
"Coordinated liquidation cascade" 💥
When big leverage positions
get liquidated together —
All coins drop simultaneously.
After EVERY liquidation cascade
this year?
Market bottomed within 48-72 hours
and bounced 5-10% 📈
Key levels to watch:
📌 BTC: $59,000 support 👀
📌 ETH: $1,550 support 👀
📌 RSI: 32.32 — deeply oversold
Average RSI 32 =
Last 3 times this happened?
Market recovered 15-20% 🚀
Screenshot these levels 📸
— The Crypto Scout 🎯
#bitcoin #BTC #CryptoCharts
1
179

·
--
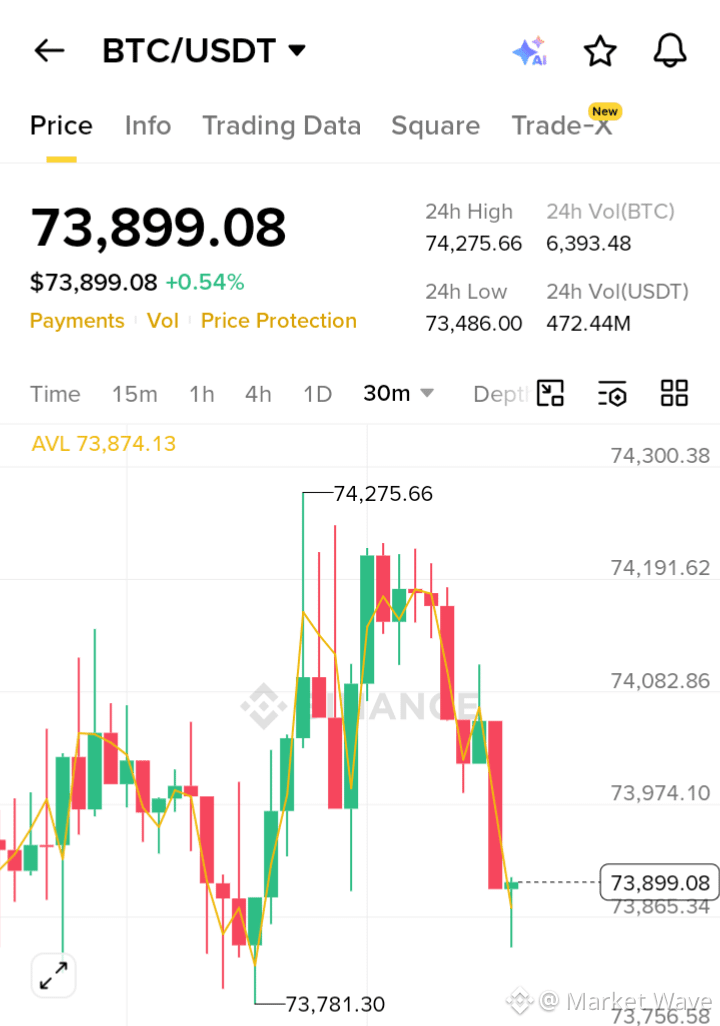
$BTC/USDT TECHNICAL ANALYSIS: BULLISH REBOUND EXPECTED $BTC
Trading Strategy
Direction: Bullish (Long)
Target 1 (TP1): 74,150.00
Target 2 (TP2): 74,275.00
Target 3 (TP3): 74,450.00
Stop Loss (SL): 73,650.00
#Bitcoin #CryptoTrading. #TechnicalAnalysis #Bullish #CryptoCharts
$BTC /USDT TECHNICAL ANALYSIS: BULLISH REBOUND EXPECTED $BTC
Trading Strategy
Direction: Bullish (Long)
Target 1 (TP1): 74,150.00
Target 2 (TP2): 74,275.00
Target 3 (TP3): 74,450.00
Stop Loss (SL): 73,650.00
#Bitcoin #CryptoTrading. #TechnicalAnalysis #Bullish #CryptoCharts
Trading Strategy
Direction: Bullish (Long)
Target 1 (TP1): 74,150.00
Target 2 (TP2): 74,275.00
Target 3 (TP3): 74,450.00
Stop Loss (SL): 73,650.00
#Bitcoin #CryptoTrading. #TechnicalAnalysis #Bullish #CryptoCharts
77

·
--
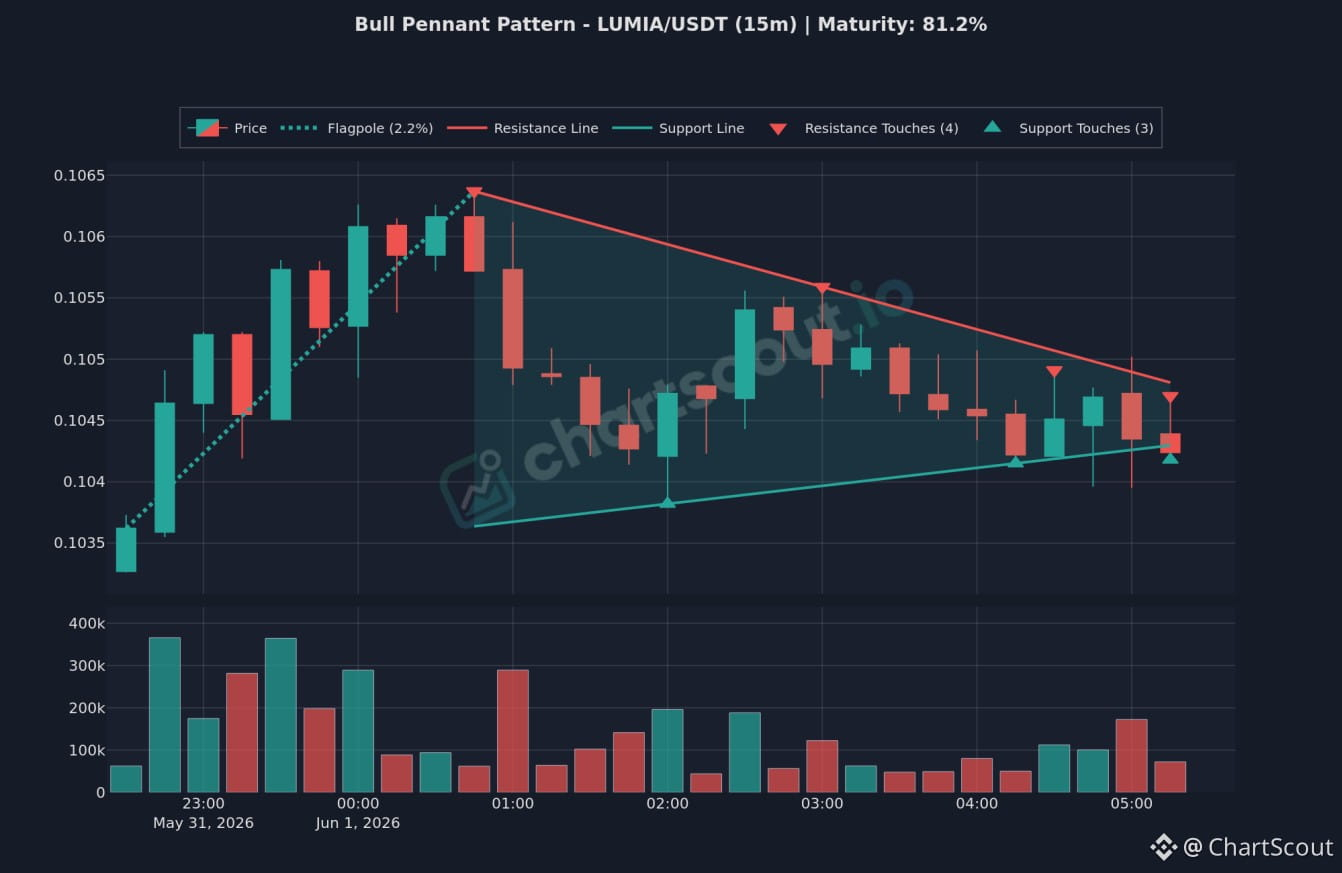
📈 LUMIA/USDT 15m Bull Pennant Setup
A clean Bull Pennant structure is forming on the LUMIA/USDT 15-minute chart, tracked by ChartScout.
Key Technicals:
• Pattern Type: Bull Pennant
• Flagpole: 2.2% initial rise
• Resistance Touches: 4 recorded (upper red boundary)
• Support Touches: 3 recorded (lower teal boundary)
Educational Note:
• Structural Bias: Traditionally classified as a bullish continuation pattern. It represents a brief consolidation phase where sellers regroup and buyers absorb supply before a potential resumption of the upward trend.
Pattern Specifications:
• Timeframe: 15m
• Maturity: 81.2%
• Volume: History shown on the lower panel.
Posting for chart discussion and pattern tracking purposes only. DYOR.
#ChartScout #Lumia #CryptoCharts #TechnicalAnalysiss
📈 LUMIA/USDT 15m Bull Pennant Setup
A clean Bull Pennant structure is forming on the LUMIA/USDT 15-minute chart, tracked by ChartScout.
Key Technicals:
• Pattern Type: Bull Pennant
• Flagpole: 2.2% initial rise
• Resistance Touches: 4 recorded (upper red boundary)
• Support Touches: 3 recorded (lower teal boundary)
Educational Note:
• Structural Bias: Traditionally classified as a bullish continuation pattern. It represents a brief consolidation phase where sellers regroup and buyers absorb supply before a potential resumption of the upward trend.
Pattern Specifications:
• Timeframe: 15m
• Maturity: 81.2%
• Volume: History shown on the lower panel.
Posting for chart discussion and pattern tracking purposes only. DYOR.
#ChartScout #Lumia #CryptoCharts #TechnicalAnalysiss
A clean Bull Pennant structure is forming on the LUMIA/USDT 15-minute chart, tracked by ChartScout.
Key Technicals:
• Pattern Type: Bull Pennant
• Flagpole: 2.2% initial rise
• Resistance Touches: 4 recorded (upper red boundary)
• Support Touches: 3 recorded (lower teal boundary)
Educational Note:
• Structural Bias: Traditionally classified as a bullish continuation pattern. It represents a brief consolidation phase where sellers regroup and buyers absorb supply before a potential resumption of the upward trend.
Pattern Specifications:
• Timeframe: 15m
• Maturity: 81.2%
• Volume: History shown on the lower panel.
Posting for chart discussion and pattern tracking purposes only. DYOR.
#ChartScout #Lumia #CryptoCharts #TechnicalAnalysiss
1
1.1k
·
--
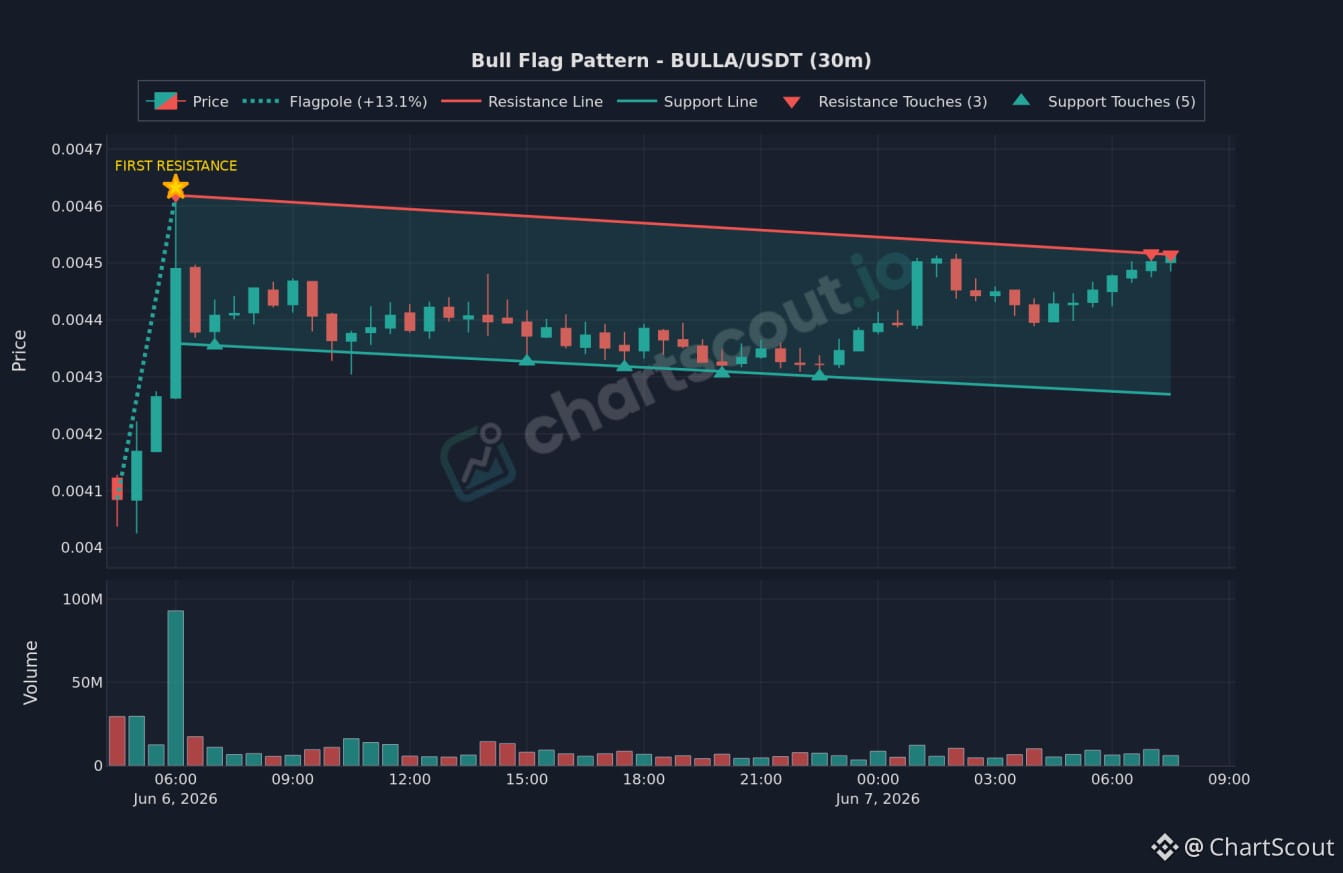
📈 BULLA/USDT 30m Bull Flag Setup
A clean Bull Flag structure is forming on the BULLA/USDT 30-minute chart, tracked by ChartScout.
Key Technicals:
• Pattern Type: Bull Flag
• Flagpole: +13.1% initial rise leading to a "First Resistance" point.
• Resistance Line: 3 touches recorded (upper red boundary)
• Support Line: 5 touches recorded (lower teal boundary)
Educational Note:
• Structural Bias: Traditionally classified as a bullish continuation pattern. It represents a brief consolidation phase where sellers regroup and buyers absorb supply before a potential resumption of the upward trend.
Pattern Specifications:
• Timeframe: 30m
• Volume: History shown on the lower panel.
Posting for chart discussion and pattern tracking purposes only. DYOR.
#ChartScout #BULLA #CryptoCharts #TechnicalAnalysis
📈 BULLA/USDT 30m Bull Flag Setup
A clean Bull Flag structure is forming on the BULLA/USDT 30-minute chart, tracked by ChartScout.
Key Technicals:
• Pattern Type: Bull Flag
• Flagpole: +13.1% initial rise leading to a "First Resistance" point.
• Resistance Line: 3 touches recorded (upper red boundary)
• Support Line: 5 touches recorded (lower teal boundary)
Educational Note:
• Structural Bias: Traditionally classified as a bullish continuation pattern. It represents a brief consolidation phase where sellers regroup and buyers absorb supply before a potential resumption of the upward trend.
Pattern Specifications:
• Timeframe: 30m
• Volume: History shown on the lower panel.
Posting for chart discussion and pattern tracking purposes only. DYOR.
#ChartScout #BULLA #CryptoCharts #TechnicalAnalysis
A clean Bull Flag structure is forming on the BULLA/USDT 30-minute chart, tracked by ChartScout.
Key Technicals:
• Pattern Type: Bull Flag
• Flagpole: +13.1% initial rise leading to a "First Resistance" point.
• Resistance Line: 3 touches recorded (upper red boundary)
• Support Line: 5 touches recorded (lower teal boundary)
Educational Note:
• Structural Bias: Traditionally classified as a bullish continuation pattern. It represents a brief consolidation phase where sellers regroup and buyers absorb supply before a potential resumption of the upward trend.
Pattern Specifications:
• Timeframe: 30m
• Volume: History shown on the lower panel.
Posting for chart discussion and pattern tracking purposes only. DYOR.
#ChartScout #BULLA #CryptoCharts #TechnicalAnalysis
2
1.8k
·
--
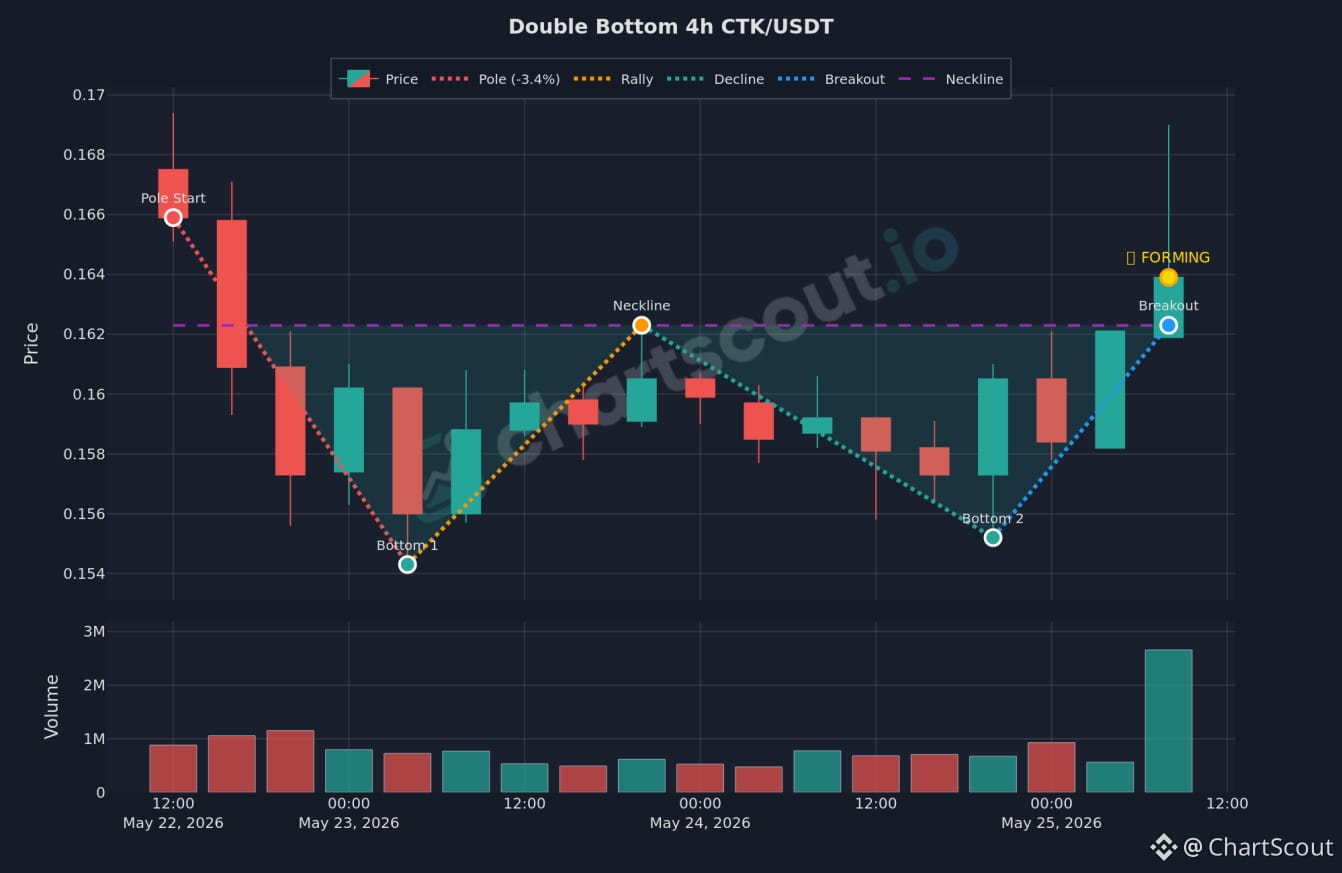
CTK/USDT 4h Double Bottom Pattern
Sharing the CTK/USDT 4-hour chart from ChartScout, illustrating a Double Bottom pattern.
Chart Details:
Pattern: Double Bottom
Timeframe: 4-hour (4h)
Status: Forming
Volume: Historical volume activity is presented on the lower panel.
Posting for chart discussion and pattern tracking purposes only. DYOR.
#ChartScout #CTK #CryptoCharts #TechnicalAnalysis
CTK/USDT 4h Double Bottom Pattern
Sharing the CTK/USDT 4-hour chart from ChartScout, illustrating a Double Bottom pattern.
Chart Details:
Pattern: Double Bottom
Timeframe: 4-hour (4h)
Status: Forming
Volume: Historical volume activity is presented on the lower panel.
Posting for chart discussion and pattern tracking purposes only. DYOR.
#ChartScout #CTK #CryptoCharts #TechnicalAnalysis
Sharing the CTK/USDT 4-hour chart from ChartScout, illustrating a Double Bottom pattern.
Chart Details:
Pattern: Double Bottom
Timeframe: 4-hour (4h)
Status: Forming
Volume: Historical volume activity is presented on the lower panel.
Posting for chart discussion and pattern tracking purposes only. DYOR.
#ChartScout #CTK #CryptoCharts #TechnicalAnalysis
4
1
1k

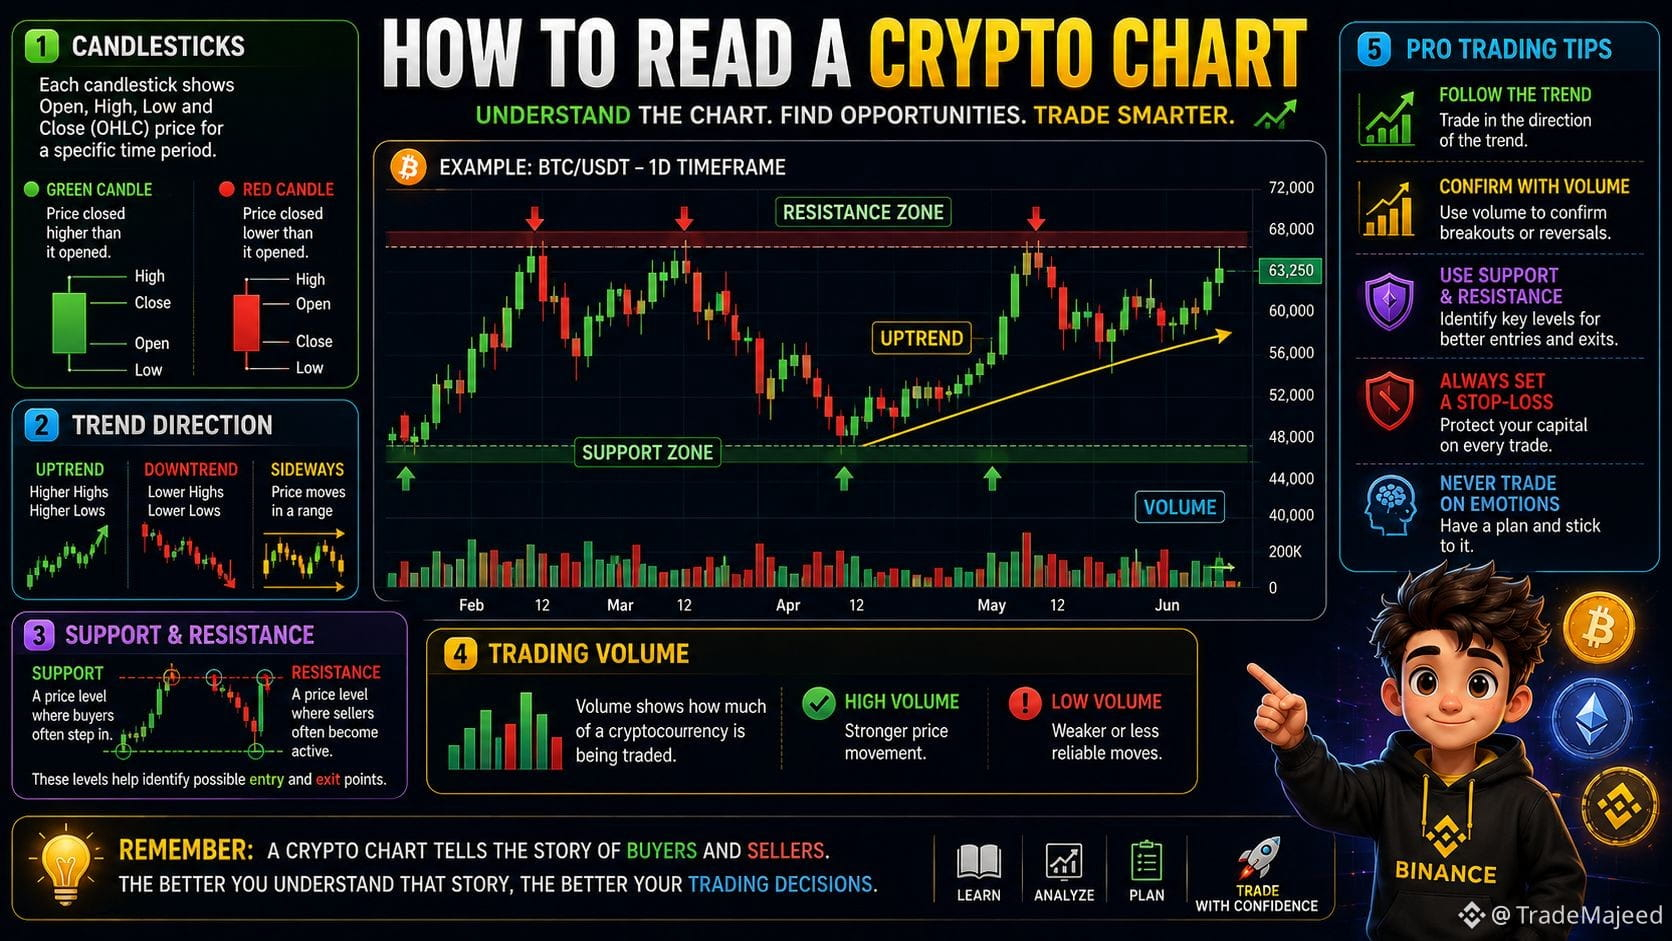
📈 How to Read a Crypto Chart
Learning to read a crypto chart is one of the first steps to becoming a smarter trader. Charts help you understand price movement, market trends, and potential trading opportunities.
📊 1. Candlesticks
Each candlestick shows Open, High, Low, and Close (OHLC) prices for a specific time period.
Green Candle 🟢: Price closed higher than it opened.
Red Candle 🔴: Price closed lower than it opened.
📉 2. Trend Direction
📈 Uptrend: Higher highs and higher lows.
📉 Downtrend: Lower highs and lower lows.
➡️ Sideways: Price moves within a range without a clear direction.
🟢 3. Support & Resistance
Support: A price level where buyers often step in.
Resistance: A price level where sellers often become active.
These levels help identify possible entry and exit points.
📊 4. Trading Volume
Volume shows how much of a cryptocurrency is being traded.
✅ High volume = Stronger price movement.
⚠️ Low volume = Weaker or less reliable moves.
💡 Pro Trading Tips
✅ Follow the overall trend.
✅ Confirm moves with volume.
✅ Use Support & Resistance.
✅ Always set a Stop-Loss.
✅ Never trade based on emotions.
🎯 Remember: A crypto chart tells the story of buyers and sellers. The better you understand that story, the better your trading decisions can become.
Read the Chart. Manage the Risk. Trade with Confidence. 📈
#Crypto_Jobs🎯 #CryptoTrading. #CryptoCharts #TechnicalAnalysiss #TradingTales
📈 How to Read a Crypto Chart
Learning to read a crypto chart is one of the first steps to becoming a smarter trader. Charts help you understand price movement, market trends, and potential trading opportunities.
📊 1. Candlesticks
Each candlestick shows Open, High, Low, and Close (OHLC) prices for a specific time period.
Green Candle 🟢: Price closed higher than it opened.
Red Candle 🔴: Price closed lower than it opened.
📉 2. Trend Direction
📈 Uptrend: Higher highs and higher lows.
📉 Downtrend: Lower highs and lower lows.
➡️ Sideways: Price moves within a range without a clear direction.
🟢 3. Support & Resistance
Support: A price level where buyers often step in.
Resistance: A price level where sellers often become active.
These levels help identify possible entry and exit points.
📊 4. Trading Volume
Volume shows how much of a cryptocurrency is being traded.
✅ High volume = Stronger price movement.
⚠️ Low volume = Weaker or less reliable moves.
💡 Pro Trading Tips
✅ Follow the overall trend.
✅ Confirm moves with volume.
✅ Use Support & Resistance.
✅ Always set a Stop-Loss.
✅ Never trade based on emotions.
🎯 Remember: A crypto chart tells the story of buyers and sellers. The better you understand that story, the better your trading decisions can become.
Read the Chart. Manage the Risk. Trade with Confidence. 📈
#Crypto_Jobs🎯 #CryptoTrading. #CryptoCharts #TechnicalAnalysiss #TradingTales
Learning to read a crypto chart is one of the first steps to becoming a smarter trader. Charts help you understand price movement, market trends, and potential trading opportunities.
📊 1. Candlesticks
Each candlestick shows Open, High, Low, and Close (OHLC) prices for a specific time period.
Green Candle 🟢: Price closed higher than it opened.
Red Candle 🔴: Price closed lower than it opened.
📉 2. Trend Direction
📈 Uptrend: Higher highs and higher lows.
📉 Downtrend: Lower highs and lower lows.
➡️ Sideways: Price moves within a range without a clear direction.
🟢 3. Support & Resistance
Support: A price level where buyers often step in.
Resistance: A price level where sellers often become active.
These levels help identify possible entry and exit points.
📊 4. Trading Volume
Volume shows how much of a cryptocurrency is being traded.
✅ High volume = Stronger price movement.
⚠️ Low volume = Weaker or less reliable moves.
💡 Pro Trading Tips
✅ Follow the overall trend.
✅ Confirm moves with volume.
✅ Use Support & Resistance.
✅ Always set a Stop-Loss.
✅ Never trade based on emotions.
🎯 Remember: A crypto chart tells the story of buyers and sellers. The better you understand that story, the better your trading decisions can become.
Read the Chart. Manage the Risk. Trade with Confidence. 📈
#Crypto_Jobs🎯 #CryptoTrading. #CryptoCharts #TechnicalAnalysiss #TradingTales
89

Patterns Don’t Lie 📊🕶️
Charts are just history repeating in different colors. $BTC is carving out a pattern eerily similar to its pre-2021 setup — same structure, different scale. $NEAR just reclaimed a key support-turned-resistance level, a flip that often fuels momentum. $PYTH is quietly building higher lows while nobody’s watching. 👁️ History doesn’t repeat, but it rhymes.
#TechnicalAnalysis #CryptoCharts #EliteTraders
{spot}(PYTHUSDT)
{spot}(NEARUSDT)
{spot}(BTCUSDT)
Patterns Don’t Lie 📊🕶️
Charts are just history repeating in different colors. $BTC is carving out a pattern eerily similar to its pre-2021 setup — same structure, different scale. $NEAR just reclaimed a key support-turned-resistance level, a flip that often fuels momentum. $PYTH is quietly building higher lows while nobody’s watching. 👁️ History doesn’t repeat, but it rhymes.
#TechnicalAnalysis #CryptoCharts #EliteTraders
Charts are just history repeating in different colors. $BTC is carving out a pattern eerily similar to its pre-2021 setup — same structure, different scale. $NEAR just reclaimed a key support-turned-resistance level, a flip that often fuels momentum. $PYTH is quietly building higher lows while nobody’s watching. 👁️ History doesn’t repeat, but it rhymes.
#TechnicalAnalysis #CryptoCharts #EliteTraders
1
116

📚 How to Read a Crypto Price Chart: Candlestick Patterns and Technical Basics
On July 4, 2026, reading price charts is essential for understanding market moves. A candlestick shows four prices: open, high, low, close. Bitcoin $BTC today had open ~$61,400, high $62,821, low $61,427, close ~$62,612.
The body of the candle represents the open-to-close range. Green candles (close > open) mean buying pressure. Red (close < open) means selling pressure. The wicks show the full intraday range.
With Cardano $ADA showing an 11.6% range today ($0.1633 to $0.1823), understanding these patterns helps traders identify support, resistance, and momentum.
📌 Key Takeaway:
Candlestick charts are the language of market analysis. Learning to read them is the first step toward understanding price action and market psychology.
#TechnicalAnalysis #CryptoCharts #Educational
#BinanceAlphaAlert
📚 How to Read a Crypto Price Chart: Candlestick Patterns and Technical Basics
On July 4, 2026, reading price charts is essential for understanding market moves. A candlestick shows four prices: open, high, low, close. Bitcoin $BTC today had open ~$61,400, high $62,821, low $61,427, close ~$62,612.
The body of the candle represents the open-to-close range. Green candles (close > open) mean buying pressure. Red (close < open) means selling pressure. The wicks show the full intraday range.
With Cardano $ADA showing an 11.6% range today ($0.1633 to $0.1823), understanding these patterns helps traders identify support, resistance, and momentum.
📌 Key Takeaway:
Candlestick charts are the language of market analysis. Learning to read them is the first step toward understanding price action and market psychology.
#TechnicalAnalysis #CryptoCharts #Educational
#BinanceAlphaAlert
On July 4, 2026, reading price charts is essential for understanding market moves. A candlestick shows four prices: open, high, low, close. Bitcoin $BTC today had open ~$61,400, high $62,821, low $61,427, close ~$62,612.
The body of the candle represents the open-to-close range. Green candles (close > open) mean buying pressure. Red (close < open) means selling pressure. The wicks show the full intraday range.
With Cardano $ADA showing an 11.6% range today ($0.1633 to $0.1823), understanding these patterns helps traders identify support, resistance, and momentum.
📌 Key Takeaway:
Candlestick charts are the language of market analysis. Learning to read them is the first step toward understanding price action and market psychology.
#TechnicalAnalysis #CryptoCharts #Educational
#BinanceAlphaAlert
55
·
--
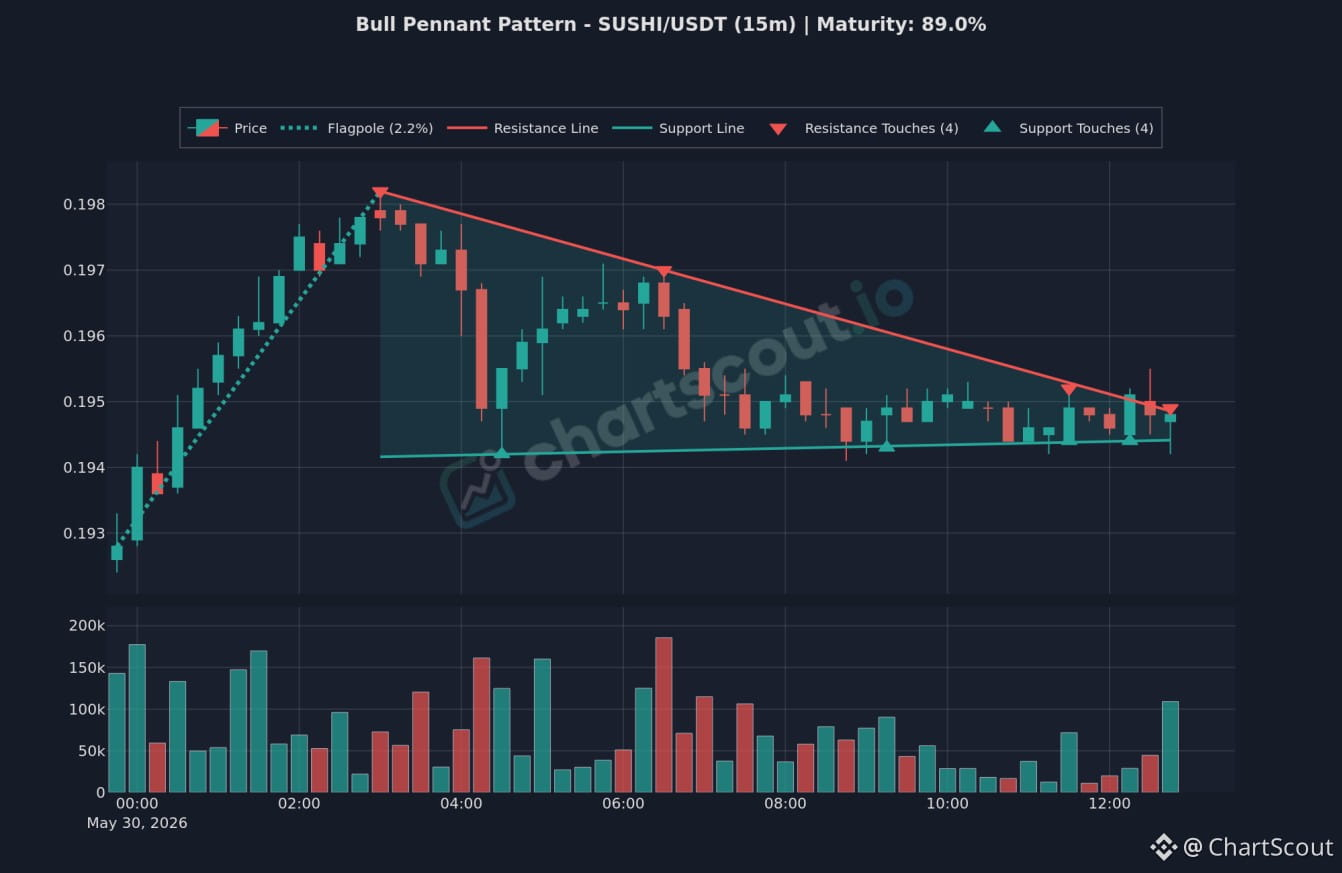
📈 SUSHI/USDT 15m Bull Pennant Setup
A clean Bull Pennant structure is forming on the SUSHI/USDT 15-minute chart, tracked by ChartScout.
Key Technicals:
• Pattern: Bull Pennant
• Flagpole: 2.2% rise
• Resistance Line: 4 touches recorded (upper red boundary)
• Support Line: 4 touches recorded (lower teal boundary)
• Setup: Traditionally classified as a bullish continuation pattern, representing a brief consolidation phase before a potential resumption of the upward trend.
Pattern
• Timeframe: 15m
• Maturity: 89.0%
• Volume: History shown on the lower panel.
Posting for chart discussion and pattern tracking purposes only. DYOR.
#ChartScout #sushi #CryptoCharts #TechnicalAnalysis
📈 SUSHI/USDT 15m Bull Pennant Setup
A clean Bull Pennant structure is forming on the SUSHI/USDT 15-minute chart, tracked by ChartScout.
Key Technicals:
• Pattern: Bull Pennant
• Flagpole: 2.2% rise
• Resistance Line: 4 touches recorded (upper red boundary)
• Support Line: 4 touches recorded (lower teal boundary)
• Setup: Traditionally classified as a bullish continuation pattern, representing a brief consolidation phase before a potential resumption of the upward trend.
Pattern
• Timeframe: 15m
• Maturity: 89.0%
• Volume: History shown on the lower panel.
Posting for chart discussion and pattern tracking purposes only. DYOR.
#ChartScout #sushi #CryptoCharts #TechnicalAnalysis
A clean Bull Pennant structure is forming on the SUSHI/USDT 15-minute chart, tracked by ChartScout.
Key Technicals:
• Pattern: Bull Pennant
• Flagpole: 2.2% rise
• Resistance Line: 4 touches recorded (upper red boundary)
• Support Line: 4 touches recorded (lower teal boundary)
• Setup: Traditionally classified as a bullish continuation pattern, representing a brief consolidation phase before a potential resumption of the upward trend.
Pattern
• Timeframe: 15m
• Maturity: 89.0%
• Volume: History shown on the lower panel.
Posting for chart discussion and pattern tracking purposes only. DYOR.
#ChartScout #sushi #CryptoCharts #TechnicalAnalysis
1
1.2k
·
--
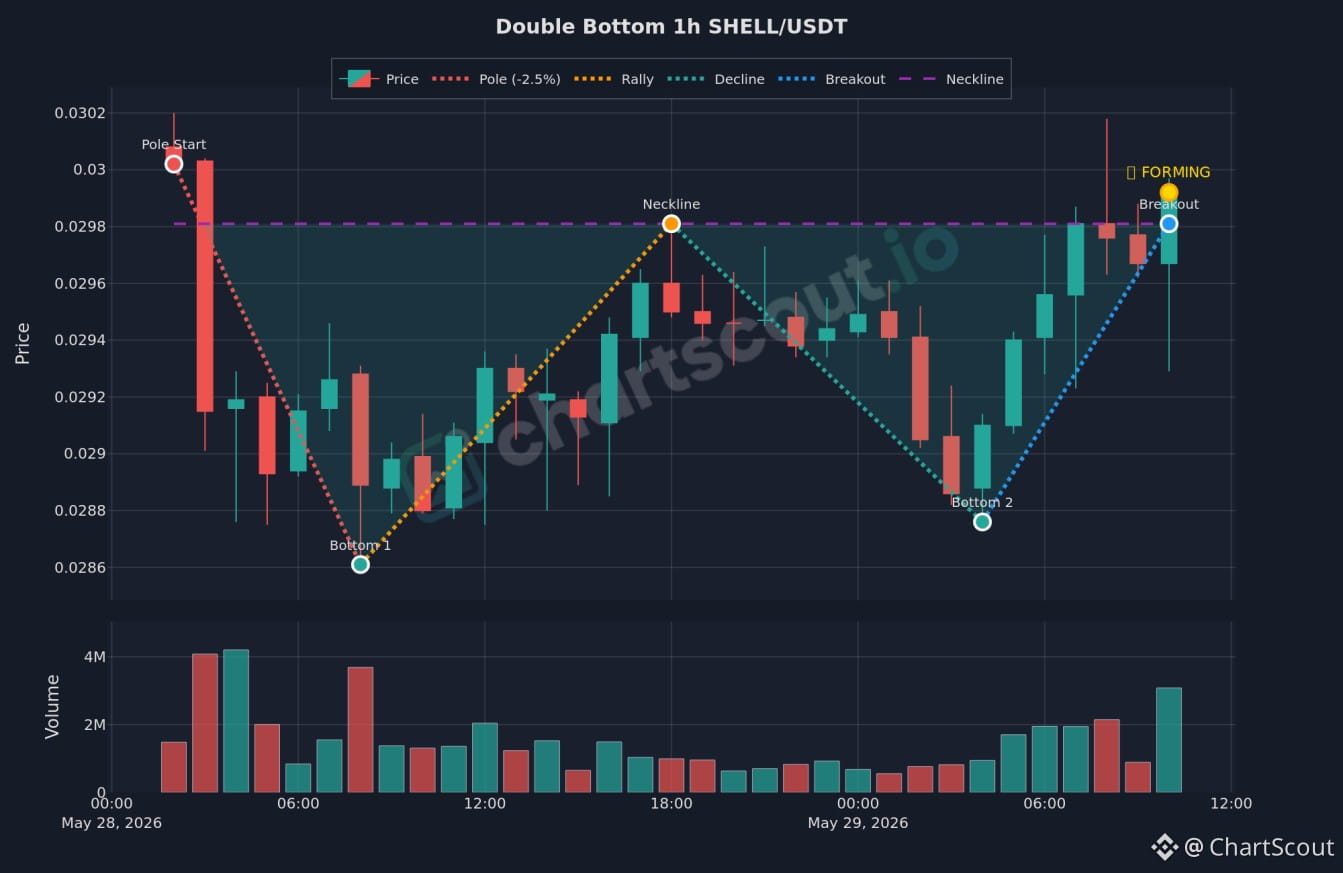
SHELL/USDT 1h Double Bottom Pattern
Sharing the SHELL/USDT 1-hour chart from ChartScout, illustrating a Double Bottom pattern.
Chart Details:
Pattern: Double Bottom
Timeframe: 1-hour (1h)
Status: Forming
Structural Elements:
Pole Start (-2.5%)
Bottom 1 (approx. 0.0286)
Neckline (approx. 0.0298)
Bottom 2 (approx. 0.02875)
Breakout Node (approx. 0.0298)
Volume: Historical volume activity is presented on the lower panel.
Posting for chart discussion and pattern tracking purposes only. DYOR.
#ChartScout #SHELL #CryptoCharts #TechnicalAnalysis
SHELL/USDT 1h Double Bottom Pattern
Sharing the SHELL/USDT 1-hour chart from ChartScout, illustrating a Double Bottom pattern.
Chart Details:
Pattern: Double Bottom
Timeframe: 1-hour (1h)
Status: Forming
Structural Elements:
Pole Start (-2.5%)
Bottom 1 (approx. 0.0286)
Neckline (approx. 0.0298)
Bottom 2 (approx. 0.02875)
Breakout Node (approx. 0.0298)
Volume: Historical volume activity is presented on the lower panel.
Posting for chart discussion and pattern tracking purposes only. DYOR.
#ChartScout #SHELL #CryptoCharts #TechnicalAnalysis
Sharing the SHELL/USDT 1-hour chart from ChartScout, illustrating a Double Bottom pattern.
Chart Details:
Pattern: Double Bottom
Timeframe: 1-hour (1h)
Status: Forming
Structural Elements:
Pole Start (-2.5%)
Bottom 1 (approx. 0.0286)
Neckline (approx. 0.0298)
Bottom 2 (approx. 0.02875)
Breakout Node (approx. 0.0298)
Volume: Historical volume activity is presented on the lower panel.
Posting for chart discussion and pattern tracking purposes only. DYOR.
#ChartScout #SHELL #CryptoCharts #TechnicalAnalysis
2
1.1k

·
--
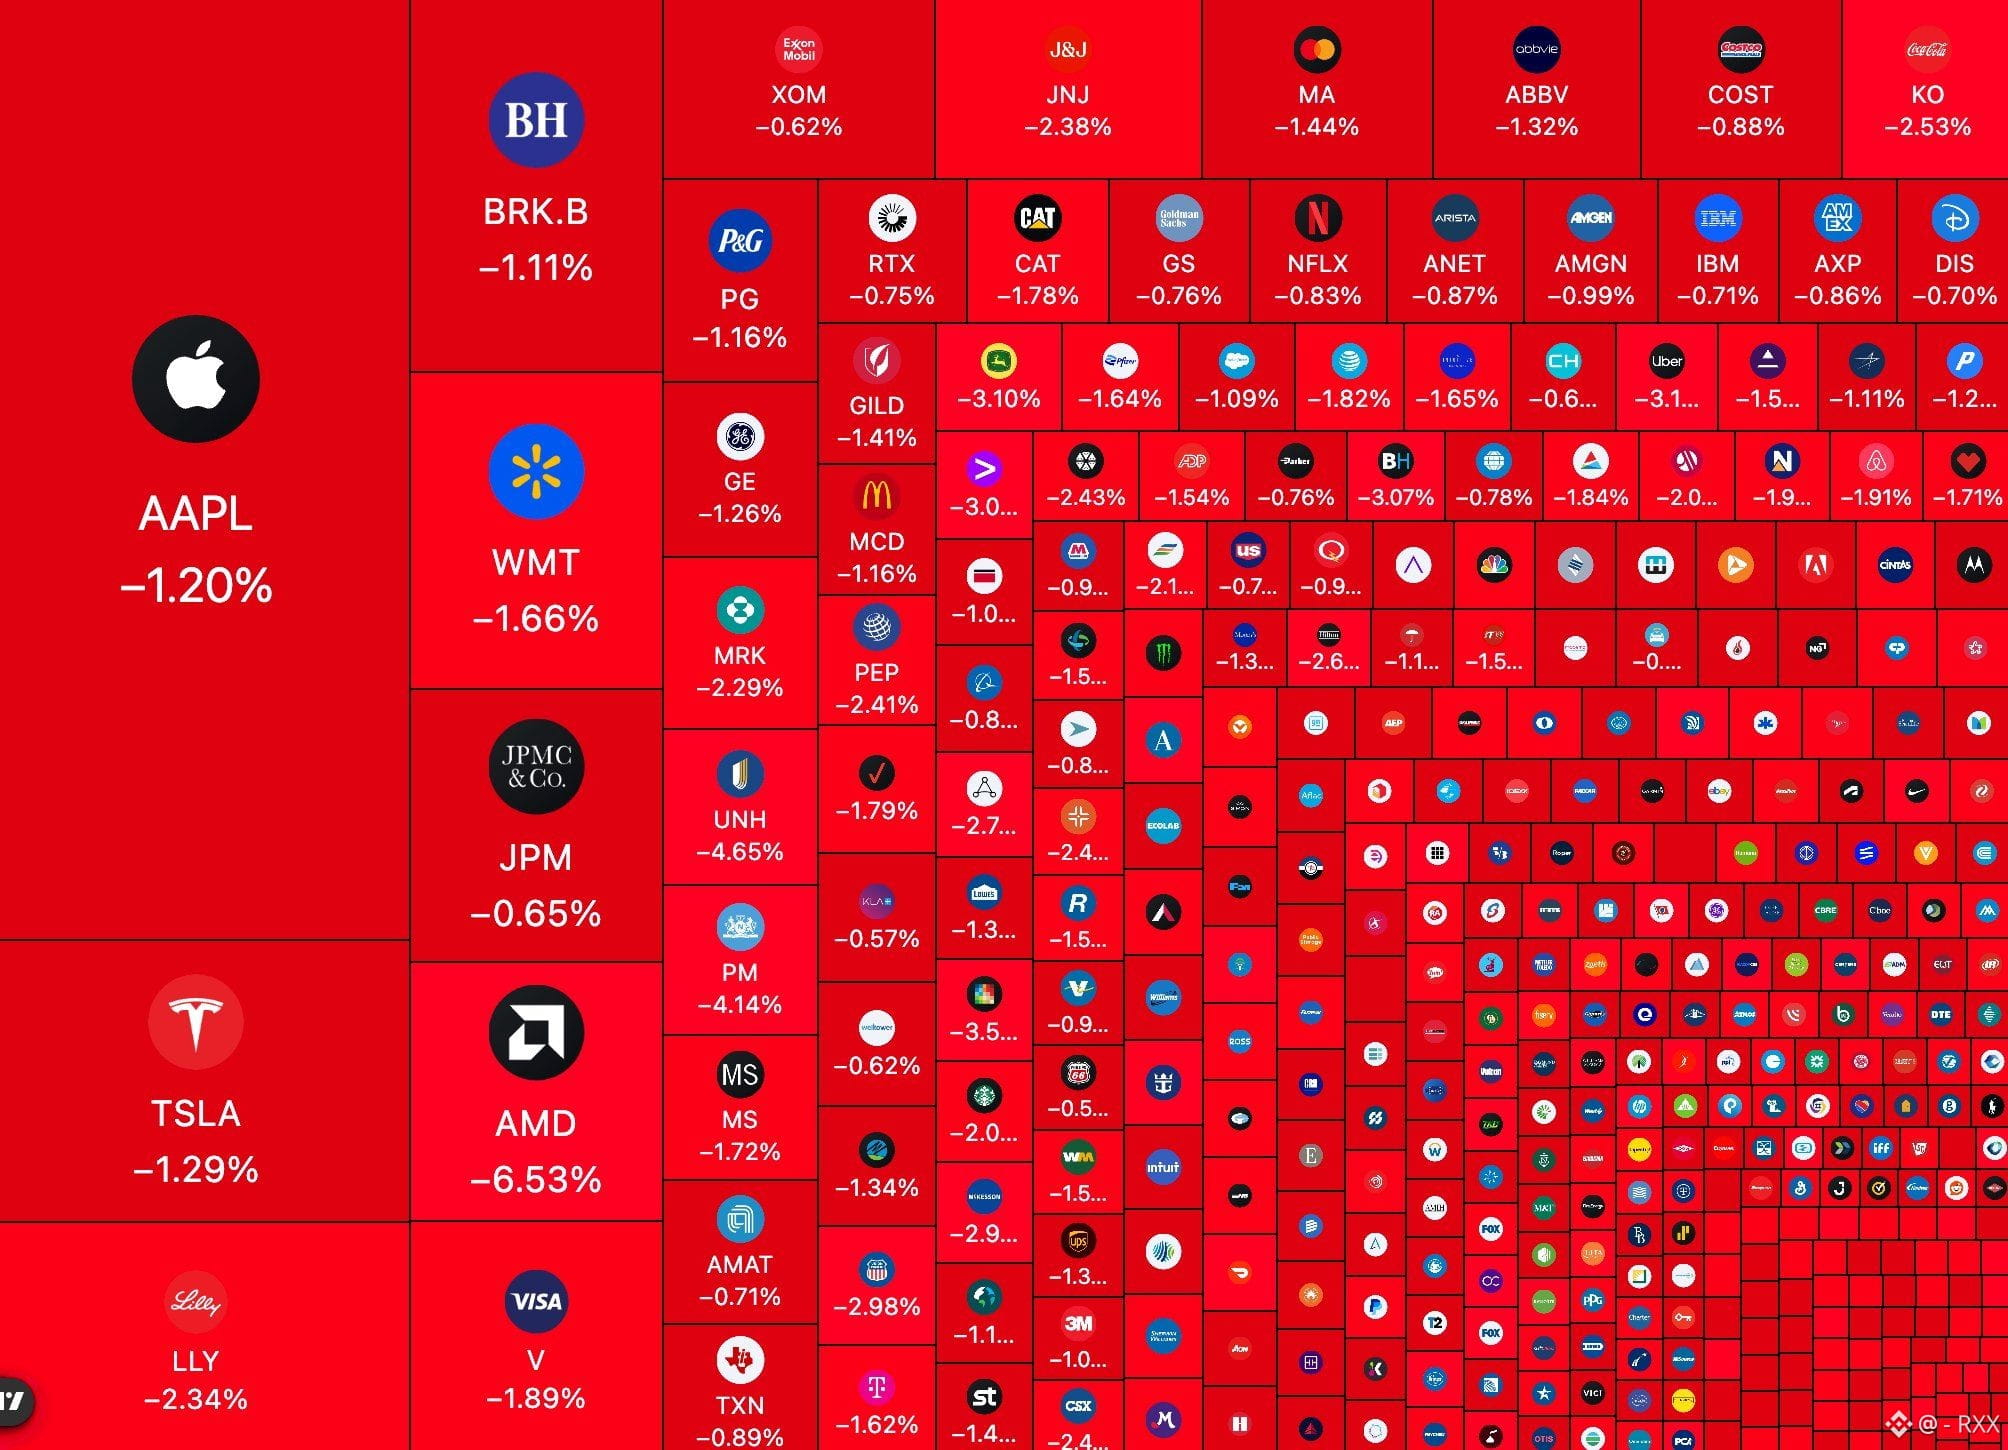
⚡ Three charts. One hour. Who broke first?
Ash Crypto estimated that U.S. equities lost $1.16T in about an hour on Nov. 19. Here’s a quick chart replay for that window.
Open $BTC, $ETH and $SOL on the 15-minute timeframe. Draw a line at each coin’s low from just before the slide. Record two things: which coin traded through that line first, and which one was first to close back above it.
You might get two very different answers. That’s what makes the replay worth doing. Was the first coin to break also the first to recover? $EVAA
#MarketVolatility #CryptoCharts #PriceAction
⚡ Three charts. One hour. Who broke first?
Ash Crypto estimated that U.S. equities lost $1.16T in about an hour on Nov. 19. Here’s a quick chart replay for that window.
Open $BTC, $ETH and $SOL on the 15-minute timeframe. Draw a line at each coin’s low from just before the slide. Record two things: which coin traded through that line first, and which one was first to close back above it.
You might get two very different answers. That’s what makes the replay worth doing. Was the first coin to break also the first to recover? $EVAA
#MarketVolatility #CryptoCharts #PriceAction
Ash Crypto estimated that U.S. equities lost $1.16T in about an hour on Nov. 19. Here’s a quick chart replay for that window.
Open $BTC, $ETH and $SOL on the 15-minute timeframe. Draw a line at each coin’s low from just before the slide. Record two things: which coin traded through that line first, and which one was first to close back above it.
You might get two very different answers. That’s what makes the replay worth doing. Was the first coin to break also the first to recover? $EVAA
#MarketVolatility #CryptoCharts #PriceAction
1
380
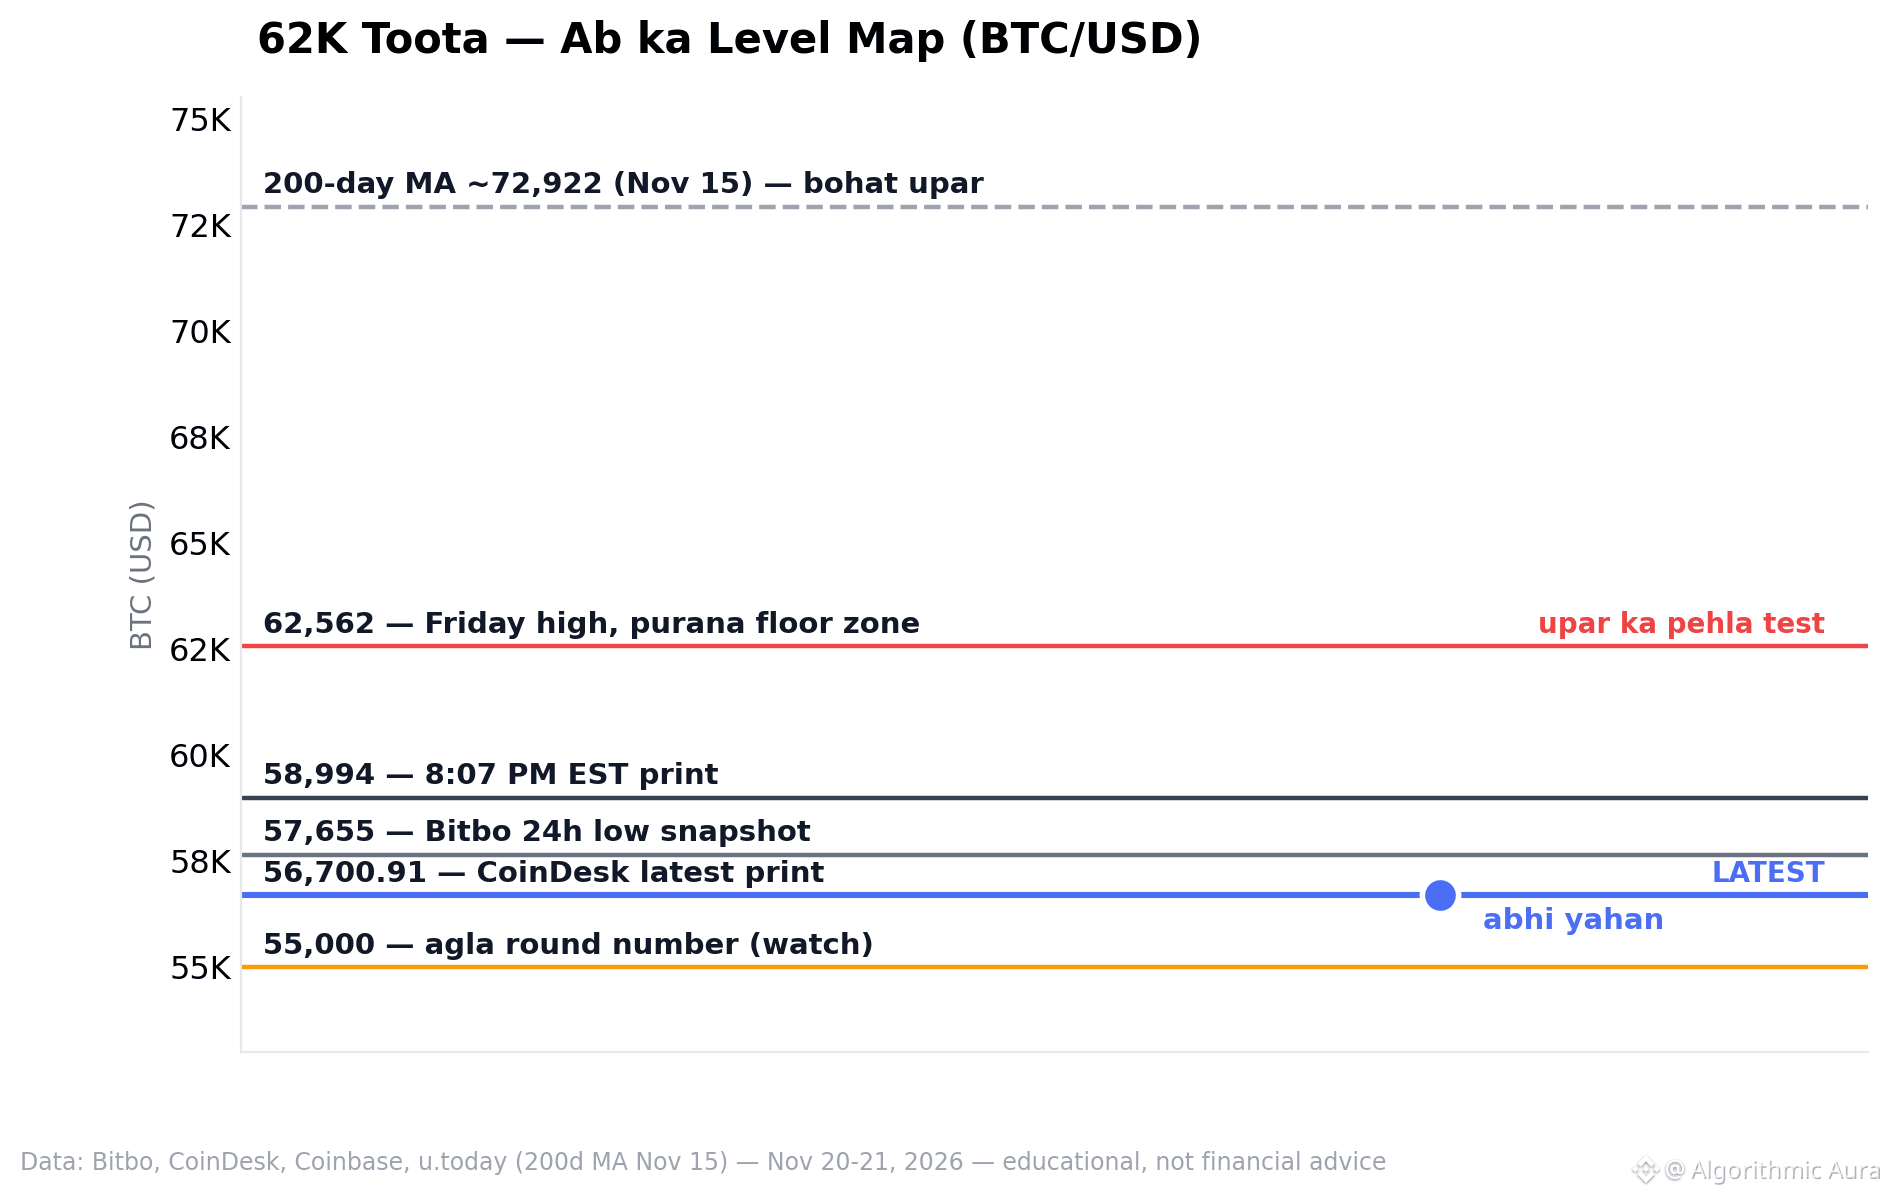
📊 One chart: 62K broke — now the level map.
📍 1) 62,562: Friday’s high — the old floor zone, now the first test above.
📉 2) 58,994 → 57,655 → 56,700.91: overnight prints, three marks in the same zone.
🧊 3) 55,000: the next round number traders are tracking. The 200-day MA at ~72,922 is still far above.
⚠️ Levels aren’t predictions — they’re places where orders tend to sit.
Read them alongside volume — not financial advice.
$BTC
#Bitcoin #CryptoCharts #Levels
📊 One chart: 62K broke — now the level map.
📍 1) 62,562: Friday’s high — the old floor zone, now the first test above.
📉 2) 58,994 → 57,655 → 56,700.91: overnight prints, three marks in the same zone.
🧊 3) 55,000: the next round number traders are tracking. The 200-day MA at ~72,922 is still far above.
⚠️ Levels aren’t predictions — they’re places where orders tend to sit.
Read them alongside volume — not financial advice.
$BTC
#Bitcoin #CryptoCharts #Levels
📍 1) 62,562: Friday’s high — the old floor zone, now the first test above.
📉 2) 58,994 → 57,655 → 56,700.91: overnight prints, three marks in the same zone.
🧊 3) 55,000: the next round number traders are tracking. The 200-day MA at ~72,922 is still far above.
⚠️ Levels aren’t predictions — they’re places where orders tend to sit.
Read them alongside volume — not financial advice.
$BTC
#Bitcoin #CryptoCharts #Levels
14
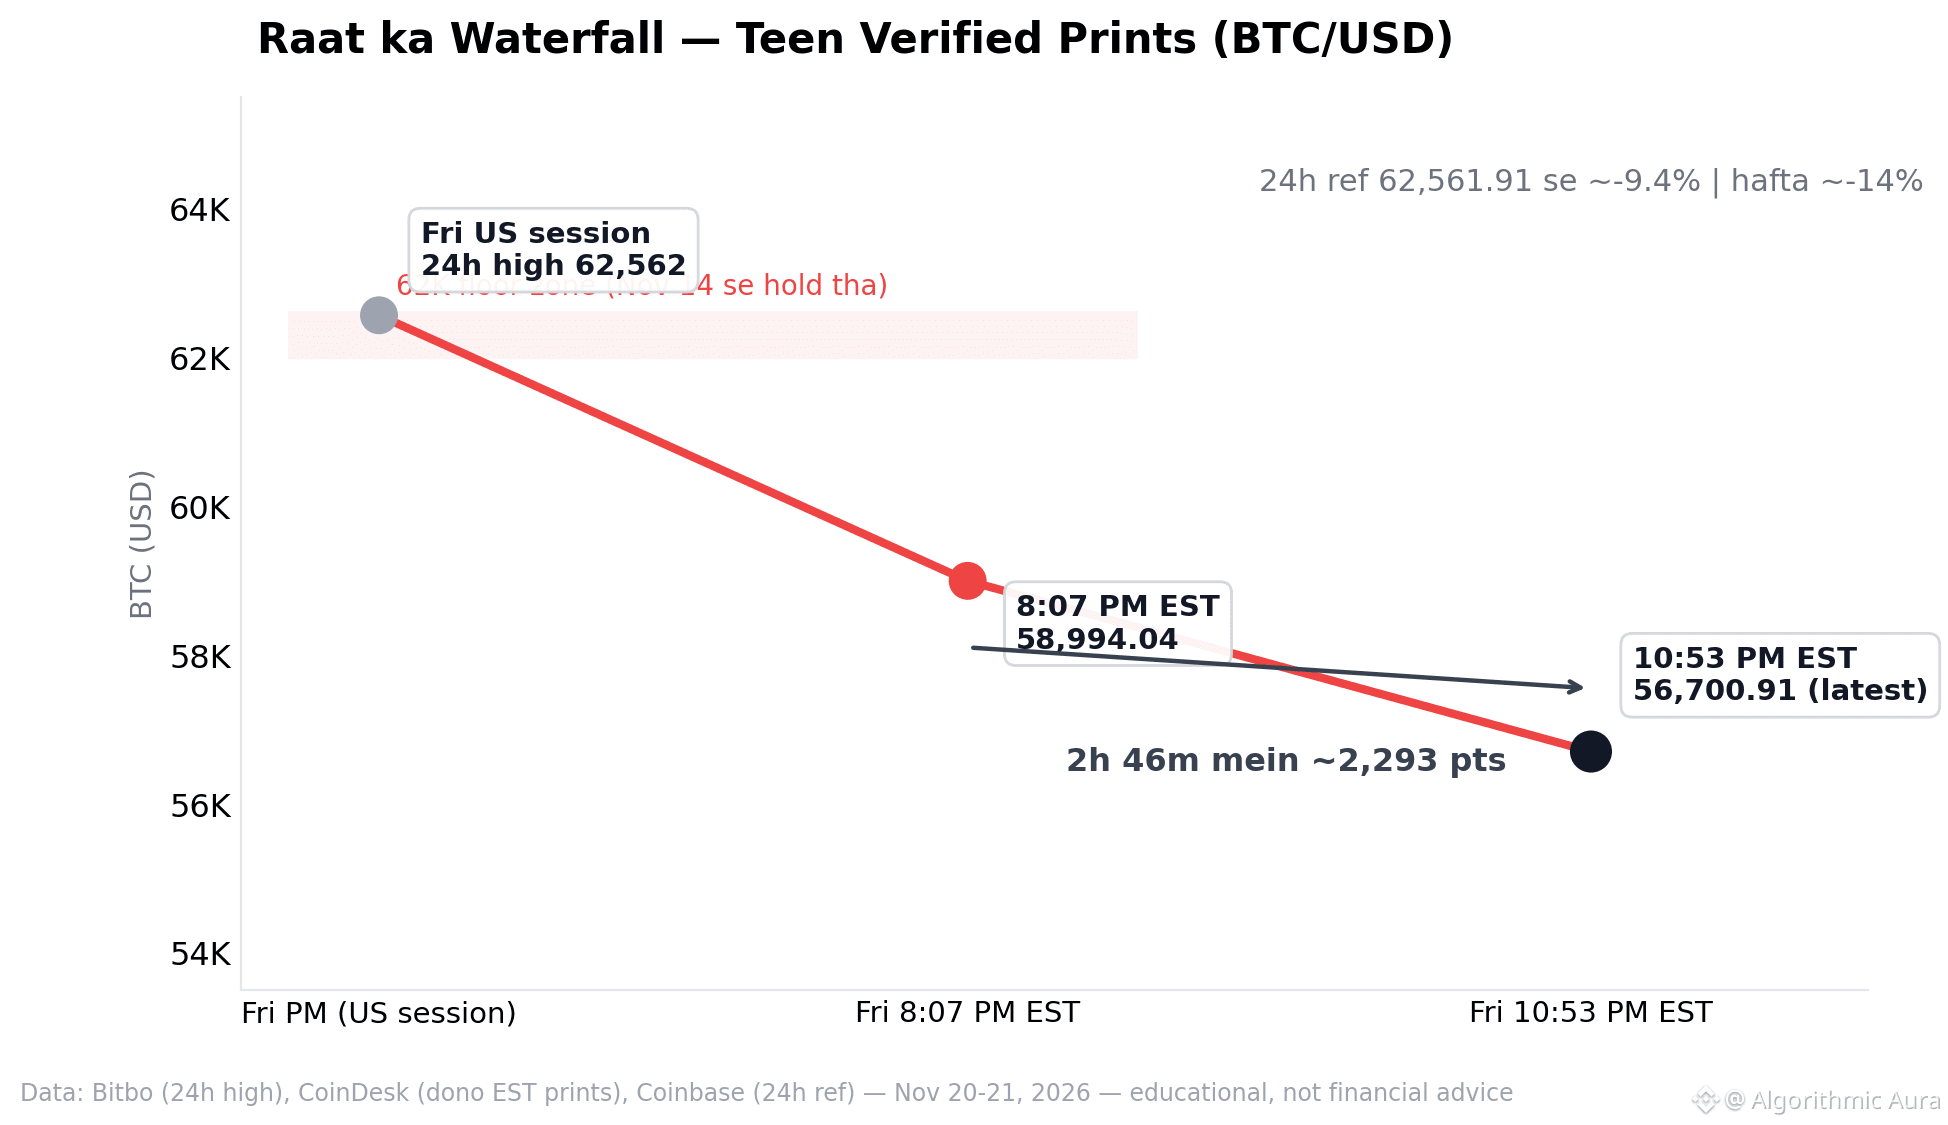
📊 One chart: tonight’s waterfall — three prints, one direction.
📉 1) 62,562 → 58,994 → 56,700.91 — Friday evening EST, a ~2,300-point stair-step.
🧊 2) The 62K floor zone (live since Nov 14) is shaded on the chart — tonight, the journey below it begins.
⚠️ 3) 24h liquidations: 651M USD, longs 83% — the drop was leverage-driven, not spot panic.
👀 The crash didn’t happen in one jolt; it came down the stairs — the pace is the real story.
Watch volume at the levels — not financial advice.
$BTC
#Bitcoin #CryptoCharts #Liquidation
📊 One chart: tonight’s waterfall — three prints, one direction.
📉 1) 62,562 → 58,994 → 56,700.91 — Friday evening EST, a ~2,300-point stair-step.
🧊 2) The 62K floor zone (live since Nov 14) is shaded on the chart — tonight, the journey below it begins.
⚠️ 3) 24h liquidations: 651M USD, longs 83% — the drop was leverage-driven, not spot panic.
👀 The crash didn’t happen in one jolt; it came down the stairs — the pace is the real story.
Watch volume at the levels — not financial advice.
$BTC
#Bitcoin #CryptoCharts #Liquidation
📉 1) 62,562 → 58,994 → 56,700.91 — Friday evening EST, a ~2,300-point stair-step.
🧊 2) The 62K floor zone (live since Nov 14) is shaded on the chart — tonight, the journey below it begins.
⚠️ 3) 24h liquidations: 651M USD, longs 83% — the drop was leverage-driven, not spot panic.
👀 The crash didn’t happen in one jolt; it came down the stairs — the pace is the real story.
Watch volume at the levels — not financial advice.
$BTC
#Bitcoin #CryptoCharts #Liquidation
37
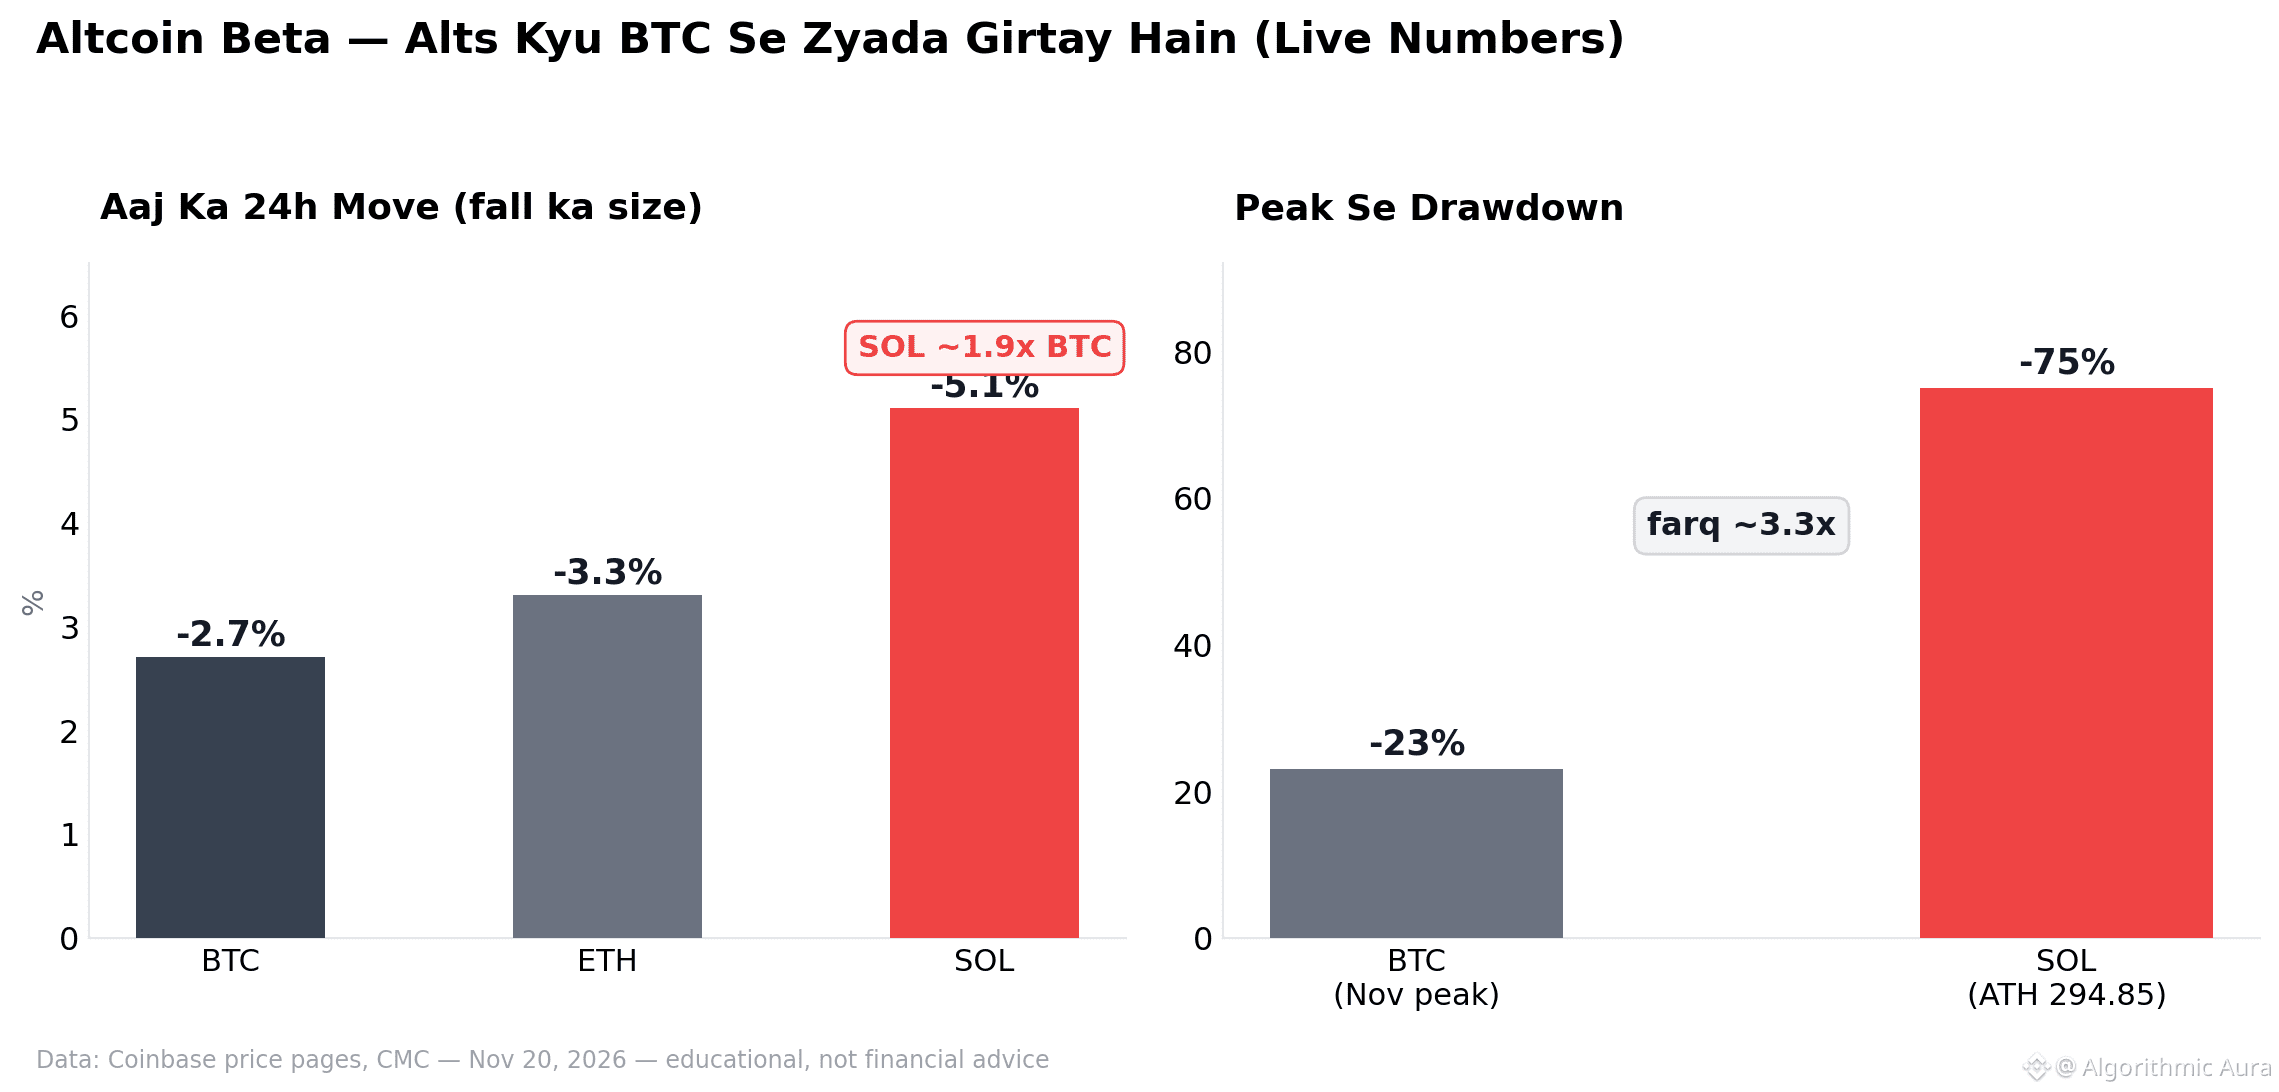
📊 One chart: altcoin beta—with live numbers.
📉 1) Left panel: today's 24h move — BTC -2.7%, ETH -3.3%, SOL -5.1%. SOL ~1.9x BTC.
2) 👀 Right panel: drawdown from peak — BTC ~-23% (Nov peak), SOL ~-75% (ATH 294.85). Difference ~3.3x.
3) 🧮 This is beta: same market, different magnitude—in both directions.
When planning ahead, do the math for both sides, not just the upside.
$SOL $BTC
#Solana #CryptoCharts #TradingEducation
📊 One chart: altcoin beta—with live numbers.
📉 1) Left panel: today's 24h move — BTC -2.7%, ETH -3.3%, SOL -5.1%. SOL ~1.9x BTC.
2) 👀 Right panel: drawdown from peak — BTC ~-23% (Nov peak), SOL ~-75% (ATH 294.85). Difference ~3.3x.
3) 🧮 This is beta: same market, different magnitude—in both directions.
When planning ahead, do the math for both sides, not just the upside.
$SOL $BTC
#Solana #CryptoCharts #TradingEducation
📉 1) Left panel: today's 24h move — BTC -2.7%, ETH -3.3%, SOL -5.1%. SOL ~1.9x BTC.
2) 👀 Right panel: drawdown from peak — BTC ~-23% (Nov peak), SOL ~-75% (ATH 294.85). Difference ~3.3x.
3) 🧮 This is beta: same market, different magnitude—in both directions.
When planning ahead, do the math for both sides, not just the upside.
$SOL $BTC
#Solana #CryptoCharts #TradingEducation
20
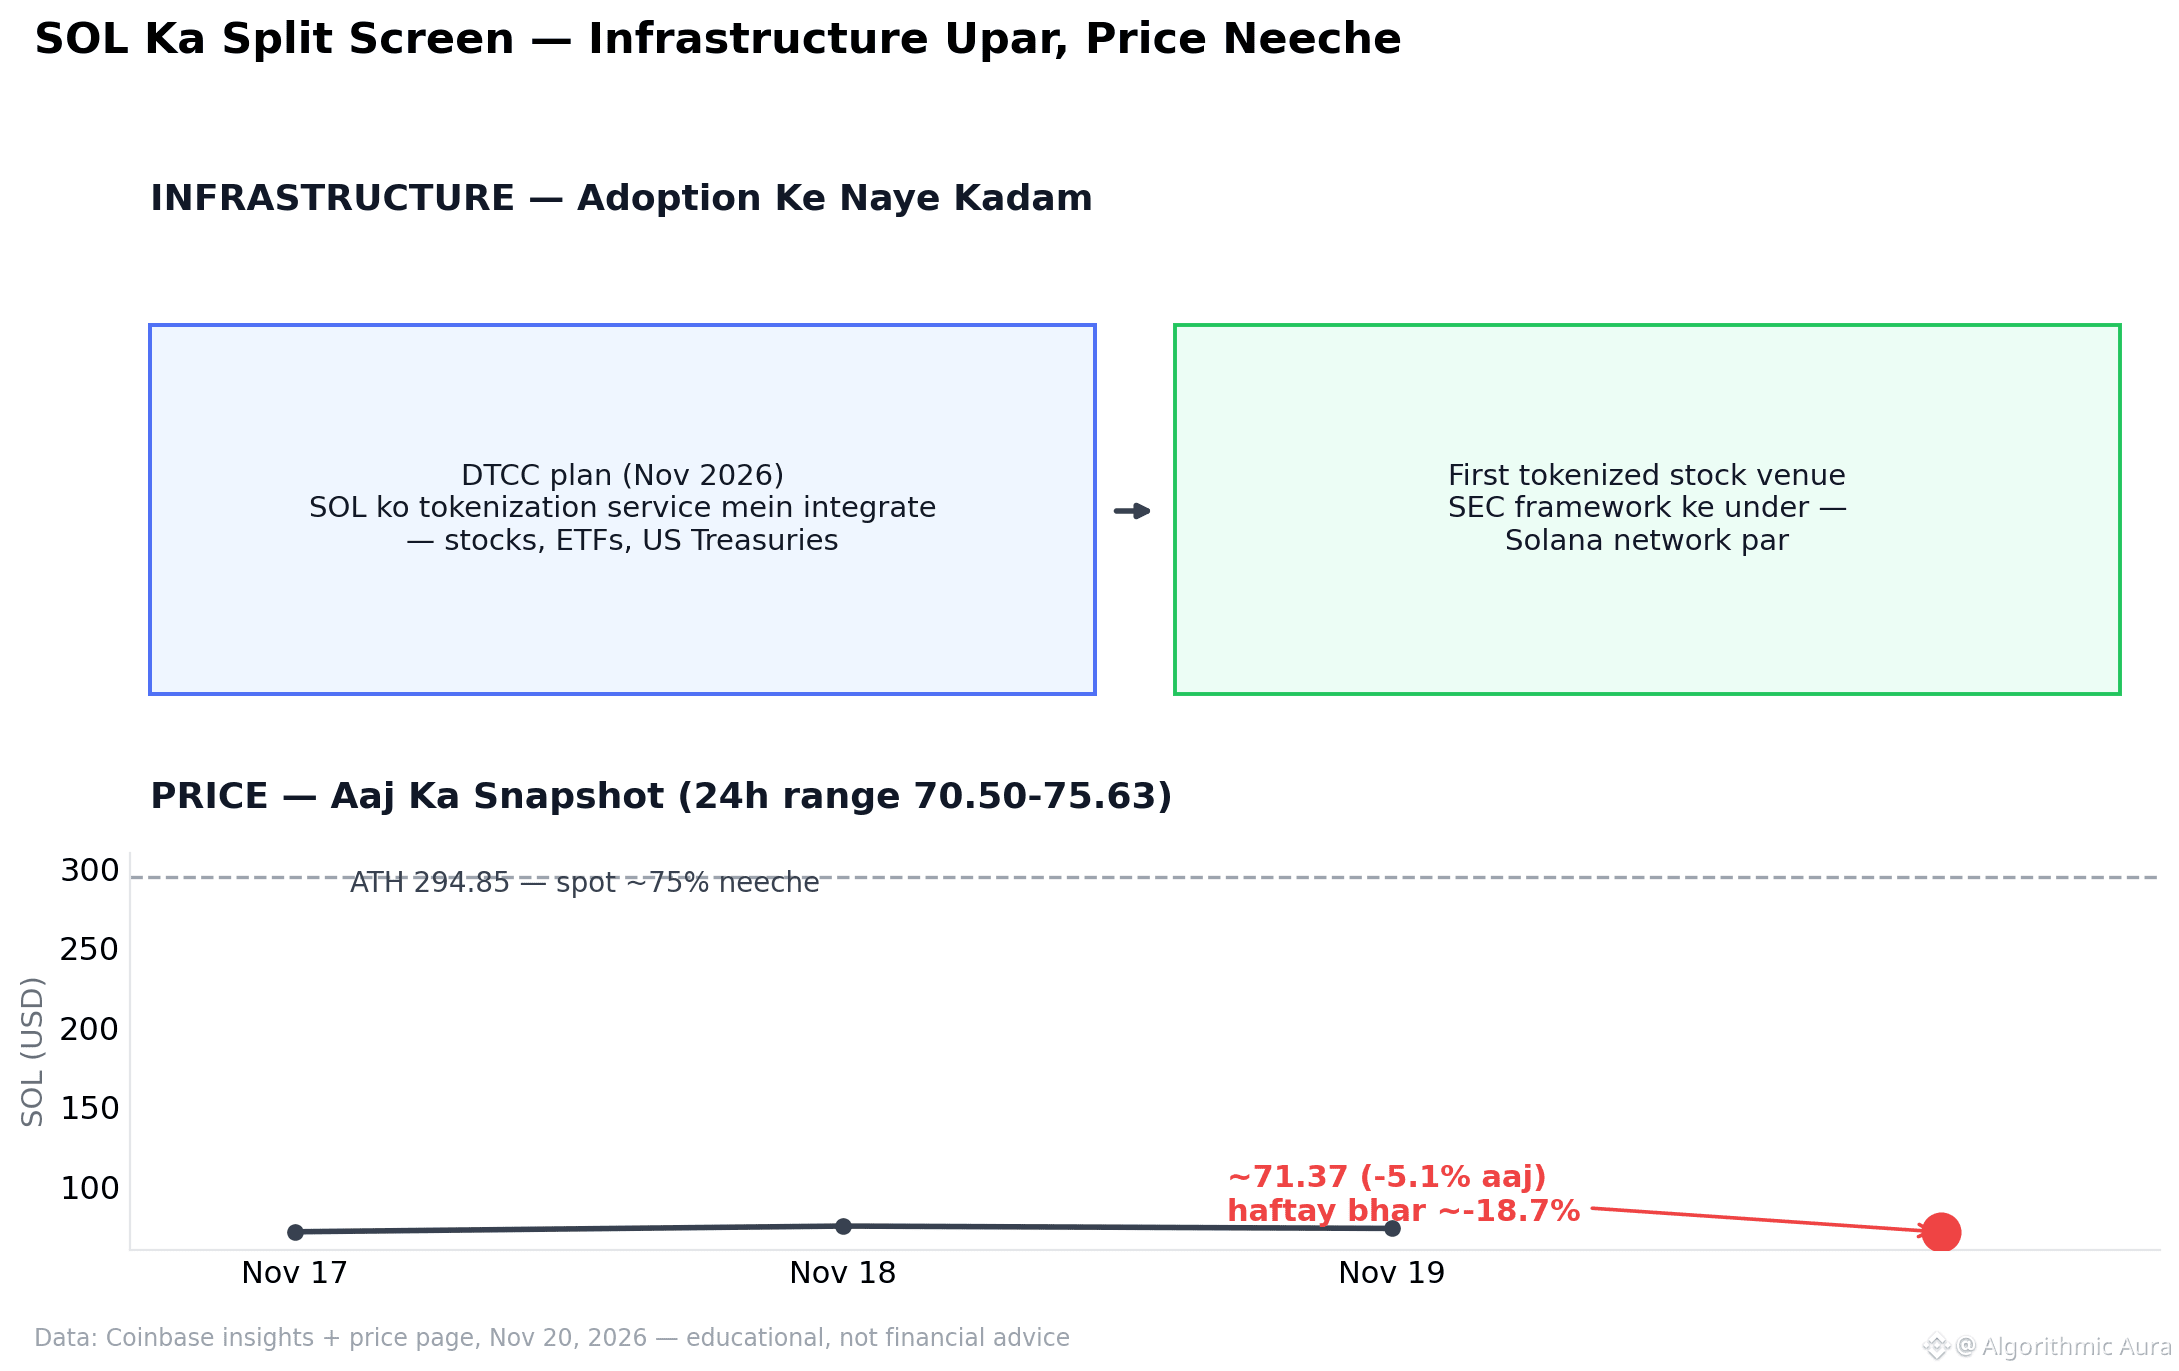
📊 One chart: SOL split-screen — two truths at once.
🟣 1) Above: an infrastructure move — a plan for DTCC tokenization integration, and the first tokenized stock venue under the SEC framework.
📉 2) Below: the price side — today ~71.37 (-5.1%), down ~18.7% over the week, and ~75% below its ATH.
3) 👀 The point isn’t that the two will converge soon — it’s that they’re two separate stories.
Look at both sides of the chart, not just one.
$SOL
#Solana #CryptoCharts #CryptoNews
📊 One chart: SOL split-screen — two truths at once.
🟣 1) Above: an infrastructure move — a plan for DTCC tokenization integration, and the first tokenized stock venue under the SEC framework.
📉 2) Below: the price side — today ~71.37 (-5.1%), down ~18.7% over the week, and ~75% below its ATH.
3) 👀 The point isn’t that the two will converge soon — it’s that they’re two separate stories.
Look at both sides of the chart, not just one.
$SOL
#Solana #CryptoCharts #CryptoNews
🟣 1) Above: an infrastructure move — a plan for DTCC tokenization integration, and the first tokenized stock venue under the SEC framework.
📉 2) Below: the price side — today ~71.37 (-5.1%), down ~18.7% over the week, and ~75% below its ATH.
3) 👀 The point isn’t that the two will converge soon — it’s that they’re two separate stories.
Look at both sides of the chart, not just one.
$SOL
#Solana #CryptoCharts #CryptoNews
8
Log in to explore more content
Join global crypto users on Binance Square
⚡️ Get latest and useful information about crypto.
💬 Trusted by the world’s largest crypto exchange.
👍 Discover real insights from verified creators.
Email / Phone number
Trending Topics
1
#XRPDropsToTwoYearLowNear87Cents
599 views
56 Discussing
2
#BitcoinFallsBelow$57KToTwoYearLow
271 views
14 Discussing
3
#NvidiaLoses$2.7TrillionInMonthAndAHalf
445 views
26 Discussing
4
#CanBTCReboundAfterFallingBelow60K?
501,077 views
2,195 Discussing
5
#GlobalStocksFaceLongestLosingStreakSince2023
173,370 views
1,528 Discussing
6
#BlackRockIBITPostsRecord$541MSingleDayOutflow
9,096 views
49 Discussing
7
#AnthropicPlungesTowardIPOPriceonDay2
83,941 views
880 Discussing
8
#TwentyOneCapitalAdds172.25BTC
34,187 views
402 Discussing
9
#HKBillWouldExcludeTokenizedDepositsFromVirtualAssets
3,098 views
40 Discussing
10
#BNBDropsBelow540USDTWith8.46%DailyDecline
48,964 views
445 Discussing