
#init
init
5.9M views
14,999 Discussing
Hot
Latest

·
--
Bearish
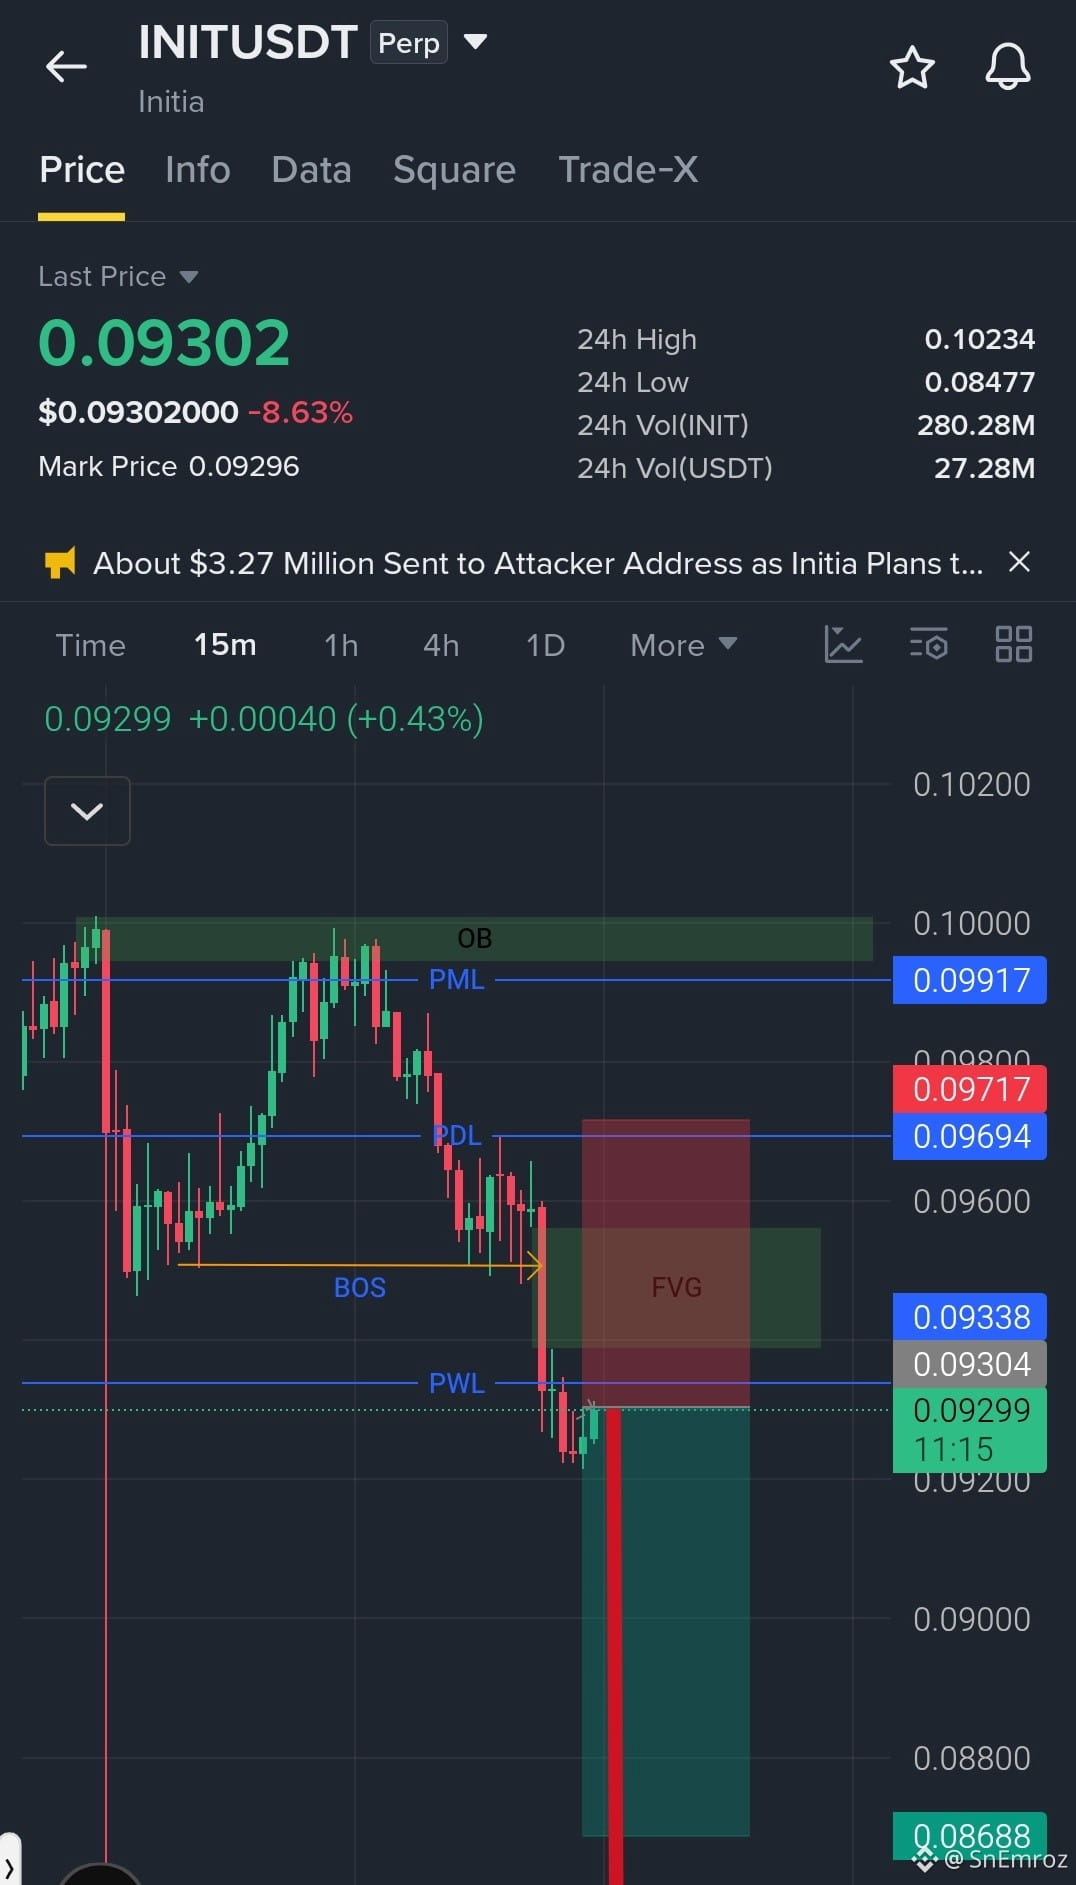
$INIT Short Setup 🔴
🔴 Short Entry: 0.0945–0.0950
{future}(INITUSDT)
✅ Take Profits
TP1 0.09000
TP2 0.08800
TP3 0.08688
❌ Stop Loss: 0.09717
🔶 Bearish BOS + FVG Retest
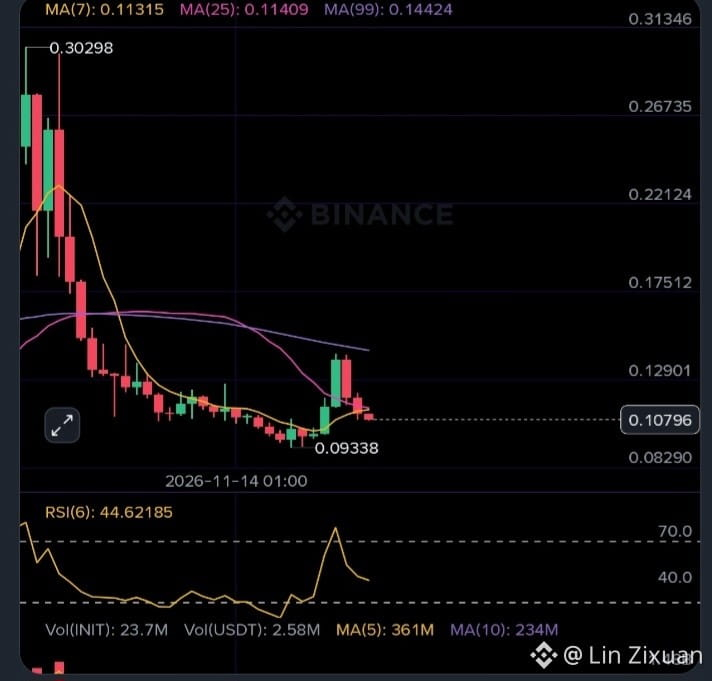
✏️ INIT broke below the previous structure around 0.0950 and continued its decline through the PDL at 0.09694 and PWL at 0.09338. Price is now trading near 0.09302, showing that sellers remain in control. The FVG around 0.0938–0.0955 is the key area to watch for a possible retracement. If price moves back into this gap and sellers defend it, another rejection could push INIT toward 0.0900, followed by 0.0880 and 0.08688. The recent $3.27 million security incident may also be weighing on market sentiment. 💪
#INIT #INITUSDT
$INIT Short Setup 🔴
🔴 Short Entry: 0.0945–0.0950
✅ Take Profits
TP1 0.09000
TP2 0.08800
TP3 0.08688
❌ Stop Loss: 0.09717
🔶 Bearish BOS + FVG Retest
✏️ INIT broke below the previous structure around 0.0950 and continued its decline through the PDL at 0.09694 and PWL at 0.09338. Price is now trading near 0.09302, showing that sellers remain in control. The FVG around 0.0938–0.0955 is the key area to watch for a possible retracement. If price moves back into this gap and sellers defend it, another rejection could push INIT toward 0.0900, followed by 0.0880 and 0.08688. The recent $3.27 million security incident may also be weighing on market sentiment. 💪
#INIT #INITUSDT
🔴 Short Entry: 0.0945–0.0950
✅ Take Profits
TP1 0.09000
TP2 0.08800
TP3 0.08688
❌ Stop Loss: 0.09717
🔶 Bearish BOS + FVG Retest
✏️ INIT broke below the previous structure around 0.0950 and continued its decline through the PDL at 0.09694 and PWL at 0.09338. Price is now trading near 0.09302, showing that sellers remain in control. The FVG around 0.0938–0.0955 is the key area to watch for a possible retracement. If price moves back into this gap and sellers defend it, another rejection could push INIT toward 0.0900, followed by 0.0880 and 0.08688. The recent $3.27 million security incident may also be weighing on market sentiment. 💪
#INIT #INITUSDT
2
927

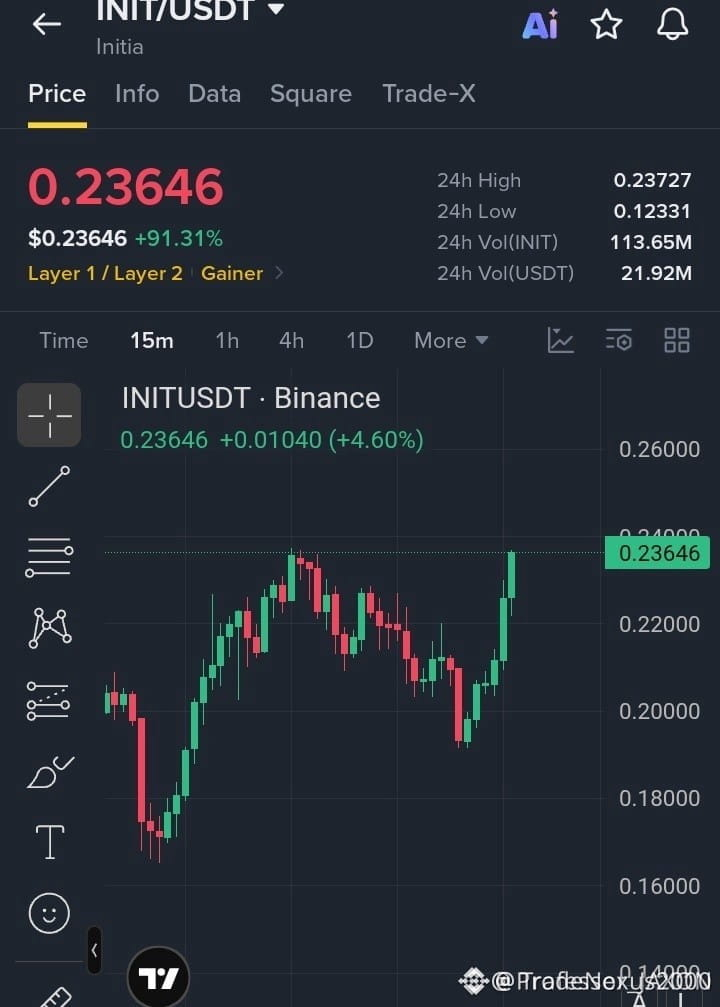
🚨 $INIT IS TESTING MAJOR RESISTANCE AS SMART MONEY BUILDS FOR THE BREAKOUT! ⚡
Entry: 0.22800–0.23300 ⚡
Target: 0.24200, 0.25000, 0.26000 🚀
Stop Loss: 0.22000 ⚠️
Institutional buyers are aggressively absorbing supply as price grinds right up against the 0.23727 structural resistance barrier. 📊 This sustained buying pressure reflects classic order flow accumulation ahead of a major structural expansion. ⚡
A clean breakout and subsequent retest of this immediate zone could unlock accelerated velocity toward higher liquidity pools. 💡 Are you positioning for the initial breakout sweep or waiting for the retest confirmation? 👇
⚠️ Not financial advice. Always manage your risk. 🛡️
🏷️ #INIT #LongSetup #Breakout #Crypto
🔥 💎
🚨 $INIT IS TESTING MAJOR RESISTANCE AS SMART MONEY BUILDS FOR THE BREAKOUT! ⚡
Entry: 0.22800–0.23300 ⚡
Target: 0.24200, 0.25000, 0.26000 🚀
Stop Loss: 0.22000 ⚠️
Institutional buyers are aggressively absorbing supply as price grinds right up against the 0.23727 structural resistance barrier. 📊 This sustained buying pressure reflects classic order flow accumulation ahead of a major structural expansion. ⚡
A clean breakout and subsequent retest of this immediate zone could unlock accelerated velocity toward higher liquidity pools. 💡 Are you positioning for the initial breakout sweep or waiting for the retest confirmation? 👇
⚠️ Not financial advice. Always manage your risk. 🛡️
🏷️ #INIT #LongSetup #Breakout #Crypto
🔥 💎
Entry: 0.22800–0.23300 ⚡
Target: 0.24200, 0.25000, 0.26000 🚀
Stop Loss: 0.22000 ⚠️
Institutional buyers are aggressively absorbing supply as price grinds right up against the 0.23727 structural resistance barrier. 📊 This sustained buying pressure reflects classic order flow accumulation ahead of a major structural expansion. ⚡
A clean breakout and subsequent retest of this immediate zone could unlock accelerated velocity toward higher liquidity pools. 💡 Are you positioning for the initial breakout sweep or waiting for the retest confirmation? 👇
⚠️ Not financial advice. Always manage your risk. 🛡️
🏷️ #INIT #LongSetup #Breakout #Crypto
🔥 💎
8

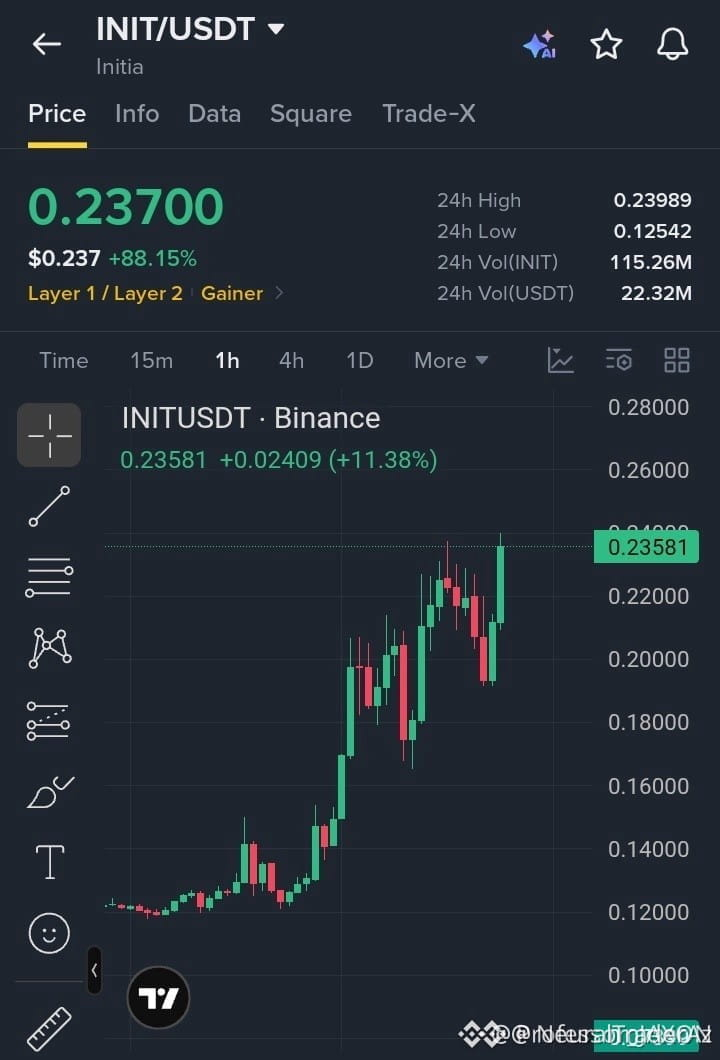
🚨 $INIT APPROACHING A CRITICAL RESISTANCE TEST AFTER A CLEAN ACCUMULATION PHASE! 💥
Entry: 0.22800–0.23500 ⚡
Target: 0.26800 🚀
Stop Loss: 0.21800 ⚠️
Price is compressing tightly beneath the 0.24000 structural overhead, absorbing resting sell-side liquidity with measured efficiency. 📊 This institutional accumulation phase indicates strong sponsorship behind the ongoing bullish market structure. 💡
As long as support holds firm above 0.22000, continuation toward higher objectives remains favored by order flow dynamics. 🌊 Are you positioning for the breakout confirmation or waiting for a deeper retest? 👇
⚠️ Not financial advice. Always manage your risk. 🛡️
🏷️ #INIT #LongSetup #Breakout #Crypto
🔥 💎
🚨 $INIT APPROACHING A CRITICAL RESISTANCE TEST AFTER A CLEAN ACCUMULATION PHASE! 💥
Entry: 0.22800–0.23500 ⚡
Target: 0.26800 🚀
Stop Loss: 0.21800 ⚠️
Price is compressing tightly beneath the 0.24000 structural overhead, absorbing resting sell-side liquidity with measured efficiency. 📊 This institutional accumulation phase indicates strong sponsorship behind the ongoing bullish market structure. 💡
As long as support holds firm above 0.22000, continuation toward higher objectives remains favored by order flow dynamics. 🌊 Are you positioning for the breakout confirmation or waiting for a deeper retest? 👇
⚠️ Not financial advice. Always manage your risk. 🛡️
🏷️ #INIT #LongSetup #Breakout #Crypto
🔥 💎
Entry: 0.22800–0.23500 ⚡
Target: 0.26800 🚀
Stop Loss: 0.21800 ⚠️
Price is compressing tightly beneath the 0.24000 structural overhead, absorbing resting sell-side liquidity with measured efficiency. 📊 This institutional accumulation phase indicates strong sponsorship behind the ongoing bullish market structure. 💡
As long as support holds firm above 0.22000, continuation toward higher objectives remains favored by order flow dynamics. 🌊 Are you positioning for the breakout confirmation or waiting for a deeper retest? 👇
⚠️ Not financial advice. Always manage your risk. 🛡️
🏷️ #INIT #LongSetup #Breakout #Crypto
🔥 💎
10
🦈 $INIT RETAIL PANIC FLUSH IS EXACTLY WHERE SMART MONEY HUNTS LIQUIDITY 📉
Mass liquidations across $INIT and $ETH often look like absolute devastation to emotional market participants. 🌊 Behind the panic selling lies a classic institutional footprint where smart money steps in to absorb supply at deep structural discounts. 🔍
Markets rarely move in straight lines, and terminal fear events frequently mark the completion of a liquidity sweep rather than the end of the trend. 📊 Are you managing your risk correctly while structural players accumulate from distressed sellers? 👇
⚠️ Not financial advice. Always manage your risk. 🛡️
🏷️ #INIT #SmartMoney #LiquiditySweep #Crypto
🔥 🦈
🦈 $INIT RETAIL PANIC FLUSH IS EXACTLY WHERE SMART MONEY HUNTS LIQUIDITY 📉
Mass liquidations across $INIT and $ETH often look like absolute devastation to emotional market participants. 🌊 Behind the panic selling lies a classic institutional footprint where smart money steps in to absorb supply at deep structural discounts. 🔍
Markets rarely move in straight lines, and terminal fear events frequently mark the completion of a liquidity sweep rather than the end of the trend. 📊 Are you managing your risk correctly while structural players accumulate from distressed sellers? 👇
⚠️ Not financial advice. Always manage your risk. 🛡️
🏷️ #INIT #SmartMoney #LiquiditySweep #Crypto
🔥 🦈
Mass liquidations across $INIT and $ETH often look like absolute devastation to emotional market participants. 🌊 Behind the panic selling lies a classic institutional footprint where smart money steps in to absorb supply at deep structural discounts. 🔍
Markets rarely move in straight lines, and terminal fear events frequently mark the completion of a liquidity sweep rather than the end of the trend. 📊 Are you managing your risk correctly while structural players accumulate from distressed sellers? 👇
⚠️ Not financial advice. Always manage your risk. 🛡️
🏷️ #INIT #SmartMoney #LiquiditySweep #Crypto
🔥 🦈
11

·
--
Bearish
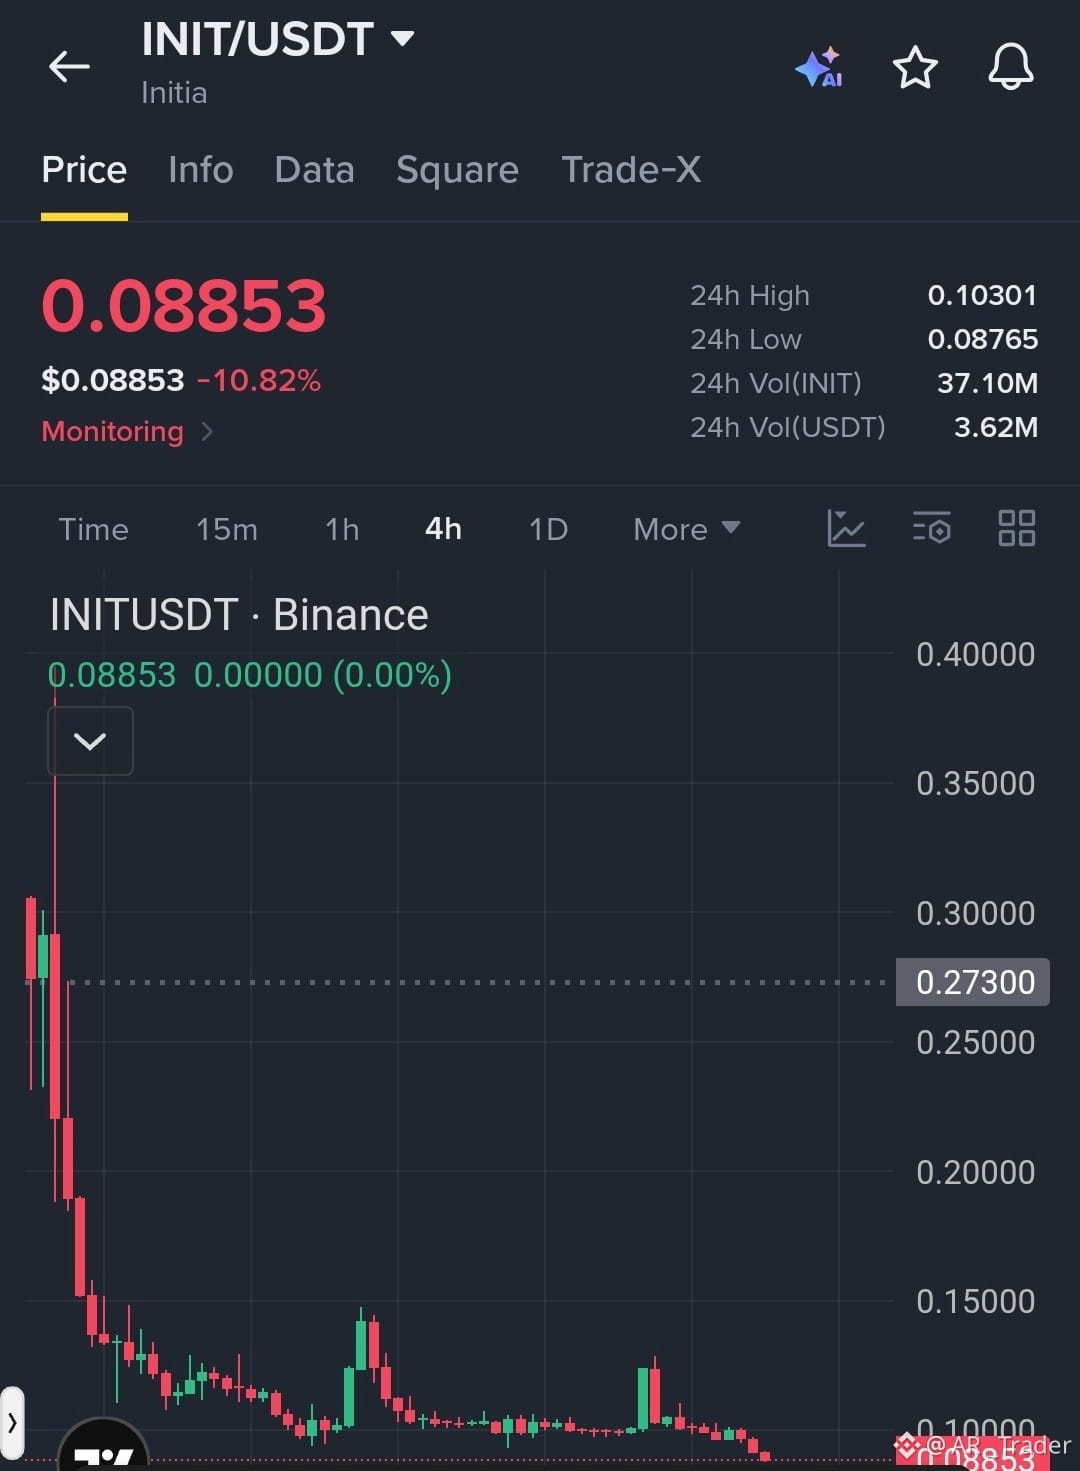
$INIT /USDT Extends Its Bearish Breakdown as Sellers Push Price Toward New Lows
Trade Setup: SHORT
Entry Zone: 0.08850 – 0.09000
TP1: 0.08500
TP2: 0.08100
TP3: 0.07600
SL: 0.09400
#INIT remains under strong selling pressure, with the 4H chart showing a clear sequence of lower highs and lower lows. A sustained break below $0.0875 could trigger another downside move toward lower support levels$INIT
{future}(INITUSDT)
$INJ
{future}(INJUSDT)
.
$INIT /USDT Extends Its Bearish Breakdown as Sellers Push Price Toward New Lows
Trade Setup: SHORT
Entry Zone: 0.08850 – 0.09000
TP1: 0.08500
TP2: 0.08100
TP3: 0.07600
SL: 0.09400
#INIT remains under strong selling pressure, with the 4H chart showing a clear sequence of lower highs and lower lows. A sustained break below $0.0875 could trigger another downside move toward lower support levels$INIT
$INJ
.
Trade Setup: SHORT
Entry Zone: 0.08850 – 0.09000
TP1: 0.08500
TP2: 0.08100
TP3: 0.07600
SL: 0.09400
#INIT remains under strong selling pressure, with the 4H chart showing a clear sequence of lower highs and lower lows. A sustained break below $0.0875 could trigger another downside move toward lower support levels$INIT
$INJ
.
1
48


·
--
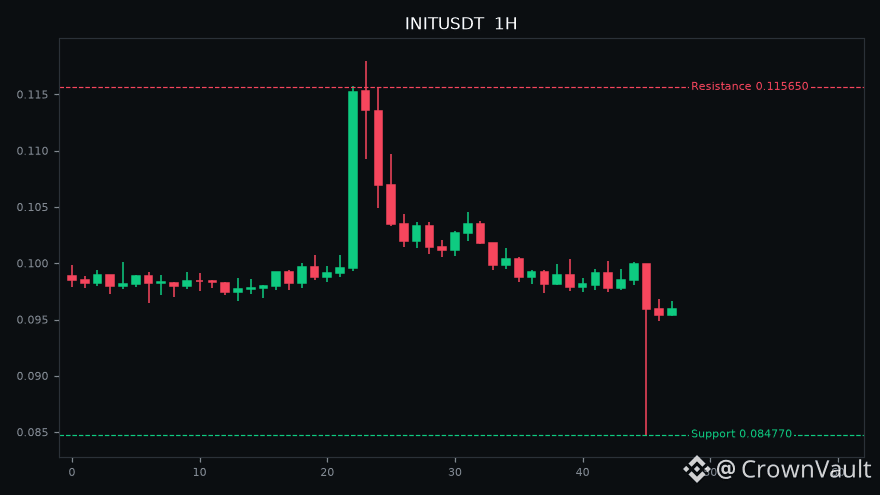
📉 $INIT dumping: -15.3% today
Price: 0.095900
24h High: 0.117980 | 24h Low: 0.084770
24h Volume: $53.6M
Support: 0.084770 | Resistance: 0.115650
RSI 37 (1H)
Falling fast, wait for confirmation before catching it.
#INIT #Crypto #BinanceSquare #Binance
⚠️ Not financial advice. Do your own research.
📉 $INIT dumping: -15.3% today
Price: 0.095900
24h High: 0.117980 | 24h Low: 0.084770
24h Volume: $53.6M
Support: 0.084770 | Resistance: 0.115650
RSI 37 (1H)
Falling fast, wait for confirmation before catching it.
#INIT #Crypto #BinanceSquare #Binance
⚠️ Not financial advice. Do your own research.
Price: 0.095900
24h High: 0.117980 | 24h Low: 0.084770
24h Volume: $53.6M
Support: 0.084770 | Resistance: 0.115650
RSI 37 (1H)
Falling fast, wait for confirmation before catching it.
#INIT #Crypto #BinanceSquare #Binance
⚠️ Not financial advice. Do your own research.
17

·
--
🚨 178 MILLION FLUSHED ON HOT CPI DATA AS $INIT TESTS CRITICAL LIQUIDITY ZONES 📉
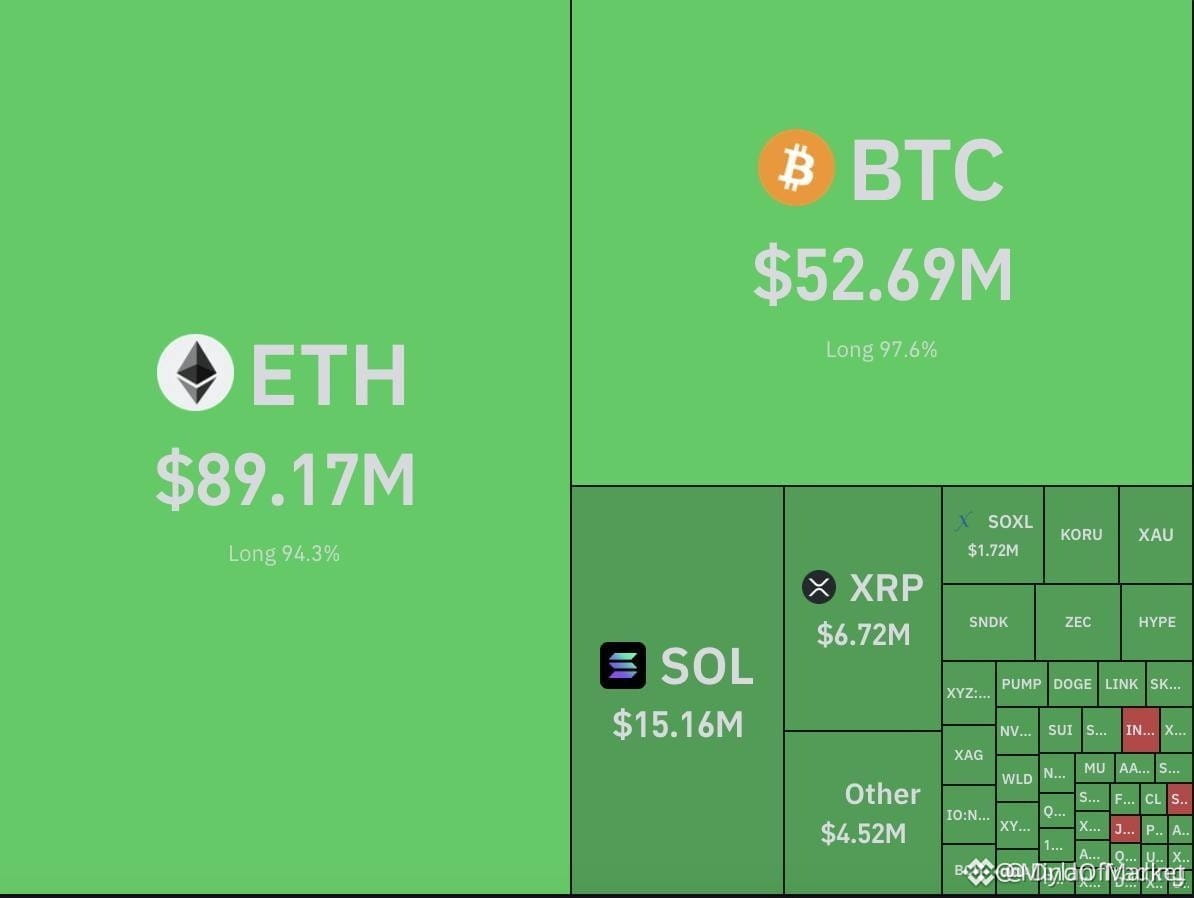
The hotter than expected October CPI print acted as the ultimate liquidity catalyst, sweeping 178 million in overleveraged longs within a single hour 📊. This violent flush purged speculative froth across $INIT and $QI , clearing the order books for a genuine structural retest 🦈.
Institutional algorithms are now monitoring how spot demand absorbs this sudden supply shock before positioning for the next directional expansion ⚡. Are you waiting for a confirmed range reclaim or fading the initial volatility spike 💬?
⚠️ Not financial advice. Always manage your risk. 🛡️
🏷️ #INIT #LiquiditySweep #MarketStructure #Crypto
🔥 🦈
🚨 178 MILLION FLUSHED ON HOT CPI DATA AS $INIT TESTS CRITICAL LIQUIDITY ZONES 📉
The hotter than expected October CPI print acted as the ultimate liquidity catalyst, sweeping 178 million in overleveraged longs within a single hour 📊. This violent flush purged speculative froth across $INIT and $QI , clearing the order books for a genuine structural retest 🦈.
Institutional algorithms are now monitoring how spot demand absorbs this sudden supply shock before positioning for the next directional expansion ⚡. Are you waiting for a confirmed range reclaim or fading the initial volatility spike 💬?
⚠️ Not financial advice. Always manage your risk. 🛡️
🏷️ #INIT #LiquiditySweep #MarketStructure #Crypto
🔥 🦈
The hotter than expected October CPI print acted as the ultimate liquidity catalyst, sweeping 178 million in overleveraged longs within a single hour 📊. This violent flush purged speculative froth across $INIT and $QI , clearing the order books for a genuine structural retest 🦈.
Institutional algorithms are now monitoring how spot demand absorbs this sudden supply shock before positioning for the next directional expansion ⚡. Are you waiting for a confirmed range reclaim or fading the initial volatility spike 💬?
⚠️ Not financial advice. Always manage your risk. 🛡️
🏷️ #INIT #LiquiditySweep #MarketStructure #Crypto
🔥 🦈

19
🦈 $INIT DEFENDING KEY SUPPORT WITH IMPULSIVE SMART MONEY ACCUMULATION! ⚡
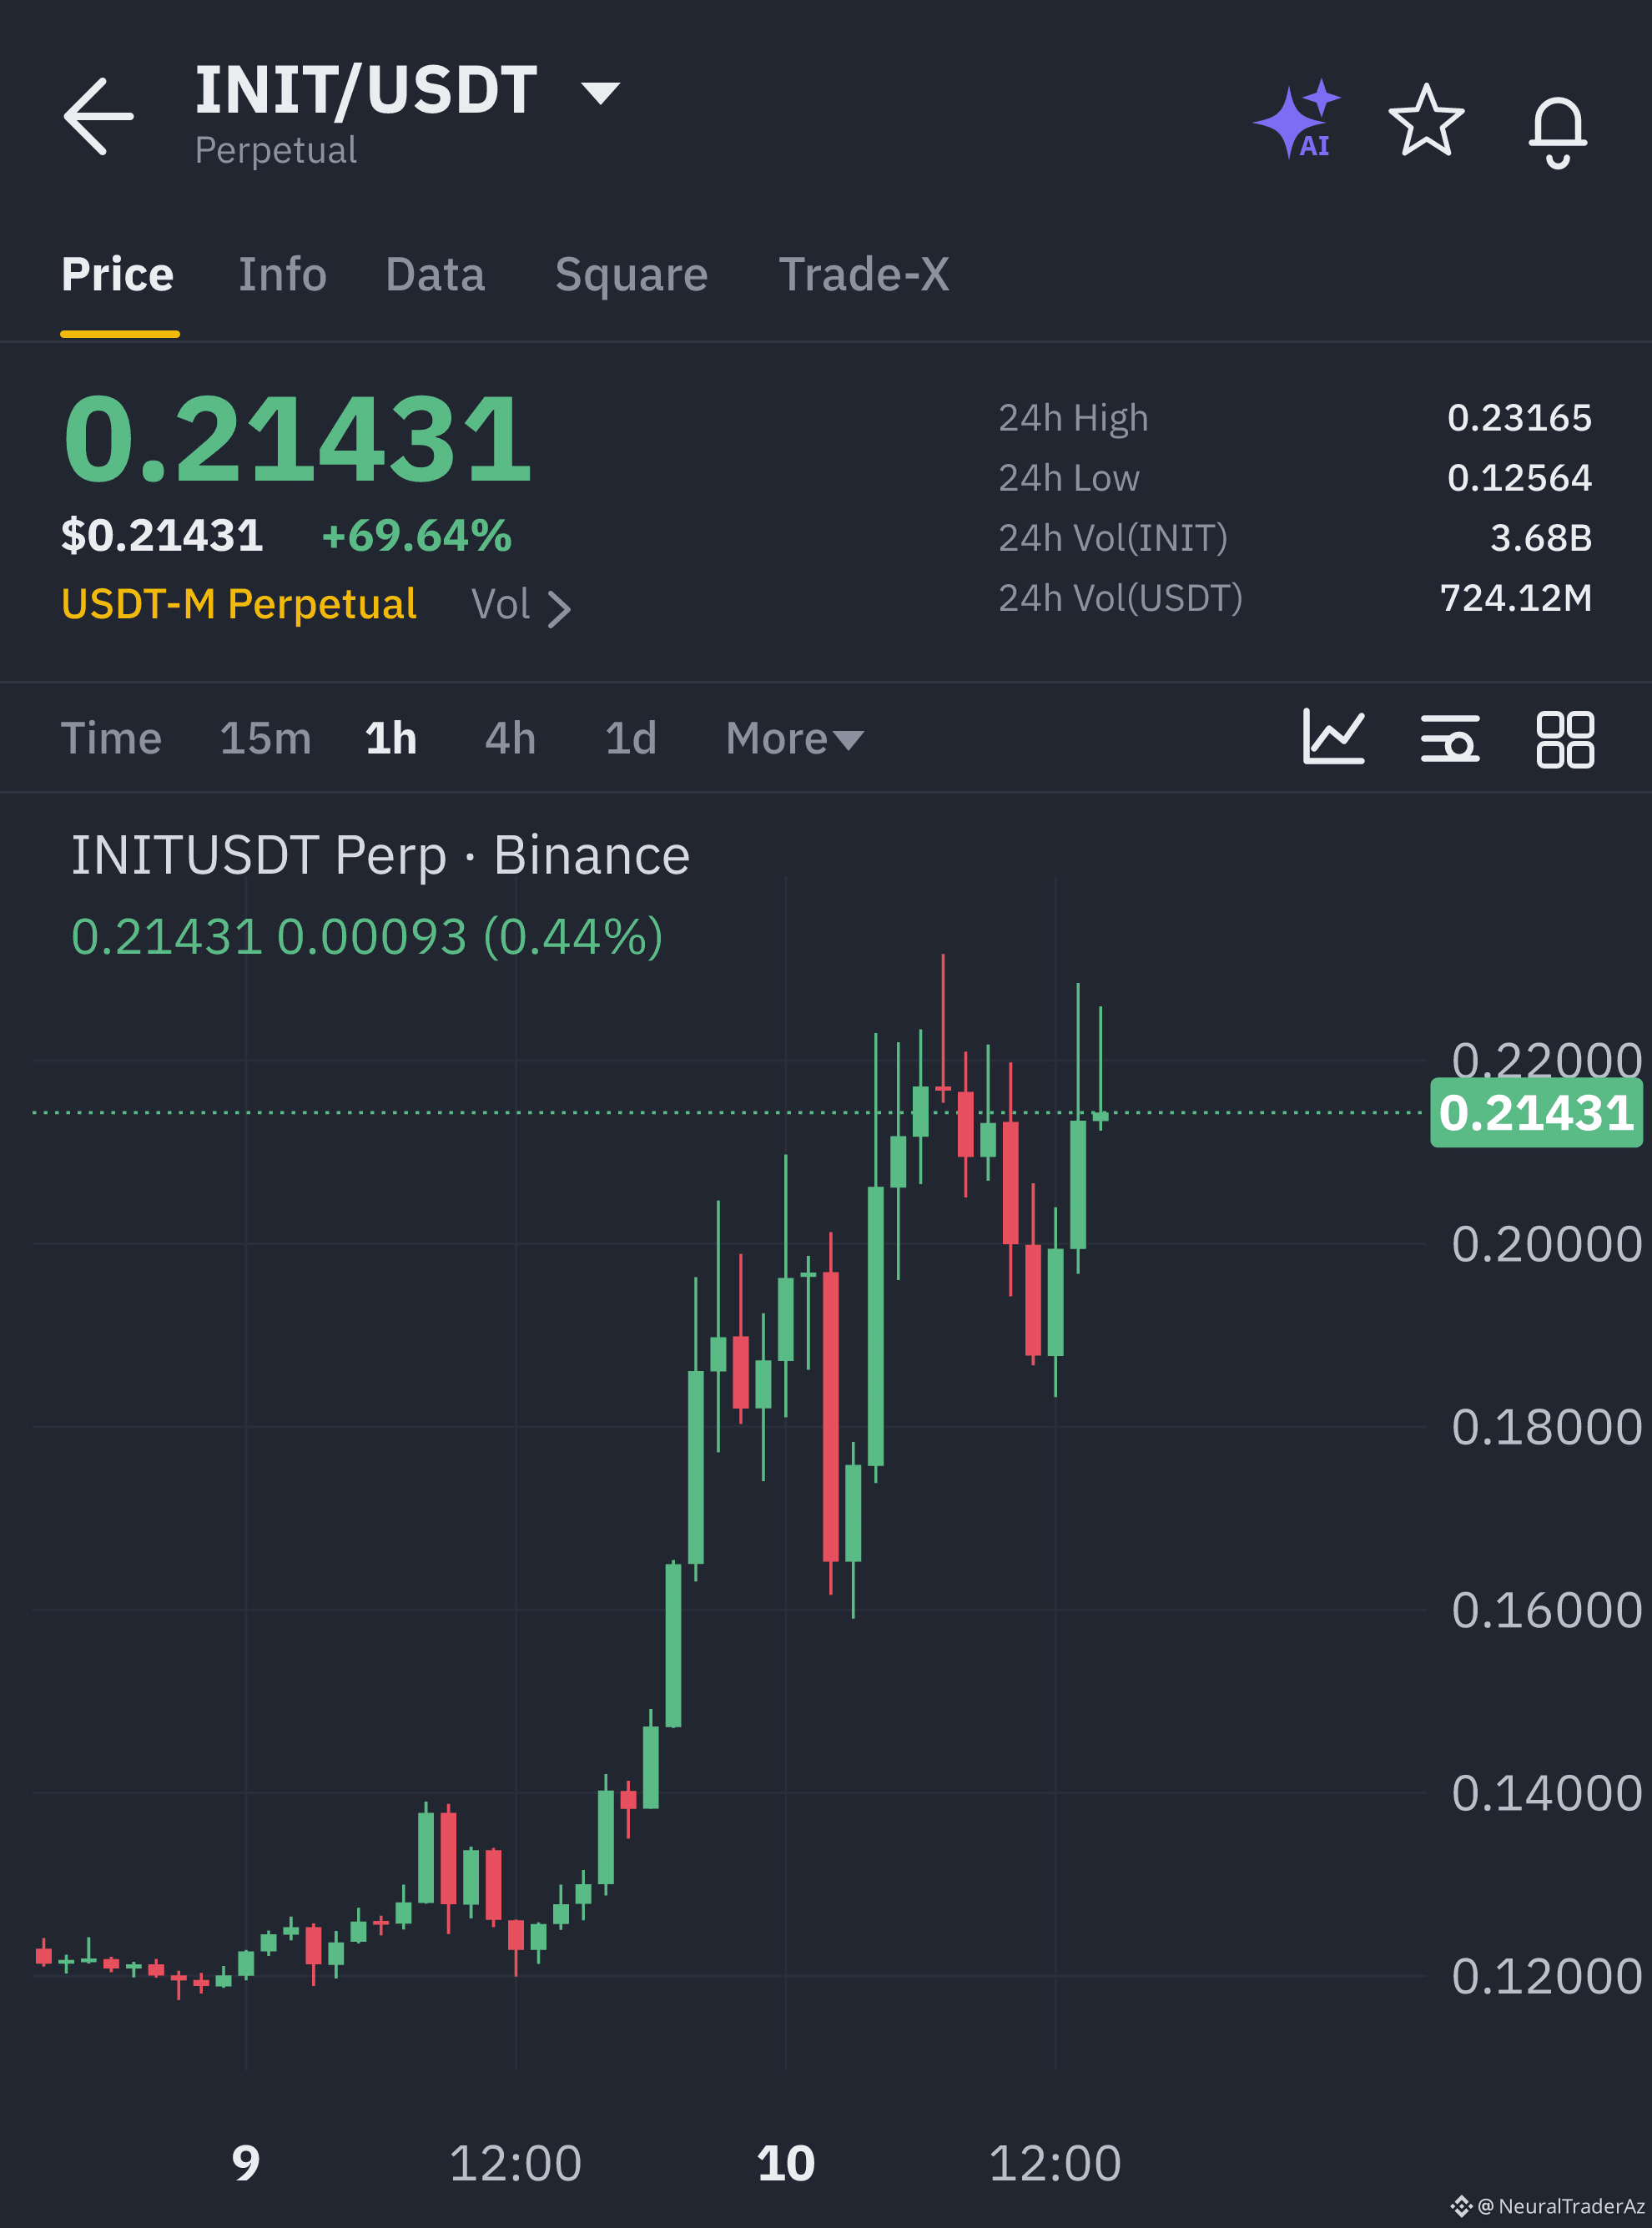
Entry: 0.208690–0.220190 ⚡
Target: 0.237441, 0.269642, 0.297243 🚀
Stop Loss: 0.168439 ⚠️
Smart money has stepped in firmly at the 0.147080 demand block, printing consecutive bullish expansion candles that completely invalidate prior structural weakness. 📊
Price is currently carving a clean reaccumulation range before pressing toward the 0.231650 institutional pivot where order flow expansion accelerates rapidly. ⚡
Risk-to-reward sits at a clean 1:1.8 profile while momentum builds across key order blocks. 💡 Are you positioning ahead of the breakout or waiting for a confirmation sweep? 👇
⚠️ Not financial advice. Always manage your risk. 🛡️
🏷️ #INIT #SmartMoney #Crypto #Breakout
🔥 💎
🦈 $INIT DEFENDING KEY SUPPORT WITH IMPULSIVE SMART MONEY ACCUMULATION! ⚡
Entry: 0.208690–0.220190 ⚡
Target: 0.237441, 0.269642, 0.297243 🚀
Stop Loss: 0.168439 ⚠️
Smart money has stepped in firmly at the 0.147080 demand block, printing consecutive bullish expansion candles that completely invalidate prior structural weakness. 📊
Price is currently carving a clean reaccumulation range before pressing toward the 0.231650 institutional pivot where order flow expansion accelerates rapidly. ⚡
Risk-to-reward sits at a clean 1:1.8 profile while momentum builds across key order blocks. 💡 Are you positioning ahead of the breakout or waiting for a confirmation sweep? 👇
⚠️ Not financial advice. Always manage your risk. 🛡️
🏷️ #INIT #SmartMoney #Crypto #Breakout
🔥 💎
Entry: 0.208690–0.220190 ⚡
Target: 0.237441, 0.269642, 0.297243 🚀
Stop Loss: 0.168439 ⚠️
Smart money has stepped in firmly at the 0.147080 demand block, printing consecutive bullish expansion candles that completely invalidate prior structural weakness. 📊
Price is currently carving a clean reaccumulation range before pressing toward the 0.231650 institutional pivot where order flow expansion accelerates rapidly. ⚡
Risk-to-reward sits at a clean 1:1.8 profile while momentum builds across key order blocks. 💡 Are you positioning ahead of the breakout or waiting for a confirmation sweep? 👇
⚠️ Not financial advice. Always manage your risk. 🛡️
🏷️ #INIT #SmartMoney #Crypto #Breakout
🔥 💎
9
🚨 CAN $INIT SWEEP LIQUIDITY AND UNLOCK THE 1.00 EXPANSION TARGET? ⚡
Target: $1 🚀
Institutional order flow on $INIT shows aggressive accumulation phases resting right below current range boundaries. 📊 Smart money is positioning for an expansion leg as market structure shifts from consolidation to trend continuation. ⚡
The path toward higher liquidity pools remains wide open once structural resistance yields to sustained volume. 💡 What is your primary allocation strategy if this asset prints a clean retest of the psychological 1.00 threshold? 👇
⚠️ Not financial advice. Always manage your risk. 🛡️
🏷️ #INIT #SmartMoney #MarketStructure #CryptoAnalysis
🔥 💎
🚨 CAN $INIT SWEEP LIQUIDITY AND UNLOCK THE 1.00 EXPANSION TARGET? ⚡
Target: $1 🚀
Institutional order flow on $INIT shows aggressive accumulation phases resting right below current range boundaries. 📊 Smart money is positioning for an expansion leg as market structure shifts from consolidation to trend continuation. ⚡
The path toward higher liquidity pools remains wide open once structural resistance yields to sustained volume. 💡 What is your primary allocation strategy if this asset prints a clean retest of the psychological 1.00 threshold? 👇
⚠️ Not financial advice. Always manage your risk. 🛡️
🏷️ #INIT #SmartMoney #MarketStructure #CryptoAnalysis
🔥 💎
Target: $1 🚀
Institutional order flow on $INIT shows aggressive accumulation phases resting right below current range boundaries. 📊 Smart money is positioning for an expansion leg as market structure shifts from consolidation to trend continuation. ⚡
The path toward higher liquidity pools remains wide open once structural resistance yields to sustained volume. 💡 What is your primary allocation strategy if this asset prints a clean retest of the psychological 1.00 threshold? 👇
⚠️ Not financial advice. Always manage your risk. 🛡️
🏷️ #INIT #SmartMoney #MarketStructure #CryptoAnalysis
🔥 💎

21
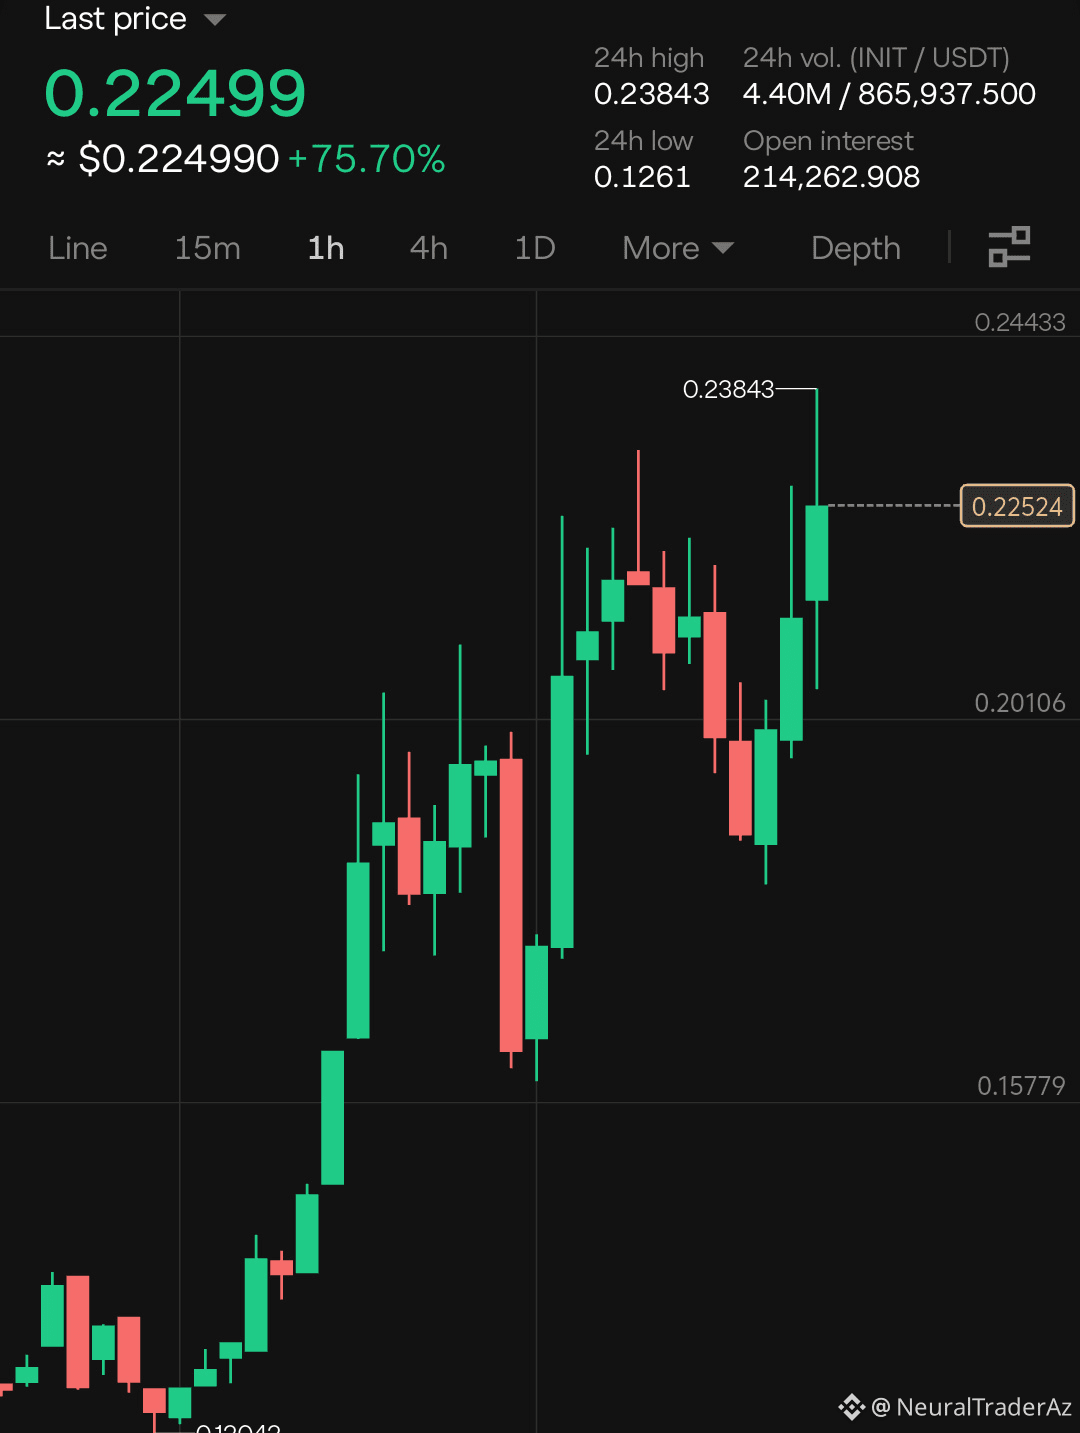
🚨 $INIT IS BREAKING KEY RESISTANCE AFTER CLEARING INITIAL LIQUIDITY POOLS! ⚡
Entry: 0.2313 ⚡
Target: 0.2533 🎯
Target: 0.2700 🚀
Stop Loss: 0.1890 🛑
Smart money sweep of the local range low 🌊 has cleared retail stops, leaving a pristine institutional imbalance waiting to reprice higher. Volume profile data 📊 is expanding across the structural retest, confirming aggressive order flow participation.
The reclaim of this pivot confirms bullish momentum ⚡ as price accelerates toward overhead liquidity pools. Are you positioning ahead of the expansion or waiting for confirmation? 👇
⚠️ Not financial advice. Always manage your risk. 🛡️
🏷️ #INIT #LongSetup #SmartMoney #Breakout #Crypto
🔥 💎
🚨 $INIT IS BREAKING KEY RESISTANCE AFTER CLEARING INITIAL LIQUIDITY POOLS! ⚡
Entry: 0.2313 ⚡
Target: 0.2533 🎯
Target: 0.2700 🚀
Stop Loss: 0.1890 🛑
Smart money sweep of the local range low 🌊 has cleared retail stops, leaving a pristine institutional imbalance waiting to reprice higher. Volume profile data 📊 is expanding across the structural retest, confirming aggressive order flow participation.
The reclaim of this pivot confirms bullish momentum ⚡ as price accelerates toward overhead liquidity pools. Are you positioning ahead of the expansion or waiting for confirmation? 👇
⚠️ Not financial advice. Always manage your risk. 🛡️
🏷️ #INIT #LongSetup #SmartMoney #Breakout #Crypto
🔥 💎
Entry: 0.2313 ⚡
Target: 0.2533 🎯
Target: 0.2700 🚀
Stop Loss: 0.1890 🛑
Smart money sweep of the local range low 🌊 has cleared retail stops, leaving a pristine institutional imbalance waiting to reprice higher. Volume profile data 📊 is expanding across the structural retest, confirming aggressive order flow participation.
The reclaim of this pivot confirms bullish momentum ⚡ as price accelerates toward overhead liquidity pools. Are you positioning ahead of the expansion or waiting for confirmation? 👇
⚠️ Not financial advice. Always manage your risk. 🛡️
🏷️ #INIT #LongSetup #SmartMoney #Breakout #Crypto
🔥 💎
10
·
--
🚨 $INIT VULNERABLE TO A SHARP LIQUIDITY SWEEP TOWARD LOWER RANGES 📉
Target: $0.1500 🚀
Stop Loss: $0.3000 ⚠️
Price action on $INIT reveals aggressive distribution as institutional sellers systematically defend premium liquidity zones and rejection blocks. 📊 Order flow indicators confirm fading buyer participation while heavy structural supply imbalances loom overhead on the lower timeframes. ⚡
This clear market structure breakdown exposes vulnerable resting liquidity down to our primary downside objective. 📌 Are you positioning for this distribution continuation right now or waiting for a localized corrective retest? 👇
⚠️ Not financial advice. Always manage your risk. 🛡️
🏷️ #INIT #ShortSetup #MarketStructure #OrderFlow
🦈 📉
🚨 $INIT VULNERABLE TO A SHARP LIQUIDITY SWEEP TOWARD LOWER RANGES 📉
Target: $0.1500 🚀
Stop Loss: $0.3000 ⚠️
Price action on $INIT reveals aggressive distribution as institutional sellers systematically defend premium liquidity zones and rejection blocks. 📊 Order flow indicators confirm fading buyer participation while heavy structural supply imbalances loom overhead on the lower timeframes. ⚡
This clear market structure breakdown exposes vulnerable resting liquidity down to our primary downside objective. 📌 Are you positioning for this distribution continuation right now or waiting for a localized corrective retest? 👇
⚠️ Not financial advice. Always manage your risk. 🛡️
🏷️ #INIT #ShortSetup #MarketStructure #OrderFlow
🦈 📉
Target: $0.1500 🚀
Stop Loss: $0.3000 ⚠️
Price action on $INIT reveals aggressive distribution as institutional sellers systematically defend premium liquidity zones and rejection blocks. 📊 Order flow indicators confirm fading buyer participation while heavy structural supply imbalances loom overhead on the lower timeframes. ⚡
This clear market structure breakdown exposes vulnerable resting liquidity down to our primary downside objective. 📌 Are you positioning for this distribution continuation right now or waiting for a localized corrective retest? 👇
⚠️ Not financial advice. Always manage your risk. 🛡️
🏷️ #INIT #ShortSetup #MarketStructure #OrderFlow
🦈 📉
6
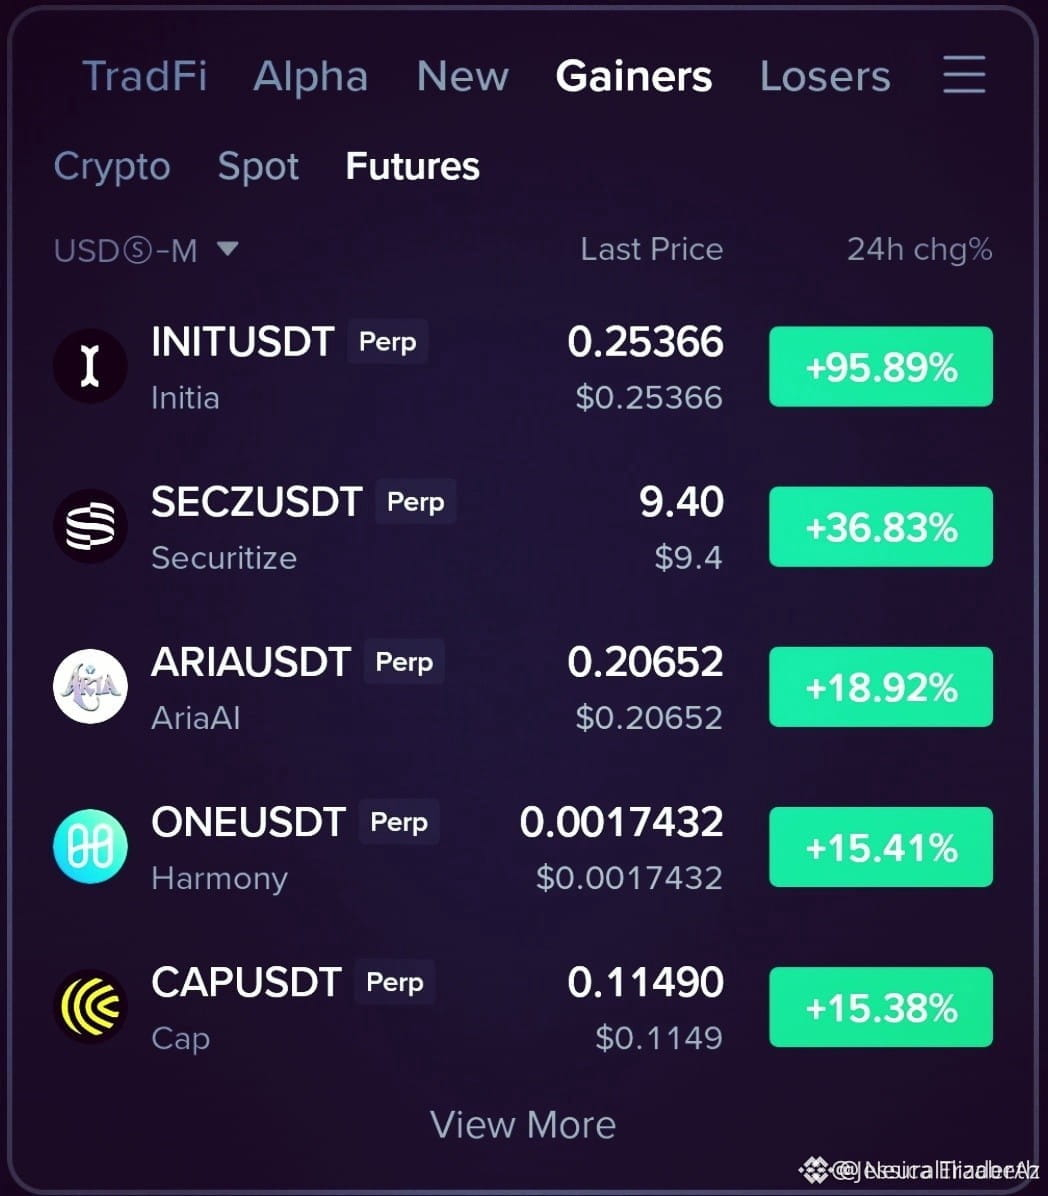
⚡ $INIT , $ARIA , AND $CAP SHOWING AGGRESSIVE INSTITUTIONAL MOMENTUM ACROSS ORDER BOOKS! 🚀
Institutional order flow is rotating heavily into high-beta velocity plays like $INIT , $ARIA , and $CAP as momentum builds on lower timeframe charts. 📊 When aggressive positioning expands alongside a 30x leverage threshold, liquidity sweeps usually precede rapid expansion phases. ⚡
Smart participants are tracking structural breakout confirmations rather than chasing naked candles blindly. 💡 Are you scaling into these momentum nodes proactively or waiting for a macro retest? 🤔
⚠️ Not financial advice. Always manage your risk. 🛡️
🏷️ #INIT #ARIA #CAP #Momentum #Crypto
🔥 💎
⚡ $INIT , $ARIA , AND $CAP SHOWING AGGRESSIVE INSTITUTIONAL MOMENTUM ACROSS ORDER BOOKS! 🚀
Institutional order flow is rotating heavily into high-beta velocity plays like $INIT , $ARIA , and $CAP as momentum builds on lower timeframe charts. 📊 When aggressive positioning expands alongside a 30x leverage threshold, liquidity sweeps usually precede rapid expansion phases. ⚡
Smart participants are tracking structural breakout confirmations rather than chasing naked candles blindly. 💡 Are you scaling into these momentum nodes proactively or waiting for a macro retest? 🤔
⚠️ Not financial advice. Always manage your risk. 🛡️
🏷️ #INIT #ARIA #CAP #Momentum #Crypto
🔥 💎
Institutional order flow is rotating heavily into high-beta velocity plays like $INIT , $ARIA , and $CAP as momentum builds on lower timeframe charts. 📊 When aggressive positioning expands alongside a 30x leverage threshold, liquidity sweeps usually precede rapid expansion phases. ⚡
Smart participants are tracking structural breakout confirmations rather than chasing naked candles blindly. 💡 Are you scaling into these momentum nodes proactively or waiting for a macro retest? 🤔
⚠️ Not financial advice. Always manage your risk. 🛡️
🏷️ #INIT #ARIA #CAP #Momentum #Crypto
🔥 💎
14
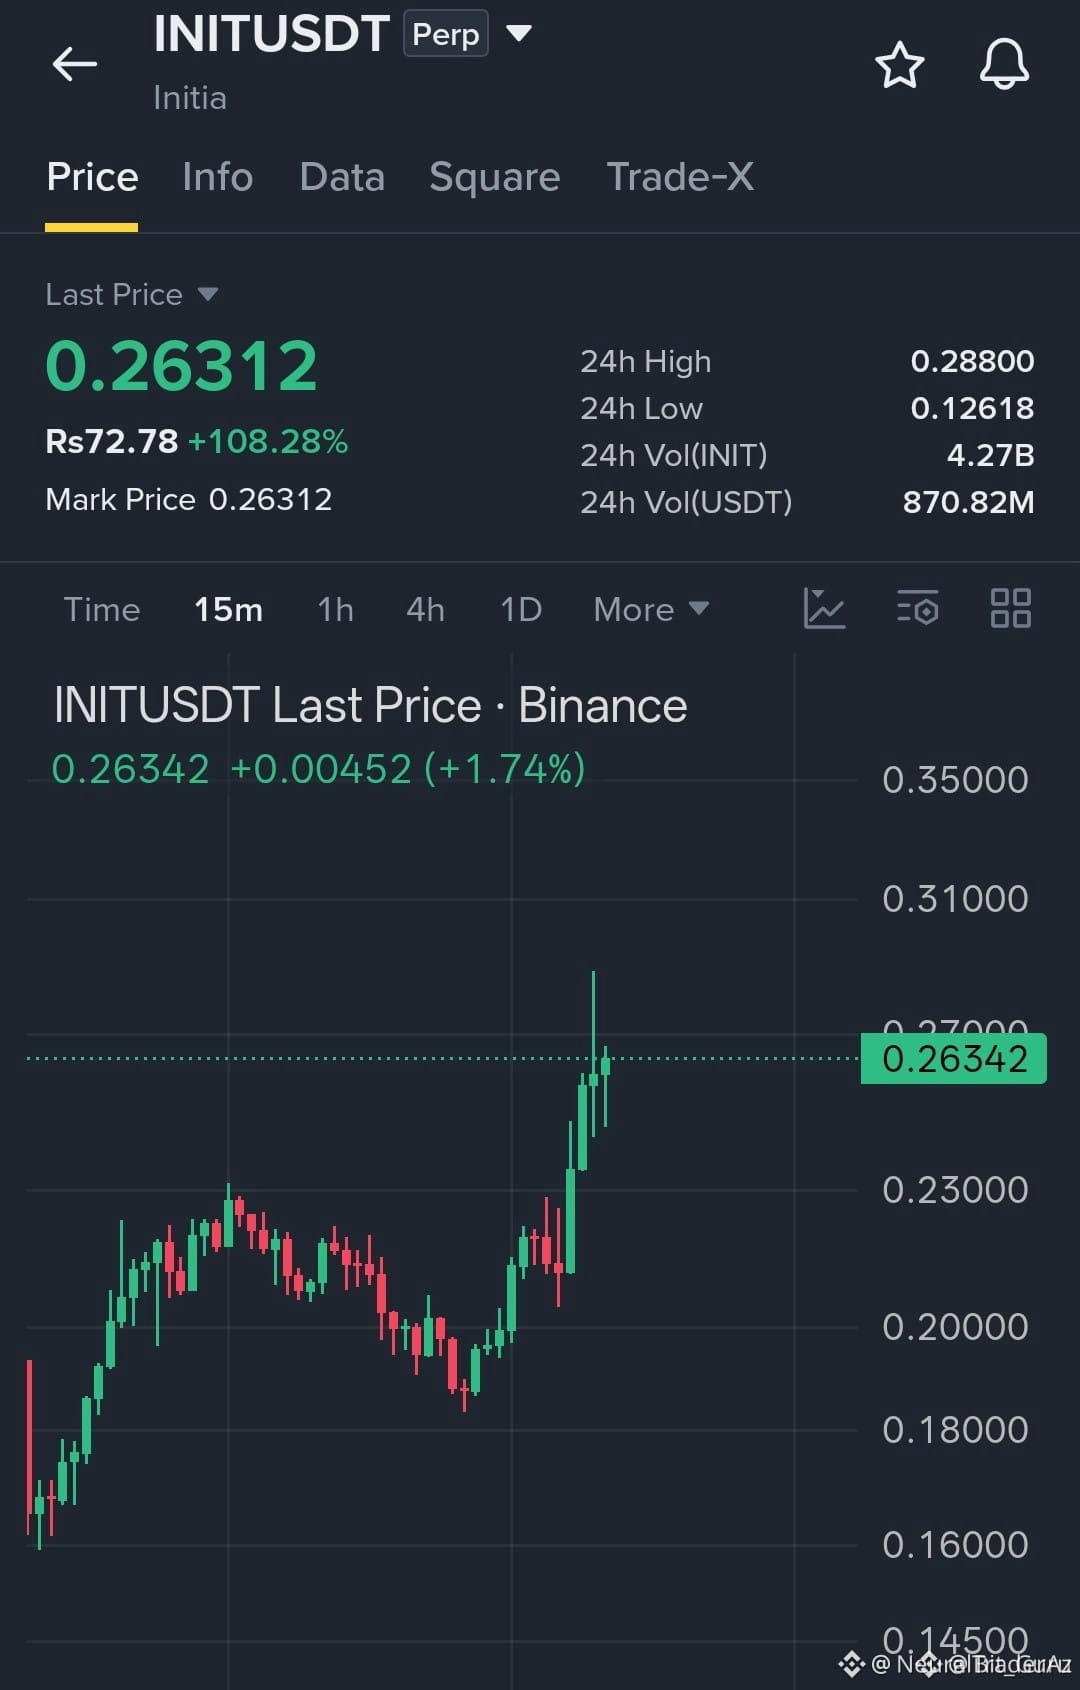
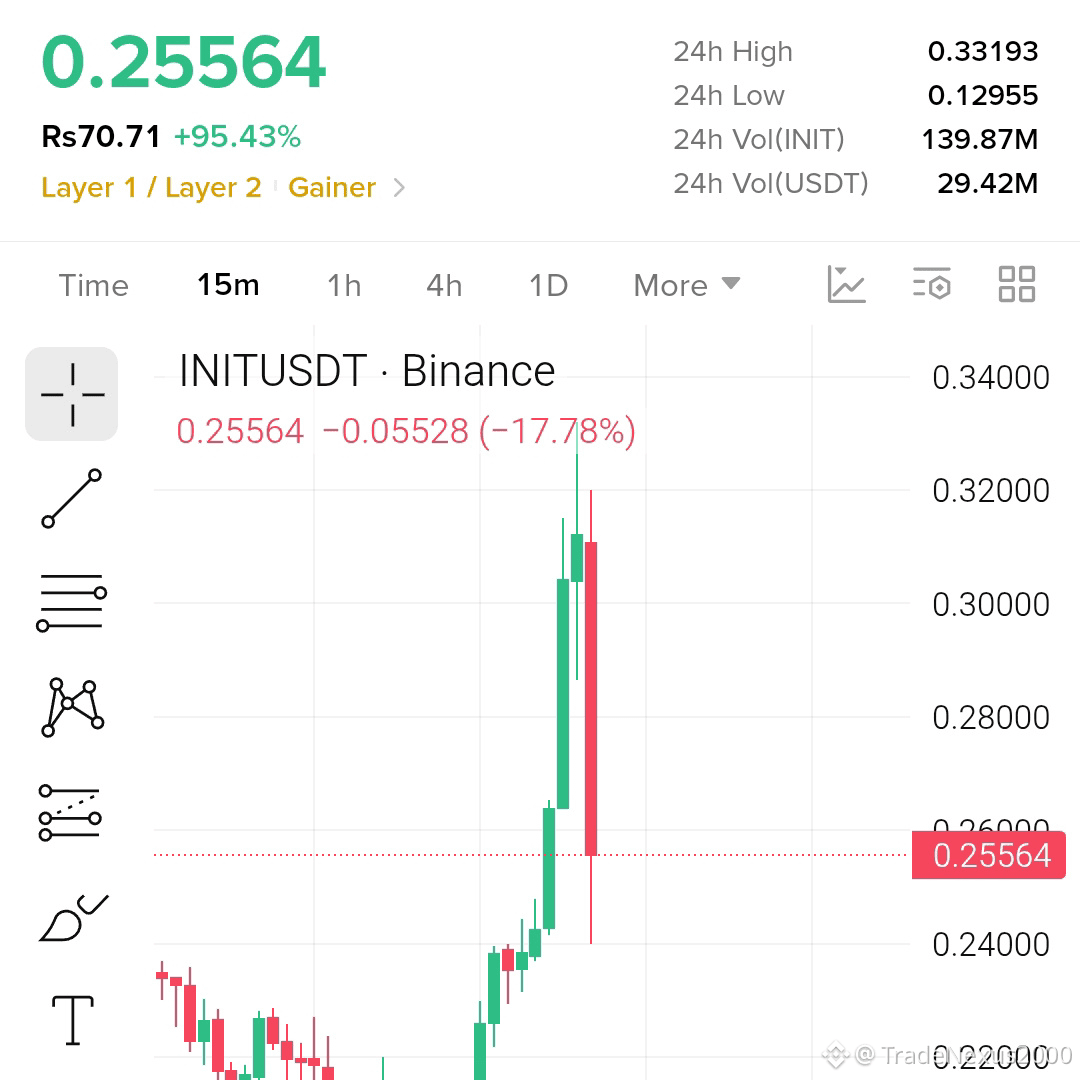
🦈 $INIT PRINTING A MASSIVE 108% SURGE AS SMART MONEY SWEEPS RESISTANCE! ⚡
Entry: $0.255–$0.263 ⚡
Target: $0.300 🚀
Stop Loss: $0.245 ⚠️
The recent 108 percent expansion reflects aggressive institutional accumulation breaking through local structural supply. 📊 Order flow shows strong continuation as buyers absorb residual sell pressure near the highs. ⚡
Price is currently carving out a clean continuation structure above the $0.275 pivot while managing risk tightly below the invalidation level. 💡 Are you waiting for a deeper retest of the demand zone or riding the breakout momentum directly? 🤔
⚠️ Not financial advice. Always manage your risk. 🛡️
🏷️ #INIT #Breakout #Crypto #SmartMoney
🔥 🦈
🦈 $INIT PRINTING A MASSIVE 108% SURGE AS SMART MONEY SWEEPS RESISTANCE! ⚡
Entry: $0.255–$0.263 ⚡
Target: $0.300 🚀
Stop Loss: $0.245 ⚠️
The recent 108 percent expansion reflects aggressive institutional accumulation breaking through local structural supply. 📊 Order flow shows strong continuation as buyers absorb residual sell pressure near the highs. ⚡
Price is currently carving out a clean continuation structure above the $0.275 pivot while managing risk tightly below the invalidation level. 💡 Are you waiting for a deeper retest of the demand zone or riding the breakout momentum directly? 🤔
⚠️ Not financial advice. Always manage your risk. 🛡️
🏷️ #INIT #Breakout #Crypto #SmartMoney
🔥 🦈
Entry: $0.255–$0.263 ⚡
Target: $0.300 🚀
Stop Loss: $0.245 ⚠️
The recent 108 percent expansion reflects aggressive institutional accumulation breaking through local structural supply. 📊 Order flow shows strong continuation as buyers absorb residual sell pressure near the highs. ⚡
Price is currently carving out a clean continuation structure above the $0.275 pivot while managing risk tightly below the invalidation level. 💡 Are you waiting for a deeper retest of the demand zone or riding the breakout momentum directly? 🤔
⚠️ Not financial advice. Always manage your risk. 🛡️
🏷️ #INIT #Breakout #Crypto #SmartMoney
🔥 🦈
12
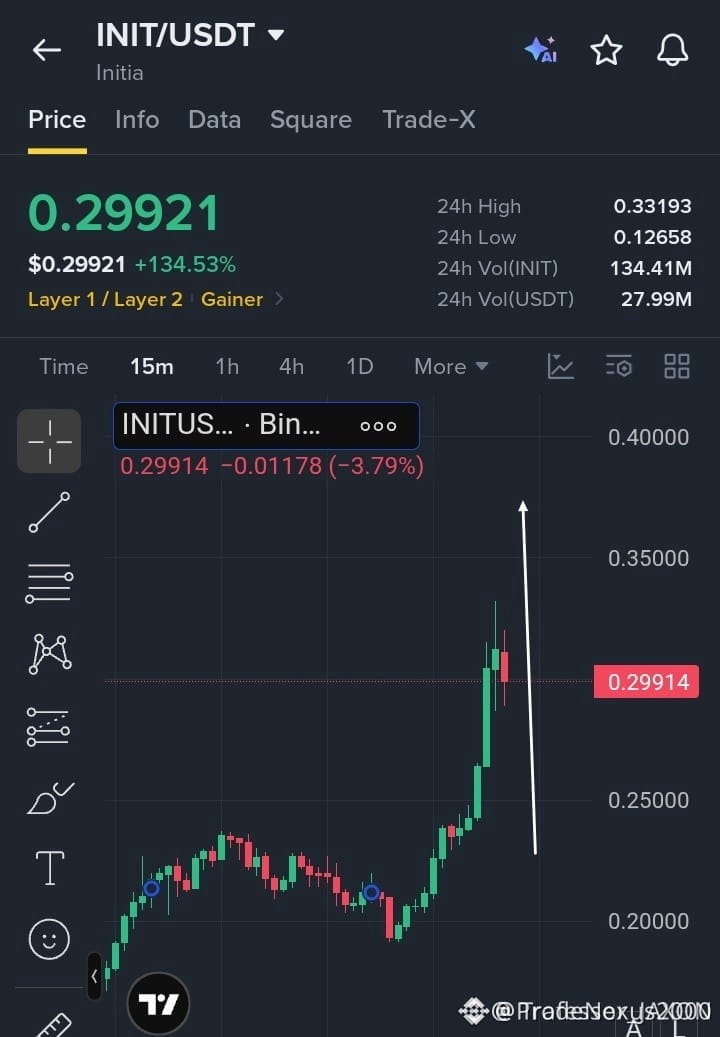
🚨 $INIT BREAKS KEY RESISTANCE AS SMART MONEY PREPARES FOR THE NEXT LEG HIGHER! 🚀
Entry: 0.28800-0.30000 ⚡
Target: 0.31500, 0.33200, 0.35500 🚀
Stop Loss: 0.27600 ⚠️
Institutional order flow has cleanly sliced through previous structural resistance, leaving an unfilled fair value gap just below current prices. 📊 This impulsive volume expansion confirms aggressive buyer commitment across the breakout threshold.
A methodical retest of the demand zone offers an optimal structural entry before continuation toward higher liquidity pools. 💡 Managing risk below the invalidation level keeps the risk-to-reward profile pristine. 💬 Are you positioning for the retest or chasing the momentum breakout here? 👇
⚠️ Not financial advice. Always manage your risk. 🛡️
🏷️ #INIT #Breakout #SmartMoney #Crypto #TradingSetup
🔥 💎
🚨 $INIT BREAKS KEY RESISTANCE AS SMART MONEY PREPARES FOR THE NEXT LEG HIGHER! 🚀
Entry: 0.28800-0.30000 ⚡
Target: 0.31500, 0.33200, 0.35500 🚀
Stop Loss: 0.27600 ⚠️
Institutional order flow has cleanly sliced through previous structural resistance, leaving an unfilled fair value gap just below current prices. 📊 This impulsive volume expansion confirms aggressive buyer commitment across the breakout threshold.
A methodical retest of the demand zone offers an optimal structural entry before continuation toward higher liquidity pools. 💡 Managing risk below the invalidation level keeps the risk-to-reward profile pristine. 💬 Are you positioning for the retest or chasing the momentum breakout here? 👇
⚠️ Not financial advice. Always manage your risk. 🛡️
🏷️ #INIT #Breakout #SmartMoney #Crypto #TradingSetup
🔥 💎
Entry: 0.28800-0.30000 ⚡
Target: 0.31500, 0.33200, 0.35500 🚀
Stop Loss: 0.27600 ⚠️
Institutional order flow has cleanly sliced through previous structural resistance, leaving an unfilled fair value gap just below current prices. 📊 This impulsive volume expansion confirms aggressive buyer commitment across the breakout threshold.
A methodical retest of the demand zone offers an optimal structural entry before continuation toward higher liquidity pools. 💡 Managing risk below the invalidation level keeps the risk-to-reward profile pristine. 💬 Are you positioning for the retest or chasing the momentum breakout here? 👇
⚠️ Not financial advice. Always manage your risk. 🛡️
🏷️ #INIT #Breakout #SmartMoney #Crypto #TradingSetup
🔥 💎
11
🦈 WHAT IS HAPPENING INSIDE THE $INIT ORDER BOOKS RIGHT NOW? ⚡
Price action on $INIT is currently carving out a fascinating structural consolidation right below major historical supply. Smart money is quietly absorbing liquidity while retail sentiment tries to decode the sideways chop. 📊
We are seeing decreasing volume on retracements, a classic signature of institutional accumulation before a volatility expansion. Once this range high breaks, expect a sharp cascade through the resting liquidity pools above. 💡
💬 Are you positioning for the breakout or waiting for a deeper sweep into support? 👇
⚠️ Not financial advice. Always manage your risk. 🛡️
🏷️ #INIT #MarketStructure #SmartMoney #PriceAction
🦈 🌊
🦈 WHAT IS HAPPENING INSIDE THE $INIT ORDER BOOKS RIGHT NOW? ⚡
Price action on $INIT is currently carving out a fascinating structural consolidation right below major historical supply. Smart money is quietly absorbing liquidity while retail sentiment tries to decode the sideways chop. 📊
We are seeing decreasing volume on retracements, a classic signature of institutional accumulation before a volatility expansion. Once this range high breaks, expect a sharp cascade through the resting liquidity pools above. 💡
💬 Are you positioning for the breakout or waiting for a deeper sweep into support? 👇
⚠️ Not financial advice. Always manage your risk. 🛡️
🏷️ #INIT #MarketStructure #SmartMoney #PriceAction
🦈 🌊
Price action on $INIT is currently carving out a fascinating structural consolidation right below major historical supply. Smart money is quietly absorbing liquidity while retail sentiment tries to decode the sideways chop. 📊
We are seeing decreasing volume on retracements, a classic signature of institutional accumulation before a volatility expansion. Once this range high breaks, expect a sharp cascade through the resting liquidity pools above. 💡
💬 Are you positioning for the breakout or waiting for a deeper sweep into support? 👇
⚠️ Not financial advice. Always manage your risk. 🛡️
🏷️ #INIT #MarketStructure #SmartMoney #PriceAction
🦈 🌊
6

·
--
$INIT looks ready to go up from here
It is up 3.4 percent today and holding strong 📈
Buying $INIT between 0.10026 and 0.10256
Invalid below 0.09723
Taking profit at 0.10940 0.11427 0.12156
Trading volume is normal at 8.1M dollars
Price is sitting near the bottom of today range
Sitting inside the zone as I type this
Tap $INIT to buy
Last 7 days of my calls, 38 hit target and 93 hit stop
#INIT #TradingSignals
$INIT looks ready to go up from here
It is up 3.4 percent today and holding strong 📈
Buying $INIT between 0.10026 and 0.10256
Invalid below 0.09723
Taking profit at 0.10940 0.11427 0.12156
Trading volume is normal at 8.1M dollars
Price is sitting near the bottom of today range
Sitting inside the zone as I type this
Tap $INIT to buy
Last 7 days of my calls, 38 hit target and 93 hit stop
#INIT #TradingSignals
It is up 3.4 percent today and holding strong 📈
Buying $INIT between 0.10026 and 0.10256
Invalid below 0.09723
Taking profit at 0.10940 0.11427 0.12156
Trading volume is normal at 8.1M dollars
Price is sitting near the bottom of today range
Sitting inside the zone as I type this
Tap $INIT to buy
Last 7 days of my calls, 38 hit target and 93 hit stop
#INIT #TradingSignals
68

·
--
Bearish
$INIT had its breakout moment… but now the momentum is fading. Is another drop coming?
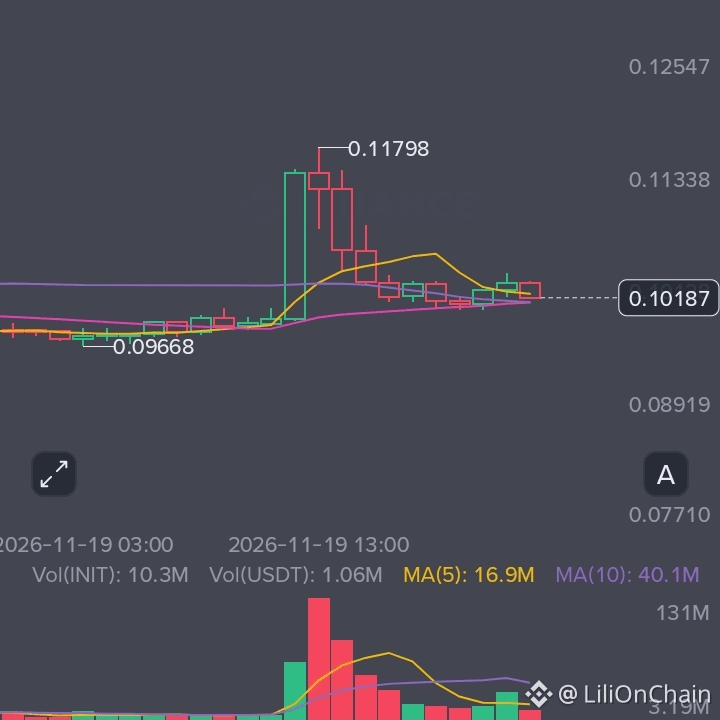
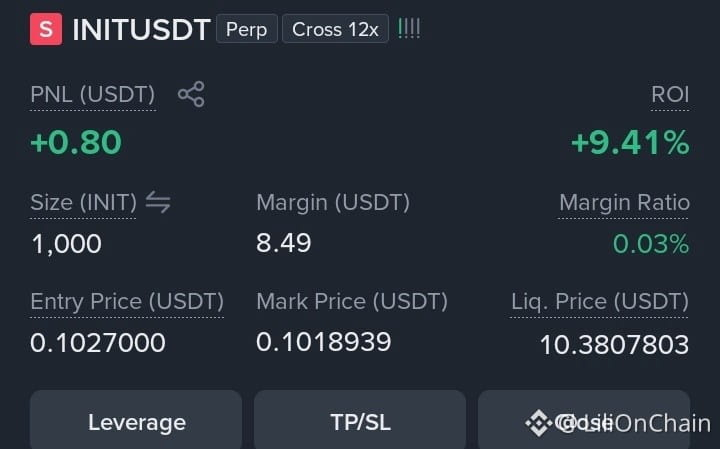
After pumping #INIT faced strong rejection and has given back most of its gains. Price is now hovering around $0.1018, with RSI near 45 and volume cooling down.
🔴 SHORT now thank me later
- Stop Loss: $0.1055
- TP1: $0.0985
- TP2: $0.0967
Support: $0.1000 / $0.0967
Resistance: $0.1035 / $0.1060
Why SHORT?
The rejection from $0.11798, weakening volume and RSI below 50 suggest buyers are losing control. If the current support zone breaks, another downward move could follow. One level I'm watching closely is $0.1000. If sellers break it with volume, $INIT could be heading toward its recent low.
OPEN TRADE 👇🏻
{future}(INITUSDT)
$PIPPIN #trading #lili
$INIT had its breakout moment… but now the momentum is fading. Is another drop coming?
After pumping #INIT faced strong rejection and has given back most of its gains. Price is now hovering around $0.1018, with RSI near 45 and volume cooling down.
🔴 SHORT now thank me later
- Stop Loss: $0.1055
- TP1: $0.0985
- TP2: $0.0967
Support: $0.1000 / $0.0967
Resistance: $0.1035 / $0.1060
Why SHORT?
The rejection from $0.11798, weakening volume and RSI below 50 suggest buyers are losing control. If the current support zone breaks, another downward move could follow. One level I'm watching closely is $0.1000. If sellers break it with volume, $INIT could be heading toward its recent low.
OPEN TRADE 👇🏻
$PIPPIN #trading #lili
After pumping #INIT faced strong rejection and has given back most of its gains. Price is now hovering around $0.1018, with RSI near 45 and volume cooling down.
🔴 SHORT now thank me later
- Stop Loss: $0.1055
- TP1: $0.0985
- TP2: $0.0967
Support: $0.1000 / $0.0967
Resistance: $0.1035 / $0.1060
Why SHORT?
The rejection from $0.11798, weakening volume and RSI below 50 suggest buyers are losing control. If the current support zone breaks, another downward move could follow. One level I'm watching closely is $0.1000. If sellers break it with volume, $INIT could be heading toward its recent low.
OPEN TRADE 👇🏻
$PIPPIN #trading #lili
1
589

·
--
🚨 $INIT FAILING TO RECOVER AS SELLERS CRUSH THE REJECTION ZONE 🔻
Entry: $0.10250–$0.10400 ⚡
Target 1: $0.10000 🎯
Target 2: $0.09800 🎯
Target 3: $0.09550 🚀
Stop Loss: $0.10650 ⚠️
Bulls tried to mount a defense, but the heavy rejection from the $0.125 resistance left buyers completely gassed out. Price action is suffocating under persistent selling pressure with zero signs of a meaningful bid. 📊
A clean breakdown below the psychological $0.100 support level will likely trigger cascading liquidations toward deeper historical liquidity pools. Momentum indicators favor the bears as distribution dominates the order books. ⚡
Are you shorting this breakdown or waiting for a fakeout sweep before entering? 💬
⚠️ Not financial advice. Always manage your risk. 🛡️
🏷️ #INIT #ShortSetup #Bearish #Crypto #OrderFlow
🔴 📉
🚨 $INIT FAILING TO RECOVER AS SELLERS CRUSH THE REJECTION ZONE 🔻
Entry: $0.10250–$0.10400 ⚡
Target 1: $0.10000 🎯
Target 2: $0.09800 🎯
Target 3: $0.09550 🚀
Stop Loss: $0.10650 ⚠️
Bulls tried to mount a defense, but the heavy rejection from the $0.125 resistance left buyers completely gassed out. Price action is suffocating under persistent selling pressure with zero signs of a meaningful bid. 📊
A clean breakdown below the psychological $0.100 support level will likely trigger cascading liquidations toward deeper historical liquidity pools. Momentum indicators favor the bears as distribution dominates the order books. ⚡
Are you shorting this breakdown or waiting for a fakeout sweep before entering? 💬
⚠️ Not financial advice. Always manage your risk. 🛡️
🏷️ #INIT #ShortSetup #Bearish #Crypto #OrderFlow
🔴 📉
Entry: $0.10250–$0.10400 ⚡
Target 1: $0.10000 🎯
Target 2: $0.09800 🎯
Target 3: $0.09550 🚀
Stop Loss: $0.10650 ⚠️
Bulls tried to mount a defense, but the heavy rejection from the $0.125 resistance left buyers completely gassed out. Price action is suffocating under persistent selling pressure with zero signs of a meaningful bid. 📊
A clean breakdown below the psychological $0.100 support level will likely trigger cascading liquidations toward deeper historical liquidity pools. Momentum indicators favor the bears as distribution dominates the order books. ⚡
Are you shorting this breakdown or waiting for a fakeout sweep before entering? 💬
⚠️ Not financial advice. Always manage your risk. 🛡️
🏷️ #INIT #ShortSetup #Bearish #Crypto #OrderFlow
🔴 📉
21

INIT, BMT and YB Market Analysis: High Volatility Creates Three Very Different Token Setups
The latest market action across Initia, Bubblemaps and Yield Basis shows how quickly capital can rotate in the altcoin market. INIT is attempting to stabilize after a sharp multi week correction, BMT is seeing renewed intraday demand with significant volume expansion, and YB has entered a powerful momentum phase that is attracting attention but also carrying elevated volatility risk.
These three assets are moving in different directions, yet each remains sensitive to liquidity, trader positioning and broader crypto sentiment. The current setup is not simply about price gains or losses. It is about whether demand can remain consistent once the immediate volatility settles.
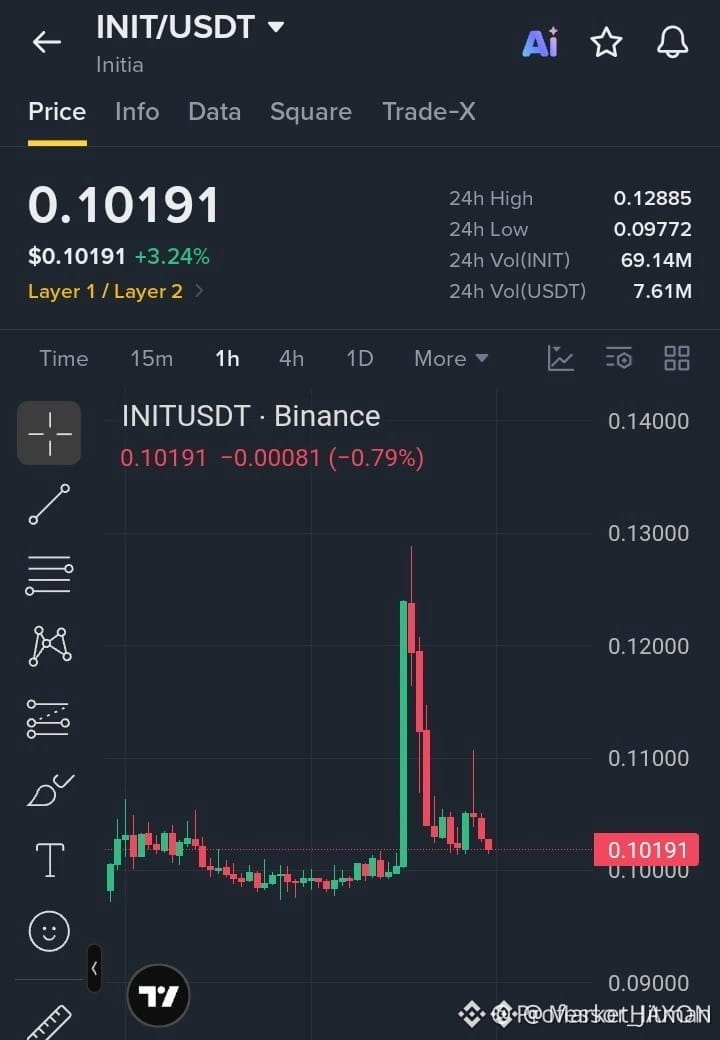
INIT is trading near $0.10261 after reaching an intraday high of $0.12885 and a low of $0.09772. The token is up about 3.39% in the current session, showing that buyers have attempted to defend the lower end of its recent range. However, the broader trend remains under pressure. INIT is down 23.49% over seven days and is trading roughly 74.02% below its 30 day high near $0.395.
The current INIT recovery should therefore be viewed in context. Its RSI has improved to 40.18 from 37.95, indicating that downside momentum has eased, but the reading remains below the neutral midpoint. This suggests that the market is recovering from weakness rather than establishing full bullish control.
INIT is trading slightly below its 7 day moving average of $0.10399 and below its 25 day moving average of $0.14686. The longer term 99 day moving average sits near $0.10221, placing current price close to an important technical area. Its MACD remains bearish following a recent death cross, and the SuperTrend is still pointing downward. This indicates that the broader trend has not yet shifted despite the positive session.
Volume is near its recent average, with a volume ratio of 0.97. That means participation is steady but has not expanded enough to show aggressive follow through. Daily capital flow is negative, with an outflow rate of 11.30%. For INIT, the key question is whether buyers can maintain price stability while capital flow improves. A durable recovery would need stronger participation and a broader change in trend structure.
BMT is trading around $0.02022 after rising about 6.93% in the latest session. The token moved from a low near $0.01856 to a high of $0.02360, showing active demand and a wide daily range. This latest rally follows a weaker short term period, with BMT down 5.60% over seven days. However, it remains up 12.96% over 30 days, making it more resilient than INIT across the wider period.
The most notable BMT signal is volume. Current daily volume is 2.18 times the seven day average, confirming that the price move is supported by unusually strong market activity. This type of expansion can attract momentum traders, but it also increases the potential for rapid reversals if volume fades.
BMT’s RSI has recovered sharply to 43.47 from 30.56. This shows that the market has moved away from a more pressured momentum condition, but the RSI remains below the neutral 50 level. The broader setup is still mixed. BMT is close to its 7 day and 99 day moving averages, but remains below its 25 day average around $0.02329. Its MACD remains bearish, while the SuperTrend continues to point downward.
Capital flow also remains negative, with an outflow rate of 17.73%. This creates an important contrast. Price and volume are rising, but larger net flow is still negative. That can indicate profit taking during the rebound or a market that has not yet developed full conviction. BMT’s next phase will depend on whether demand remains active after the initial surge and whether capital flow becomes more constructive.
YB is the strongest momentum story of the group. The token is trading near $0.0564 after gaining 20.26% in the latest session. It reached a high of $0.0740 and a low of $0.0457, reflecting a dramatic intraday range. YB is up 17.99% over seven days, although it remains down 8.14% over 30 days. This shows that the current rally is strong, but it is still occurring within a wider recovery process.
YB’s daily volume is 5.47 times the seven day average, making it the clearest volume expansion among the three assets. The MACD has formed a fresh golden cross, and the SuperTrend has turned upward. These are supportive short term momentum signals. YB is also trading above its 7 day and 25 day moving averages, which confirms that the latest move has broken above recent trend levels.
However, the rally is becoming stretched. YB’s RSI is 73.62, placing it in overbought territory. Strong volume can allow an overbought market to continue higher, but it also raises the risk of sudden pullbacks as short term participants lock in gains. YB is still below its 99 day moving average near $0.07658, which shows that the longer term trend has not fully recovered.
Another point to monitor is capital flow. Despite the strong price advance, YB is recording net outflow with an outflow rate of 6.79%. This divergence suggests that some holders may be taking profits into strength. It does not invalidate the current momentum, but it makes the next volume and capital flow readings especially important.
The market takeaway is clear. INIT is trying to stabilize but remains in a fragile broader structure. BMT is attracting strong volume during a rebound, although negative capital flow remains a caution signal. YB has the strongest short term momentum, supported by volume and bullish crossover signals, but it is also overbought and vulnerable to sharp volatility.
In fast moving crypto markets, price alone never tells the full story. Volume, capital flow, RSI and trend confirmation are essential for understanding whether momentum is strengthening or becoming exhausted. Market conditions can change quickly, and every participant should independently assess risk before taking action.
#INIT #BMT #YB #CryptoAnalysis #AltcoinMarket
$INIT
{spot}(INITUSDT)
$BMT
{spot}(BMTUSDT)
$YB
{spot}(YBUSDT)
INIT, BMT and YB Market Analysis: High Volatility Creates Three Very Different Token Setups
The latest market action across Initia, Bubblemaps and Yield Basis shows how quickly capital can rotate in the altcoin market. INIT is attempting to stabilize after a sharp multi week correction, BMT is seeing renewed intraday demand with significant volume expansion, and YB has entered a powerful momentum phase that is attracting attention but also carrying elevated volatility risk.
These three assets are moving in different directions, yet each remains sensitive to liquidity, trader positioning and broader crypto sentiment. The current setup is not simply about price gains or losses. It is about whether demand can remain consistent once the immediate volatility settles.
INIT is trading near $0.10261 after reaching an intraday high of $0.12885 and a low of $0.09772. The token is up about 3.39% in the current session, showing that buyers have attempted to defend the lower end of its recent range. However, the broader trend remains under pressure. INIT is down 23.49% over seven days and is trading roughly 74.02% below its 30 day high near $0.395.
The current INIT recovery should therefore be viewed in context. Its RSI has improved to 40.18 from 37.95, indicating that downside momentum has eased, but the reading remains below the neutral midpoint. This suggests that the market is recovering from weakness rather than establishing full bullish control.
INIT is trading slightly below its 7 day moving average of $0.10399 and below its 25 day moving average of $0.14686. The longer term 99 day moving average sits near $0.10221, placing current price close to an important technical area. Its MACD remains bearish following a recent death cross, and the SuperTrend is still pointing downward. This indicates that the broader trend has not yet shifted despite the positive session.
Volume is near its recent average, with a volume ratio of 0.97. That means participation is steady but has not expanded enough to show aggressive follow through. Daily capital flow is negative, with an outflow rate of 11.30%. For INIT, the key question is whether buyers can maintain price stability while capital flow improves. A durable recovery would need stronger participation and a broader change in trend structure.
BMT is trading around $0.02022 after rising about 6.93% in the latest session. The token moved from a low near $0.01856 to a high of $0.02360, showing active demand and a wide daily range. This latest rally follows a weaker short term period, with BMT down 5.60% over seven days. However, it remains up 12.96% over 30 days, making it more resilient than INIT across the wider period.
The most notable BMT signal is volume. Current daily volume is 2.18 times the seven day average, confirming that the price move is supported by unusually strong market activity. This type of expansion can attract momentum traders, but it also increases the potential for rapid reversals if volume fades.
BMT’s RSI has recovered sharply to 43.47 from 30.56. This shows that the market has moved away from a more pressured momentum condition, but the RSI remains below the neutral 50 level. The broader setup is still mixed. BMT is close to its 7 day and 99 day moving averages, but remains below its 25 day average around $0.02329. Its MACD remains bearish, while the SuperTrend continues to point downward.
Capital flow also remains negative, with an outflow rate of 17.73%. This creates an important contrast. Price and volume are rising, but larger net flow is still negative. That can indicate profit taking during the rebound or a market that has not yet developed full conviction. BMT’s next phase will depend on whether demand remains active after the initial surge and whether capital flow becomes more constructive.
YB is the strongest momentum story of the group. The token is trading near $0.0564 after gaining 20.26% in the latest session. It reached a high of $0.0740 and a low of $0.0457, reflecting a dramatic intraday range. YB is up 17.99% over seven days, although it remains down 8.14% over 30 days. This shows that the current rally is strong, but it is still occurring within a wider recovery process.
YB’s daily volume is 5.47 times the seven day average, making it the clearest volume expansion among the three assets. The MACD has formed a fresh golden cross, and the SuperTrend has turned upward. These are supportive short term momentum signals. YB is also trading above its 7 day and 25 day moving averages, which confirms that the latest move has broken above recent trend levels.
However, the rally is becoming stretched. YB’s RSI is 73.62, placing it in overbought territory. Strong volume can allow an overbought market to continue higher, but it also raises the risk of sudden pullbacks as short term participants lock in gains. YB is still below its 99 day moving average near $0.07658, which shows that the longer term trend has not fully recovered.
Another point to monitor is capital flow. Despite the strong price advance, YB is recording net outflow with an outflow rate of 6.79%. This divergence suggests that some holders may be taking profits into strength. It does not invalidate the current momentum, but it makes the next volume and capital flow readings especially important.
The market takeaway is clear. INIT is trying to stabilize but remains in a fragile broader structure. BMT is attracting strong volume during a rebound, although negative capital flow remains a caution signal. YB has the strongest short term momentum, supported by volume and bullish crossover signals, but it is also overbought and vulnerable to sharp volatility.
In fast moving crypto markets, price alone never tells the full story. Volume, capital flow, RSI and trend confirmation are essential for understanding whether momentum is strengthening or becoming exhausted. Market conditions can change quickly, and every participant should independently assess risk before taking action.
#INIT #BMT #YB #CryptoAnalysis #AltcoinMarket
$INIT
$BMT
$YB
These three assets are moving in different directions, yet each remains sensitive to liquidity, trader positioning and broader crypto sentiment. The current setup is not simply about price gains or losses. It is about whether demand can remain consistent once the immediate volatility settles.
INIT is trading near $0.10261 after reaching an intraday high of $0.12885 and a low of $0.09772. The token is up about 3.39% in the current session, showing that buyers have attempted to defend the lower end of its recent range. However, the broader trend remains under pressure. INIT is down 23.49% over seven days and is trading roughly 74.02% below its 30 day high near $0.395.
The current INIT recovery should therefore be viewed in context. Its RSI has improved to 40.18 from 37.95, indicating that downside momentum has eased, but the reading remains below the neutral midpoint. This suggests that the market is recovering from weakness rather than establishing full bullish control.
INIT is trading slightly below its 7 day moving average of $0.10399 and below its 25 day moving average of $0.14686. The longer term 99 day moving average sits near $0.10221, placing current price close to an important technical area. Its MACD remains bearish following a recent death cross, and the SuperTrend is still pointing downward. This indicates that the broader trend has not yet shifted despite the positive session.
Volume is near its recent average, with a volume ratio of 0.97. That means participation is steady but has not expanded enough to show aggressive follow through. Daily capital flow is negative, with an outflow rate of 11.30%. For INIT, the key question is whether buyers can maintain price stability while capital flow improves. A durable recovery would need stronger participation and a broader change in trend structure.
BMT is trading around $0.02022 after rising about 6.93% in the latest session. The token moved from a low near $0.01856 to a high of $0.02360, showing active demand and a wide daily range. This latest rally follows a weaker short term period, with BMT down 5.60% over seven days. However, it remains up 12.96% over 30 days, making it more resilient than INIT across the wider period.
The most notable BMT signal is volume. Current daily volume is 2.18 times the seven day average, confirming that the price move is supported by unusually strong market activity. This type of expansion can attract momentum traders, but it also increases the potential for rapid reversals if volume fades.
BMT’s RSI has recovered sharply to 43.47 from 30.56. This shows that the market has moved away from a more pressured momentum condition, but the RSI remains below the neutral 50 level. The broader setup is still mixed. BMT is close to its 7 day and 99 day moving averages, but remains below its 25 day average around $0.02329. Its MACD remains bearish, while the SuperTrend continues to point downward.
Capital flow also remains negative, with an outflow rate of 17.73%. This creates an important contrast. Price and volume are rising, but larger net flow is still negative. That can indicate profit taking during the rebound or a market that has not yet developed full conviction. BMT’s next phase will depend on whether demand remains active after the initial surge and whether capital flow becomes more constructive.
YB is the strongest momentum story of the group. The token is trading near $0.0564 after gaining 20.26% in the latest session. It reached a high of $0.0740 and a low of $0.0457, reflecting a dramatic intraday range. YB is up 17.99% over seven days, although it remains down 8.14% over 30 days. This shows that the current rally is strong, but it is still occurring within a wider recovery process.
YB’s daily volume is 5.47 times the seven day average, making it the clearest volume expansion among the three assets. The MACD has formed a fresh golden cross, and the SuperTrend has turned upward. These are supportive short term momentum signals. YB is also trading above its 7 day and 25 day moving averages, which confirms that the latest move has broken above recent trend levels.
However, the rally is becoming stretched. YB’s RSI is 73.62, placing it in overbought territory. Strong volume can allow an overbought market to continue higher, but it also raises the risk of sudden pullbacks as short term participants lock in gains. YB is still below its 99 day moving average near $0.07658, which shows that the longer term trend has not fully recovered.
Another point to monitor is capital flow. Despite the strong price advance, YB is recording net outflow with an outflow rate of 6.79%. This divergence suggests that some holders may be taking profits into strength. It does not invalidate the current momentum, but it makes the next volume and capital flow readings especially important.
The market takeaway is clear. INIT is trying to stabilize but remains in a fragile broader structure. BMT is attracting strong volume during a rebound, although negative capital flow remains a caution signal. YB has the strongest short term momentum, supported by volume and bullish crossover signals, but it is also overbought and vulnerable to sharp volatility.
In fast moving crypto markets, price alone never tells the full story. Volume, capital flow, RSI and trend confirmation are essential for understanding whether momentum is strengthening or becoming exhausted. Market conditions can change quickly, and every participant should independently assess risk before taking action.
#INIT #BMT #YB #CryptoAnalysis #AltcoinMarket
$INIT
$BMT
$YB
1
28
Log in to explore more content
Join global crypto users on Binance Square
⚡️ Get latest and useful information about crypto.
💬 Trusted by the world’s largest crypto exchange.
👍 Discover real insights from verified creators.
Email / Phone number
Trending Topics
1
#CanBTCReboundAfterFallingBelow60K?
199,048 views
894 Discussing
2
#GlobalStocksFaceLongestLosingStreakSince2023
69,948 views
720 Discussing
3
#AnthropicPlungesTowardIPOPriceonDay2
29,862 views
349 Discussing
4
#CFTCStaffInvestigatedTrumpMemeCoinThenBackedOff
0 views
22 Discussing
5
#BNBDropsBelow540USDTWith8.46%DailyDecline
10,020 views
101 Discussing
6
#HKBillProposesHK$100KFineForUnauthorizedCryptoTitles
32 views
7 Discussing
7
#BitMineFaces$10.1BUnrealizedETHLoss
165 views
11 Discussing
8
#StrategyReports$35BNetReserves
95 views
10 Discussing
9
#MorganStanleyEndsAnthropicStockSupportAfterOneDay
2,569 views
69 Discussing
10
#CryptoBilisAttackerMoves25000ETHToTornadoCash
7,700 views
61 Discussing