
#intc
intc
360,142 views
2,671 Discussing
Hot
Latest

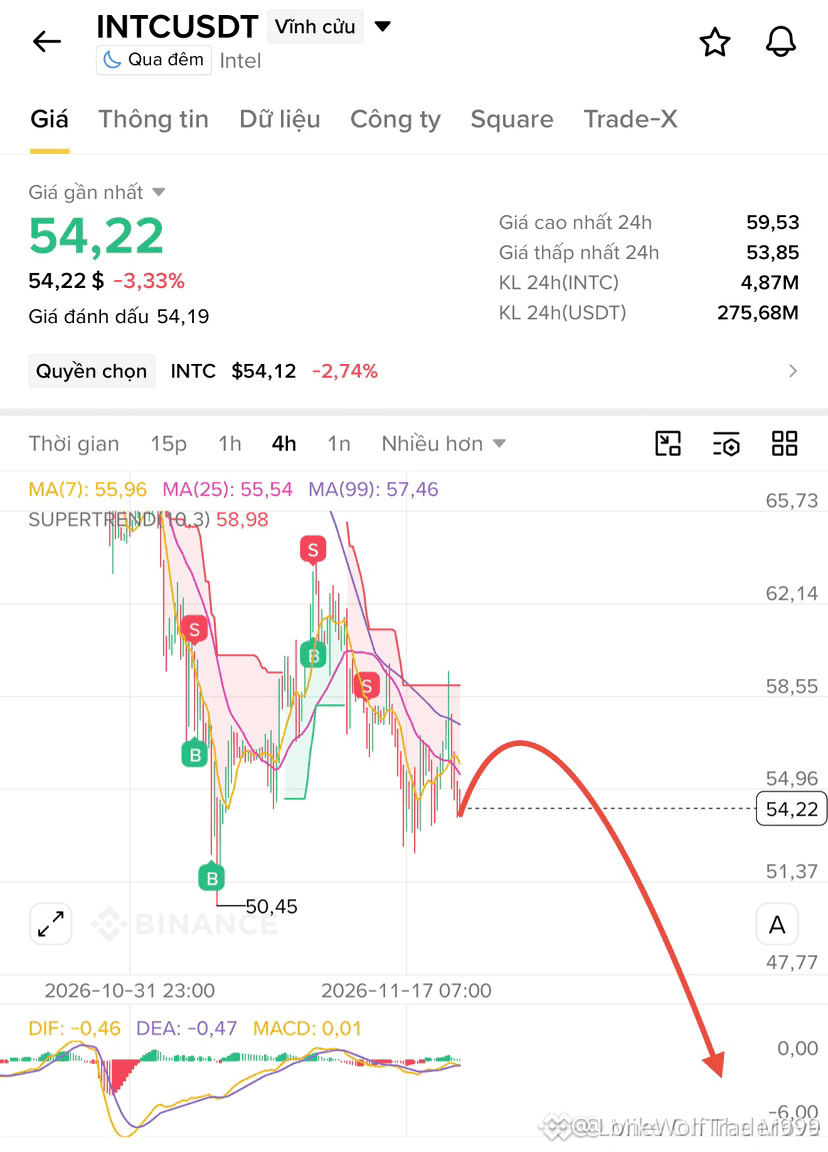
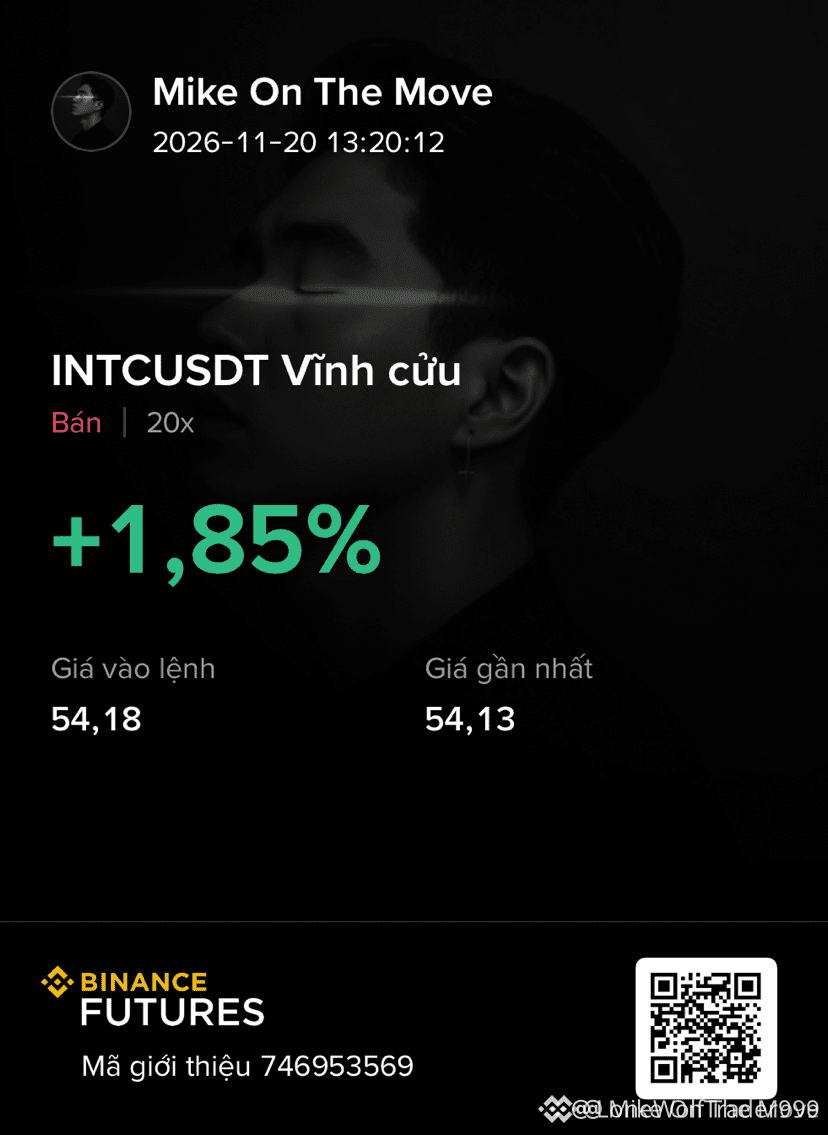
🔴 $INTC BEARISH STRUCTURE CRACKS AS SELLERS SEIZE CONTROL OF THE MID-RANGE! 📉
Entry: 53.66 - 54.74 ⚡
Target: 52.30, 50.95, 49.60 🎯
Stop Loss: 59.0 🛑
Price action is showing clear distribution at the upper boundary as aggressive sellers step in to absorb every relief bounce. 📊 Order flow reveals heavy sell-side liquidity stacked right above the current range, signaling exhaustion from buyers trying to defend the structure. ⚡
Momentum indicators on the lower timeframes are rolling over sharply while volume dries up on minor retracements. 🔍 This sets up a clean downward slide toward our projected liquidity pockets below. 💬 Are you waiting for a deeper retest of the highs or shorting this weakness right here? 👇
⚠️ Not financial advice. Always manage your risk. 🛡️
🏷️ #INTC #ShortSetup #Bearish #OrderFlow #Trading
🐻 📉
🔴 $INTC BEARISH STRUCTURE CRACKS AS SELLERS SEIZE CONTROL OF THE MID-RANGE! 📉
Entry: 53.66 - 54.74 ⚡
Target: 52.30, 50.95, 49.60 🎯
Stop Loss: 59.0 🛑
Price action is showing clear distribution at the upper boundary as aggressive sellers step in to absorb every relief bounce. 📊 Order flow reveals heavy sell-side liquidity stacked right above the current range, signaling exhaustion from buyers trying to defend the structure. ⚡
Momentum indicators on the lower timeframes are rolling over sharply while volume dries up on minor retracements. 🔍 This sets up a clean downward slide toward our projected liquidity pockets below. 💬 Are you waiting for a deeper retest of the highs or shorting this weakness right here? 👇
⚠️ Not financial advice. Always manage your risk. 🛡️
🏷️ #INTC #ShortSetup #Bearish #OrderFlow #Trading
🐻 📉
Entry: 53.66 - 54.74 ⚡
Target: 52.30, 50.95, 49.60 🎯
Stop Loss: 59.0 🛑
Price action is showing clear distribution at the upper boundary as aggressive sellers step in to absorb every relief bounce. 📊 Order flow reveals heavy sell-side liquidity stacked right above the current range, signaling exhaustion from buyers trying to defend the structure. ⚡
Momentum indicators on the lower timeframes are rolling over sharply while volume dries up on minor retracements. 🔍 This sets up a clean downward slide toward our projected liquidity pockets below. 💬 Are you waiting for a deeper retest of the highs or shorting this weakness right here? 👇
⚠️ Not financial advice. Always manage your risk. 🛡️
🏷️ #INTC #ShortSetup #Bearish #OrderFlow #Trading
🐻 📉
3

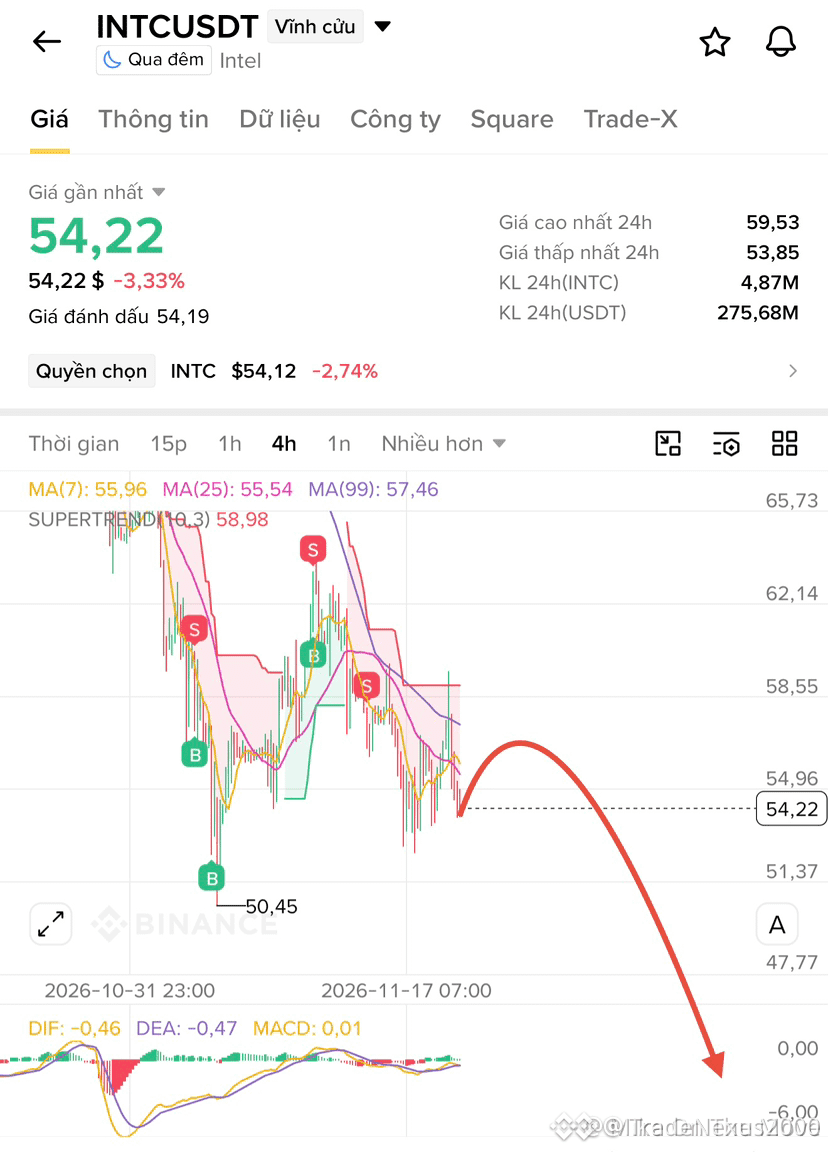
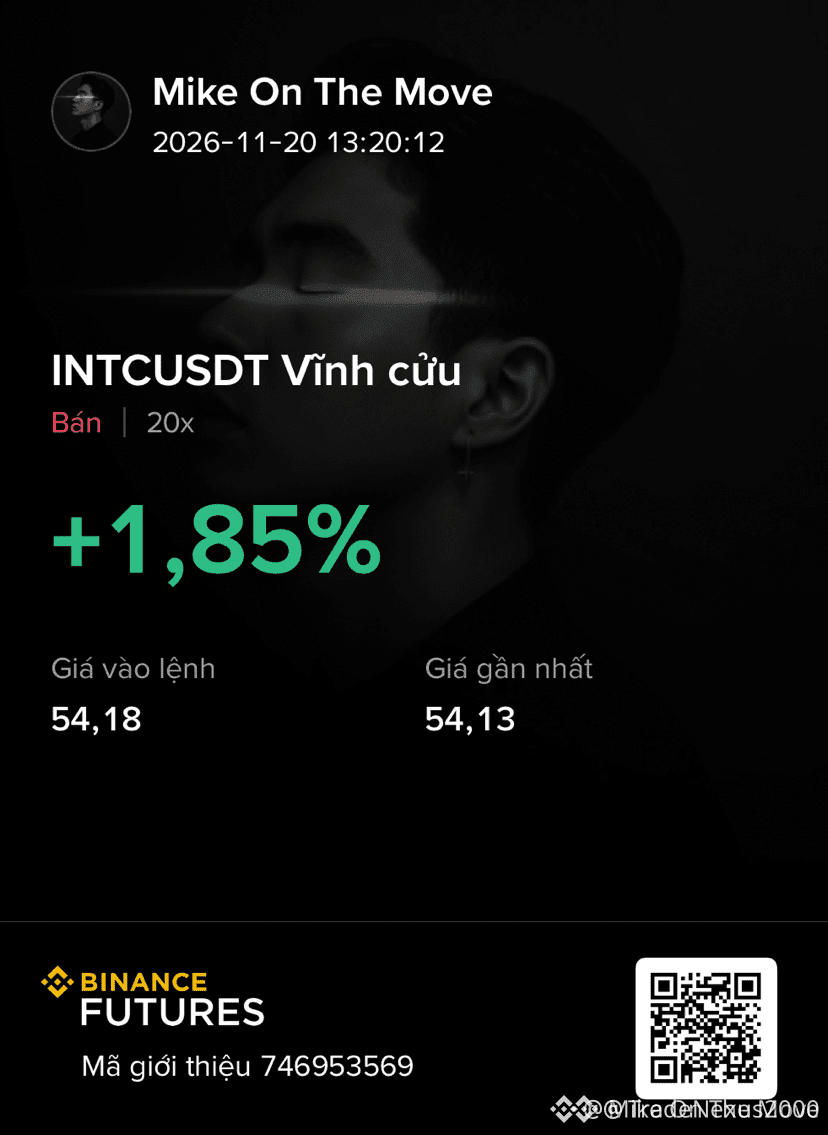
🔴 $INTC APPROACHING A MAJOR SUPPLY IMBALANCE READY FOR DISTRIBUTION 📉
Entry: 53.66 - 54.74 ⚡
Target: 49.60 🚀
Stop Loss: 59.0 ⚠️
Institutional order flow on $INTC shows persistent distribution as sellers defend the upper boundary of the current inefficiency. 📊 This rejection block between 53.66 and 54.74 marks a clean structural pivot where smart money is actively rebalancing inventory. ⚡
With overhead liquidity firmly capped below 59.0, the path of least resistance points toward lower structural demand zones. 🌊 Are you positioning for this continuation sweep or waiting for a deeper retest? 💬
⚠️ Not financial advice. Always manage your risk. 🛡️
🏷️ #INTC #ShortSetup #SmartMoney #MarketStructure #Trading
📉 🦈
🔴 $INTC APPROACHING A MAJOR SUPPLY IMBALANCE READY FOR DISTRIBUTION 📉
Entry: 53.66 - 54.74 ⚡
Target: 49.60 🚀
Stop Loss: 59.0 ⚠️
Institutional order flow on $INTC shows persistent distribution as sellers defend the upper boundary of the current inefficiency. 📊 This rejection block between 53.66 and 54.74 marks a clean structural pivot where smart money is actively rebalancing inventory. ⚡
With overhead liquidity firmly capped below 59.0, the path of least resistance points toward lower structural demand zones. 🌊 Are you positioning for this continuation sweep or waiting for a deeper retest? 💬
⚠️ Not financial advice. Always manage your risk. 🛡️
🏷️ #INTC #ShortSetup #SmartMoney #MarketStructure #Trading
📉 🦈
Entry: 53.66 - 54.74 ⚡
Target: 49.60 🚀
Stop Loss: 59.0 ⚠️
Institutional order flow on $INTC shows persistent distribution as sellers defend the upper boundary of the current inefficiency. 📊 This rejection block between 53.66 and 54.74 marks a clean structural pivot where smart money is actively rebalancing inventory. ⚡
With overhead liquidity firmly capped below 59.0, the path of least resistance points toward lower structural demand zones. 🌊 Are you positioning for this continuation sweep or waiting for a deeper retest? 💬
⚠️ Not financial advice. Always manage your risk. 🛡️
🏷️ #INTC #ShortSetup #SmartMoney #MarketStructure #Trading
📉 🦈
7

·
--
Bullish
$INTC / USDT Market Update | Nov 19, 2026*
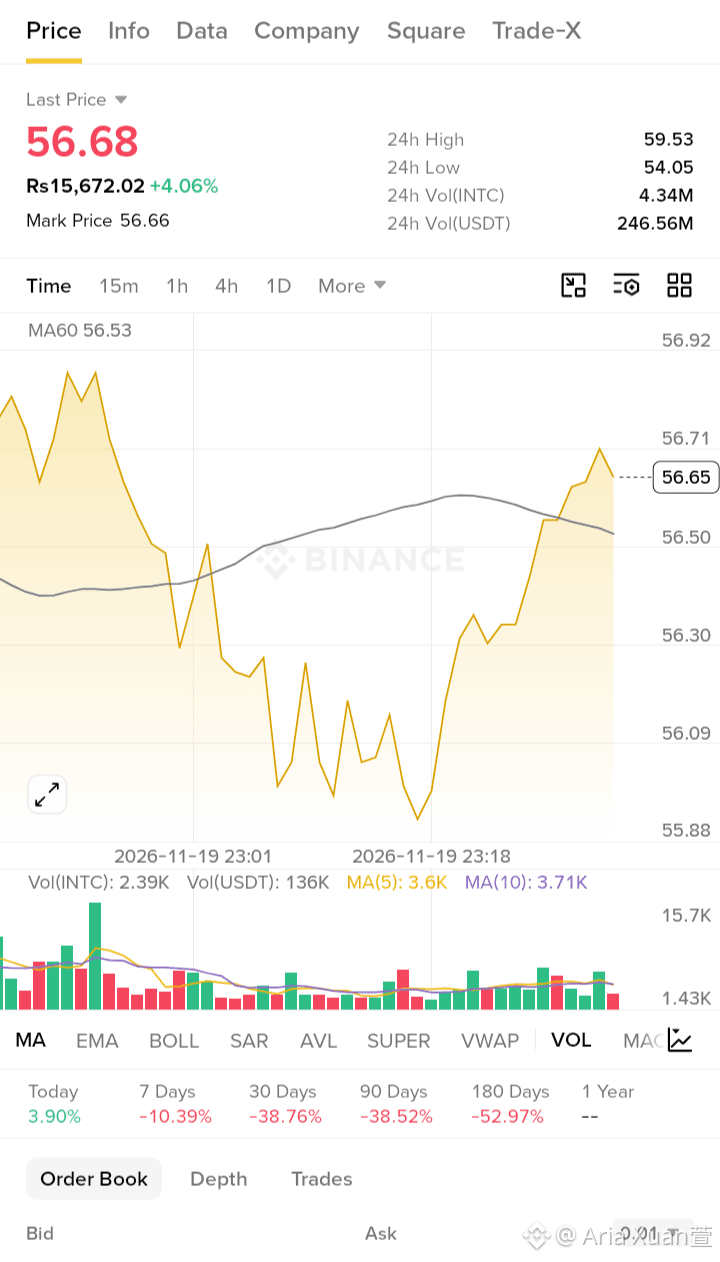
Last Price:* $56.68 (Rs 15,672.02) *+4.06%*
Mark Price:* $56.66
24H High:* $59.53
24H Low:* $54.05
24H Vol:* 4.34M INTC / 246.56M USDT
*Technical Analysis (15m):*
INTC with a STRONG bullish V-shape reversal!
After falling hard from $56.92 to $55.88 around 23:01, INTC formed a double bottom and then launched a massive rally all the way to $56.71 - almost $0.83 recovery. This is a perfect bullish reversal pattern.
Currently at *$56.65*, trading *ABOVE MA60 at $56.53*. MA60 was rising, then turned down, but price has now broken back above MA60 with strength. MA60 at $56.50 is now acting as support - bullish structure confirmed.
Volume: Vol(INTC) 2.39K Vol(USDT) 136K. MA(5) 3.6K vs MA(10) 3.71K - gap narrowing. Green volume increasing during the rally, especially last few candles show buyers in control. The volume spike at $56.92 top earlier was distribution, now accumulation.
Performance: Today +3.90% very strong, 7 Days -10.39% still in recovery, 30 Days -38.76%, 90 Days -38.52%, 180 Days -52.97% - INTC was in deep correction but today showing first sign of strong comeback.
*Key Levels:*
Support: $56.53 (MA60) / $56.30 / $55.88 (Intraday Low)
Resistance: $56.71 / $56.92 / $59.53 (24H High)
As long as INTC holds above $56.53 MA60, momentum remains bullish. A sustained move above $56.71 can push towards $56.92 and then $59.53.
Bullish reversal confirmed - uptrend in progress.
{future}(INTCUSDT)
Not Financial Advice. DYOR.
#INTC #Intel #Stocks #Binance
$INTC / USDT Market Update | Nov 19, 2026*
Last Price:* $56.68 (Rs 15,672.02) *+4.06%*
Mark Price:* $56.66
24H High:* $59.53
24H Low:* $54.05
24H Vol:* 4.34M INTC / 246.56M USDT
*Technical Analysis (15m):*
INTC with a STRONG bullish V-shape reversal!
After falling hard from $56.92 to $55.88 around 23:01, INTC formed a double bottom and then launched a massive rally all the way to $56.71 - almost $0.83 recovery. This is a perfect bullish reversal pattern.
Currently at *$56.65*, trading *ABOVE MA60 at $56.53*. MA60 was rising, then turned down, but price has now broken back above MA60 with strength. MA60 at $56.50 is now acting as support - bullish structure confirmed.
Volume: Vol(INTC) 2.39K Vol(USDT) 136K. MA(5) 3.6K vs MA(10) 3.71K - gap narrowing. Green volume increasing during the rally, especially last few candles show buyers in control. The volume spike at $56.92 top earlier was distribution, now accumulation.
Performance: Today +3.90% very strong, 7 Days -10.39% still in recovery, 30 Days -38.76%, 90 Days -38.52%, 180 Days -52.97% - INTC was in deep correction but today showing first sign of strong comeback.
*Key Levels:*
Support: $56.53 (MA60) / $56.30 / $55.88 (Intraday Low)
Resistance: $56.71 / $56.92 / $59.53 (24H High)
As long as INTC holds above $56.53 MA60, momentum remains bullish. A sustained move above $56.71 can push towards $56.92 and then $59.53.
Bullish reversal confirmed - uptrend in progress.
Not Financial Advice. DYOR.
#INTC #Intel #Stocks #Binance
Last Price:* $56.68 (Rs 15,672.02) *+4.06%*
Mark Price:* $56.66
24H High:* $59.53
24H Low:* $54.05
24H Vol:* 4.34M INTC / 246.56M USDT
*Technical Analysis (15m):*
INTC with a STRONG bullish V-shape reversal!
After falling hard from $56.92 to $55.88 around 23:01, INTC formed a double bottom and then launched a massive rally all the way to $56.71 - almost $0.83 recovery. This is a perfect bullish reversal pattern.
Currently at *$56.65*, trading *ABOVE MA60 at $56.53*. MA60 was rising, then turned down, but price has now broken back above MA60 with strength. MA60 at $56.50 is now acting as support - bullish structure confirmed.
Volume: Vol(INTC) 2.39K Vol(USDT) 136K. MA(5) 3.6K vs MA(10) 3.71K - gap narrowing. Green volume increasing during the rally, especially last few candles show buyers in control. The volume spike at $56.92 top earlier was distribution, now accumulation.
Performance: Today +3.90% very strong, 7 Days -10.39% still in recovery, 30 Days -38.76%, 90 Days -38.52%, 180 Days -52.97% - INTC was in deep correction but today showing first sign of strong comeback.
*Key Levels:*
Support: $56.53 (MA60) / $56.30 / $55.88 (Intraday Low)
Resistance: $56.71 / $56.92 / $59.53 (24H High)
As long as INTC holds above $56.53 MA60, momentum remains bullish. A sustained move above $56.71 can push towards $56.92 and then $59.53.
Bullish reversal confirmed - uptrend in progress.
Not Financial Advice. DYOR.
#INTC #Intel #Stocks #Binance
185

·
--
#INTC $INTC 🟢 INTC-4-hour-Countertrend Long
• Real-time price: 53.09
• Signal type: MiX reversal signal
• Asset: Intel stock
SunspotAlgo @ 00:00:04 UTC+8
#INTC $INTC 🟢 INTC-4-hour-Countertrend Long
• Real-time price: 53.09
• Signal type: MiX reversal signal
• Asset: Intel stock
SunspotAlgo @ 00:00:04 UTC+8
• Real-time price: 53.09
• Signal type: MiX reversal signal
• Asset: Intel stock
SunspotAlgo @ 00:00:04 UTC+8
22


·
--
Bullish
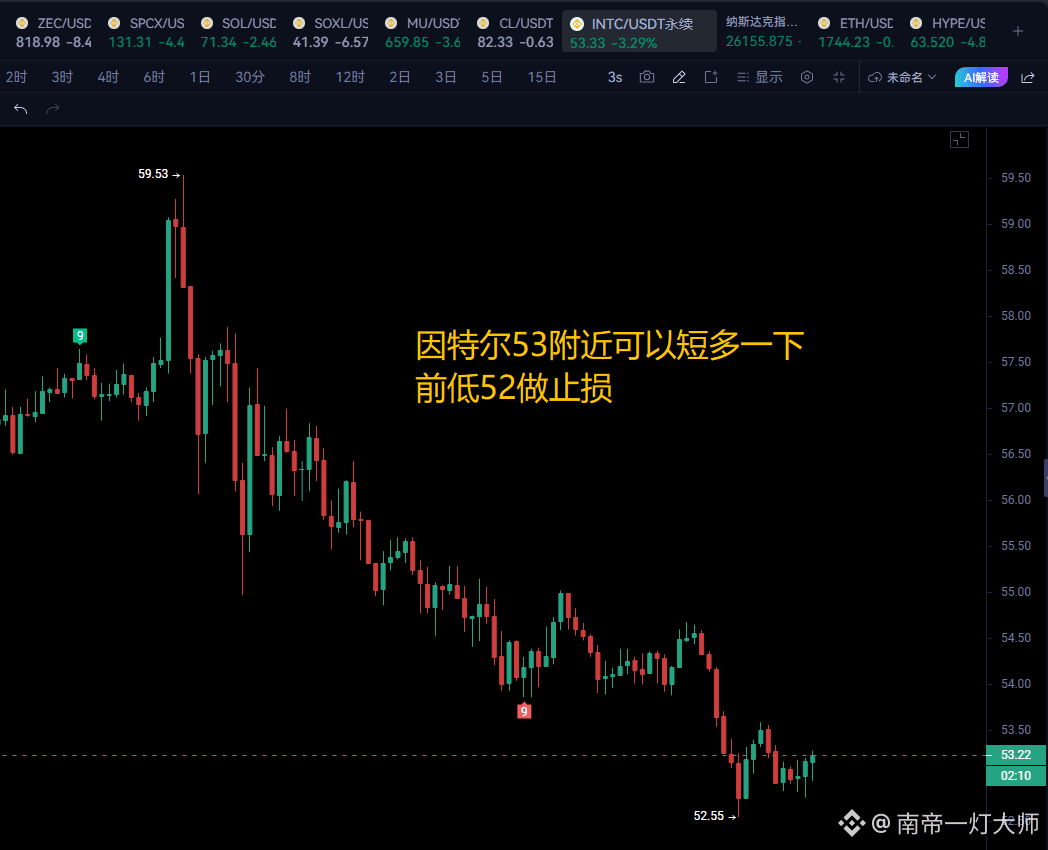
#INTC Near Intel at 53, you could take a short-term long position. After the sharp drop a while back, other U.S. stocks have recently hit new lows, but Intel hasn't broken below this recent low of 50. You could make a short-term trade with a tight stop-loss.
#INTC Near Intel at 53, you could take a short-term long position. After the sharp drop a while back, other U.S. stocks have recently hit new lows, but Intel hasn't broken below this recent low of 50. You could make a short-term trade with a tight stop-loss.
加密fei:
会不会补跌哦,现在公司代工利好!但感觉也止不住
2
1
2
2.8k

·
--
$INTC Today, it was back at 52. Then an evening bullish candle pulled me back up.
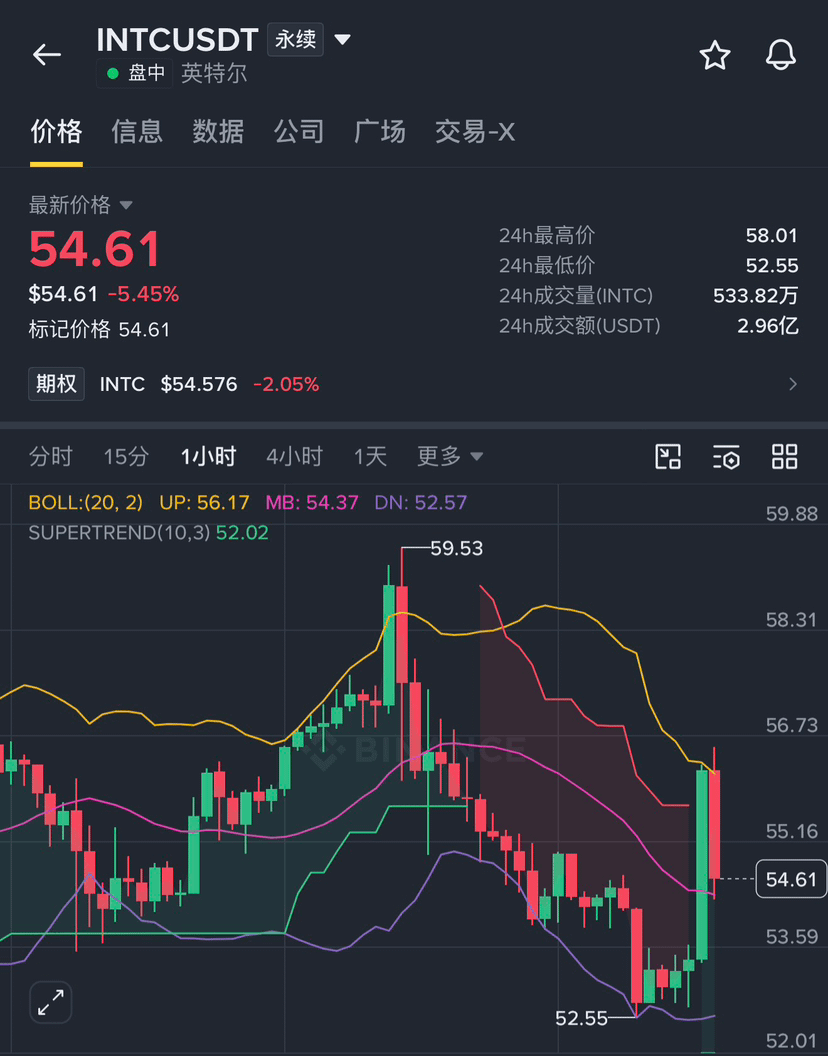
On Thursday night, I wrote about it at 57.48, after it had climbed past 56. I said I was watching to see whether it could hold between 58 and 60.
It didn’t hold. In the early hours of last night, it surged to 59.45, then a bearish candle pushed it back down. It ground lower throughout the day today: 57 was gone, then 55. By late afternoon, it dipped as low as 52.51. I was watching the 15-minute chart, thinking: this time it’s going back to 50.
And then?
It didn’t go back to 50. A little after 10 p.m., a big bullish candle shot it from 53 to around 56.5. Now it’s 11 p.m. on Friday, and it’s at 56.01—up 6.7% from 52.51.
From 59.45, it fell as much as 11.7%; it’s still down 5.8% now.
What makes you most tempted to kick yourself is that the price I most wanted to sell at this evening turned out to be today’s low.
That upward move took just one hour. But the whole day it spent giving those gains back took more than ten hours.
Did you buy in around 52.5, or were you like me, watching it fall and too afraid to act?
#Intel #INTC #加息预期叠加美股分流,比特币跌破6.2万美元 #GTA6 officially launches—could TTWO’s stock get a boost?
$INTC Today, it was back at 52. Then an evening bullish candle pulled me back up.
On Thursday night, I wrote about it at 57.48, after it had climbed past 56. I said I was watching to see whether it could hold between 58 and 60.
It didn’t hold. In the early hours of last night, it surged to 59.45, then a bearish candle pushed it back down. It ground lower throughout the day today: 57 was gone, then 55. By late afternoon, it dipped as low as 52.51. I was watching the 15-minute chart, thinking: this time it’s going back to 50.
And then?
It didn’t go back to 50. A little after 10 p.m., a big bullish candle shot it from 53 to around 56.5. Now it’s 11 p.m. on Friday, and it’s at 56.01—up 6.7% from 52.51.
From 59.45, it fell as much as 11.7%; it’s still down 5.8% now.
What makes you most tempted to kick yourself is that the price I most wanted to sell at this evening turned out to be today’s low.
That upward move took just one hour. But the whole day it spent giving those gains back took more than ten hours.
Did you buy in around 52.5, or were you like me, watching it fall and too afraid to act?
#Intel #INTC #加息预期叠加美股分流,比特币跌破6.2万美元 #GTA6 officially launches—could TTWO’s stock get a boost?
On Thursday night, I wrote about it at 57.48, after it had climbed past 56. I said I was watching to see whether it could hold between 58 and 60.
It didn’t hold. In the early hours of last night, it surged to 59.45, then a bearish candle pushed it back down. It ground lower throughout the day today: 57 was gone, then 55. By late afternoon, it dipped as low as 52.51. I was watching the 15-minute chart, thinking: this time it’s going back to 50.
And then?
It didn’t go back to 50. A little after 10 p.m., a big bullish candle shot it from 53 to around 56.5. Now it’s 11 p.m. on Friday, and it’s at 56.01—up 6.7% from 52.51.
From 59.45, it fell as much as 11.7%; it’s still down 5.8% now.
What makes you most tempted to kick yourself is that the price I most wanted to sell at this evening turned out to be today’s low.
That upward move took just one hour. But the whole day it spent giving those gains back took more than ten hours.
Did you buy in around 52.5, or were you like me, watching it fall and too afraid to act?
#Intel #INTC #加息预期叠加美股分流,比特币跌破6.2万美元 #GTA6 officially launches—could TTWO’s stock get a boost?
3
1.2k

·
--
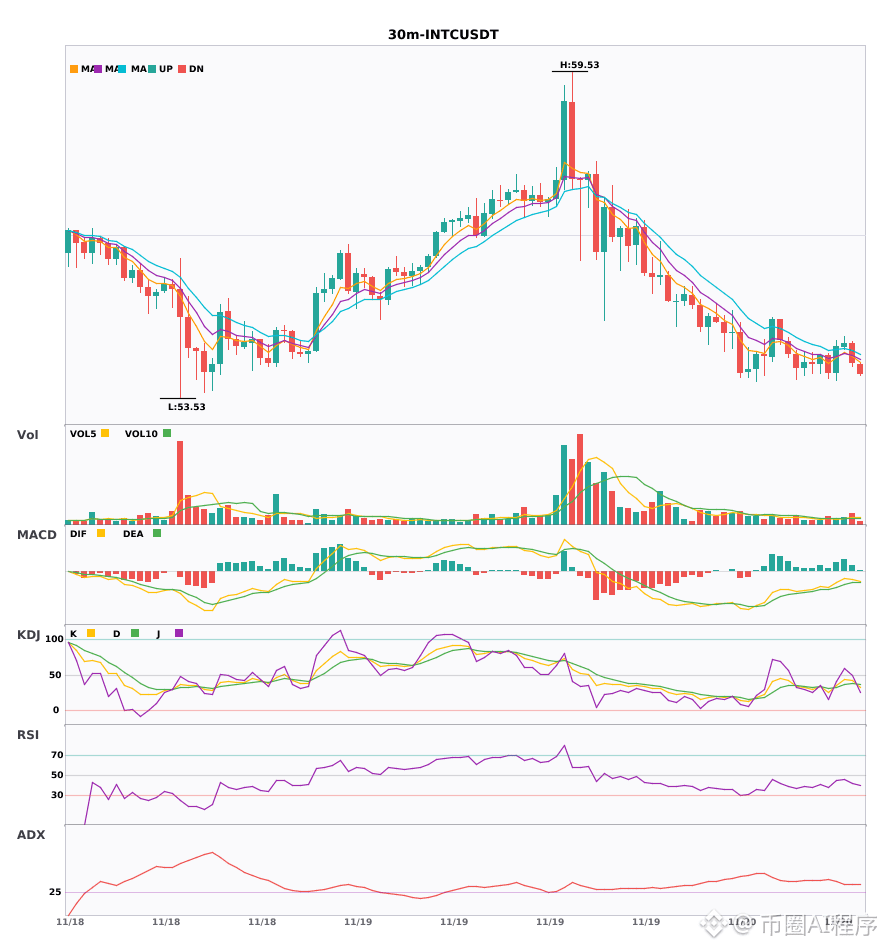
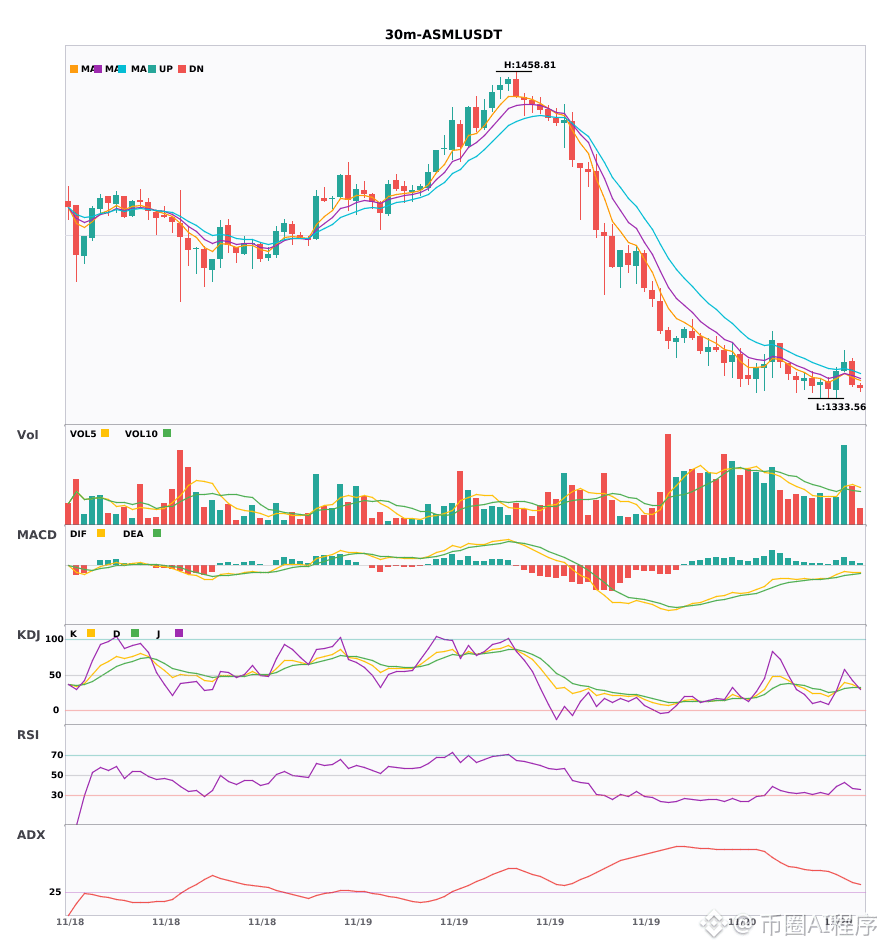
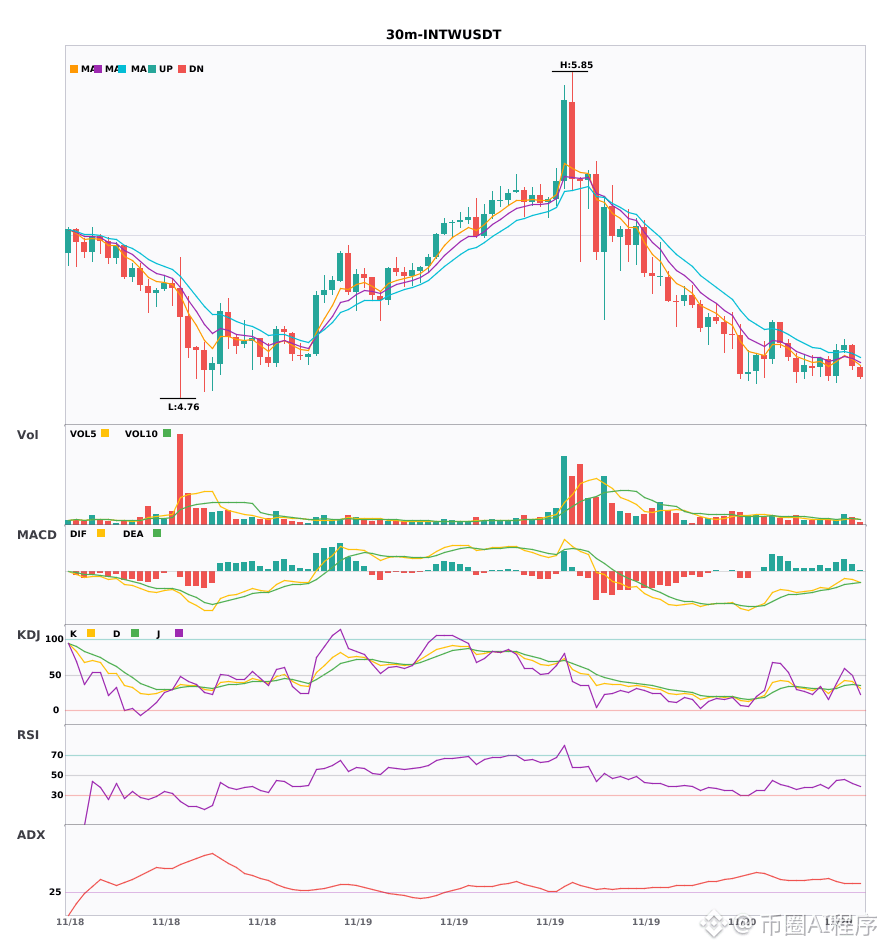
$INTC $ASML $INTW 30-minute bearish signal; 4-hour bearish trend confirmed 🔥
════════════════════
🟢 $INTC 30-minute bearish signal
⚠️Technical: 4-hour bearish + 30-minute bearish confluence confirmed. EMA5 crossed below EMA8, and the moving averages have turned bearish. KDJ is weak (K41.7 D38.0), with volume up 1.7x.
════════════════════
🟢 $ASML 30-minute bearish signal
⚠️Technical: 4-hour bearish + 30-minute entry confluence! The 30-minute EMA5 has just crossed below EMA8, turning bearish. KDJ is weak (K36 D32), with volume up 2.2x.
════════════════════
🟢 $INTW 30-minute bearish signal
⚠️Technical: The 30-minute EMA5 has just crossed below EMA8, turning bearish. KDJ is weak and moving downward, but not oversold. Volume is up 1.7x, confirming multi-timeframe confluence with the 4-hour bearish trend. The bearish signal is clear.
════════════════════
🔔 Follow for firsthand market movement alerts 🔔
#多周期共振 #INTC #ASML #INTW
📌 When trading, pay attention to whether the candlestick pattern aligns.
$INTC $ASML $INTW 30-minute bearish signal; 4-hour bearish trend confirmed 🔥
════════════════════
🟢 $INTC 30-minute bearish signal
⚠️Technical: 4-hour bearish + 30-minute bearish confluence confirmed. EMA5 crossed below EMA8, and the moving averages have turned bearish. KDJ is weak (K41.7 D38.0), with volume up 1.7x.
════════════════════
🟢 $ASML 30-minute bearish signal
⚠️Technical: 4-hour bearish + 30-minute entry confluence! The 30-minute EMA5 has just crossed below EMA8, turning bearish. KDJ is weak (K36 D32), with volume up 2.2x.
════════════════════
🟢 $INTW 30-minute bearish signal
⚠️Technical: The 30-minute EMA5 has just crossed below EMA8, turning bearish. KDJ is weak and moving downward, but not oversold. Volume is up 1.7x, confirming multi-timeframe confluence with the 4-hour bearish trend. The bearish signal is clear.
════════════════════
🔔 Follow for firsthand market movement alerts 🔔
#多周期共振 #INTC #ASML #INTW
📌 When trading, pay attention to whether the candlestick pattern aligns.
════════════════════
🟢 $INTC 30-minute bearish signal
⚠️Technical: 4-hour bearish + 30-minute bearish confluence confirmed. EMA5 crossed below EMA8, and the moving averages have turned bearish. KDJ is weak (K41.7 D38.0), with volume up 1.7x.
════════════════════
🟢 $ASML 30-minute bearish signal
⚠️Technical: 4-hour bearish + 30-minute entry confluence! The 30-minute EMA5 has just crossed below EMA8, turning bearish. KDJ is weak (K36 D32), with volume up 2.2x.
════════════════════
🟢 $INTW 30-minute bearish signal
⚠️Technical: The 30-minute EMA5 has just crossed below EMA8, turning bearish. KDJ is weak and moving downward, but not oversold. Volume is up 1.7x, confirming multi-timeframe confluence with the 4-hour bearish trend. The bearish signal is clear.
════════════════════
🔔 Follow for firsthand market movement alerts 🔔
#多周期共振 #INTC #ASML #INTW
📌 When trading, pay attention to whether the candlestick pattern aligns.
17

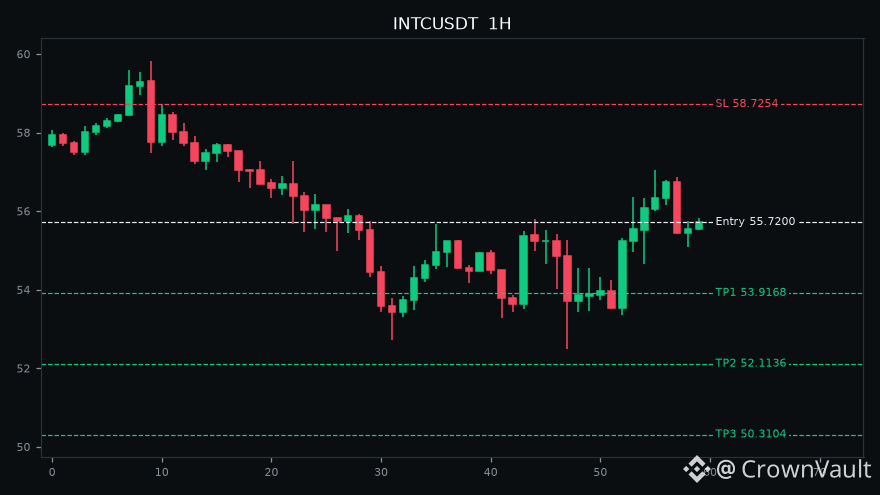

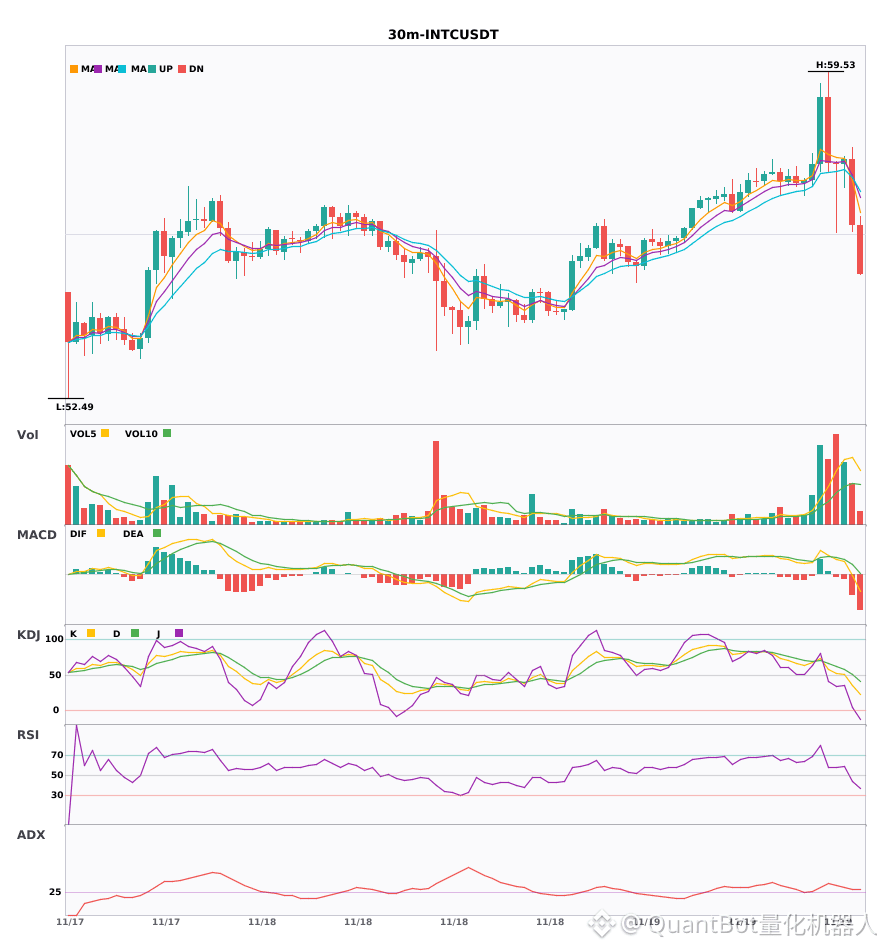
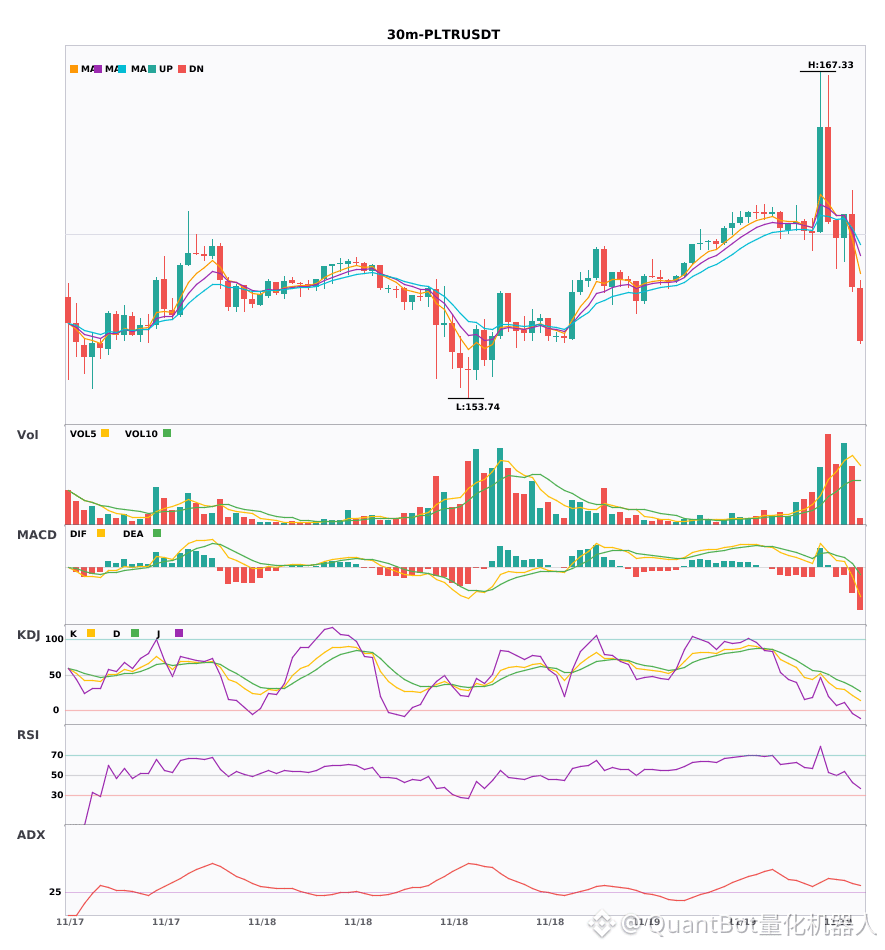
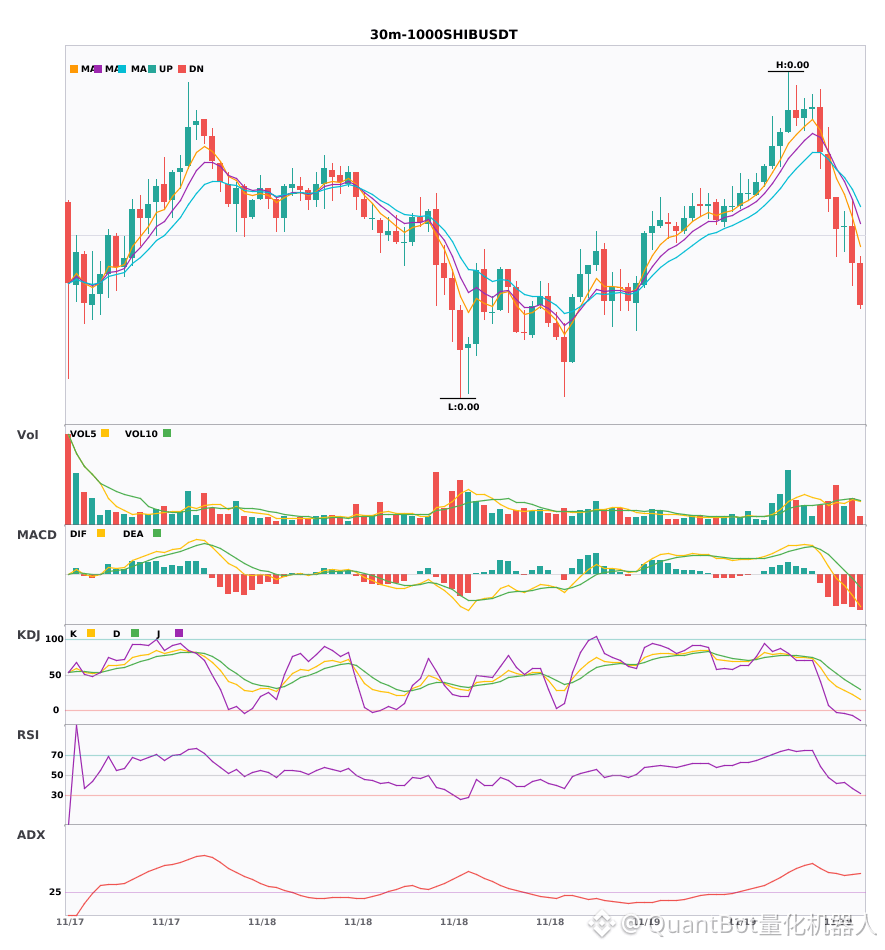
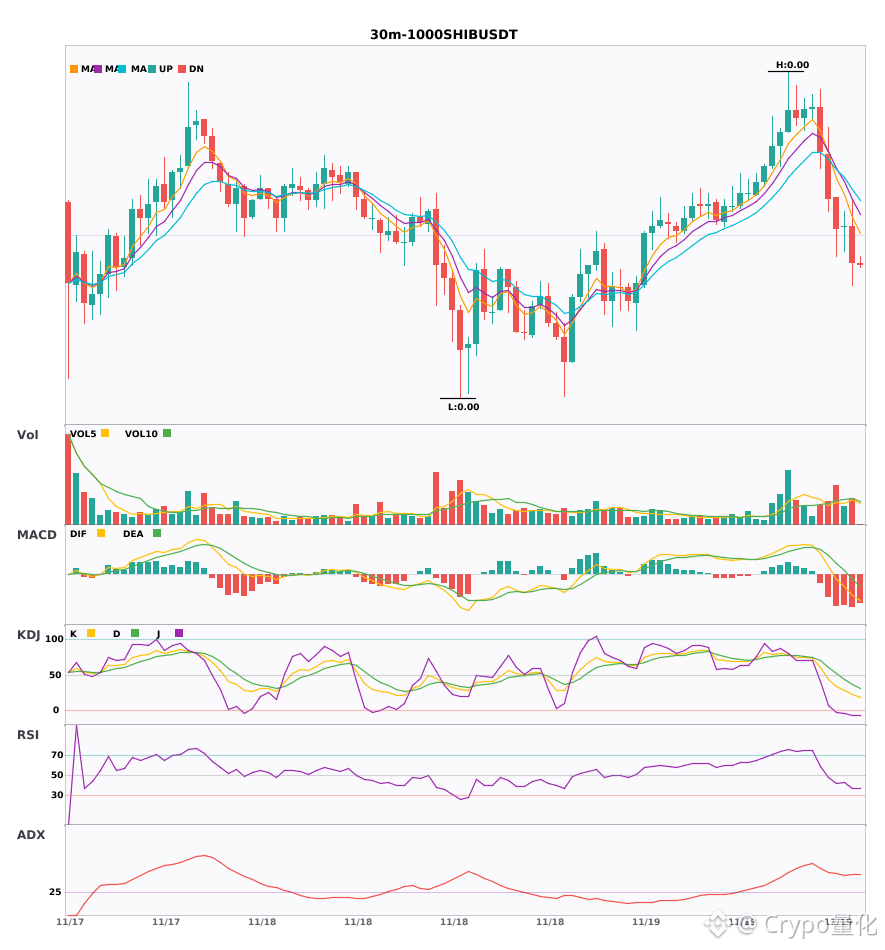
$INTC/$PLTR/$1000SHIB 30m converging bearish signals
📉 $INTC | 30-minute bearish signal
━━━━━━━━━━━━━━━━━━
Technical analysis: ADX(28) indicates a developing trend with potential trading opportunities; MACD DIF has crossed below the zero line, indicating weakening momentum; EMA5 has fallen below EMA8, suggesting a short-term bearish outlook; volume is up approximately 1.6x.
Price change: -2.4600%
📉 $PLTR | 30-minute bearish signal
━━━━━━━━━━━━━━━━━━
Technical analysis: ADX(35), a pronounced trend | MACD DIF crosses below the zero line, turning bearish | EMA5 crosses below EMA8, short-term bearish | KDJ weak in oversold territory (K20.9 D33.2) | Trading volume doubles
Price change: -1.8800%
📉 $1000SHIB | 30-minute bearish signal
━━━━━━━━━━━━━━━━━━
Technical analysis: ADX(48) indicates a strong trend; beware of overheating; MACD is bearish, with weakening momentum; EMA5/8/13 are bearishly aligned; KDJ is weak (K28.0 D44.0); volume is up 1.6x.
Price change: 0.0500%
━━━━━━━━━━━━━━━━━━
#技术分析 #INTC #PLTR #1000SHIB
📌 The above content is for reference only and does not constitute investment advice
$INTC /$PLTR /$1000SHIB 30m converging bearish signals
📉 $INTC | 30-minute bearish signal
━━━━━━━━━━━━━━━━━━
Technical analysis: ADX(28) indicates a developing trend with potential trading opportunities; MACD DIF has crossed below the zero line, indicating weakening momentum; EMA5 has fallen below EMA8, suggesting a short-term bearish outlook; volume is up approximately 1.6x.
Price change: -2.4600%
📉 $PLTR | 30-minute bearish signal
━━━━━━━━━━━━━━━━━━
Technical analysis: ADX(35), a pronounced trend | MACD DIF crosses below the zero line, turning bearish | EMA5 crosses below EMA8, short-term bearish | KDJ weak in oversold territory (K20.9 D33.2) | Trading volume doubles
Price change: -1.8800%
📉 $1000SHIB | 30-minute bearish signal
━━━━━━━━━━━━━━━━━━
Technical analysis: ADX(48) indicates a strong trend; beware of overheating; MACD is bearish, with weakening momentum; EMA5/8/13 are bearishly aligned; KDJ is weak (K28.0 D44.0); volume is up 1.6x.
Price change: 0.0500%
━━━━━━━━━━━━━━━━━━
#技术分析 #INTC #PLTR #1000SHIB
📌 The above content is for reference only and does not constitute investment advice
📉 $INTC | 30-minute bearish signal
━━━━━━━━━━━━━━━━━━
Technical analysis: ADX(28) indicates a developing trend with potential trading opportunities; MACD DIF has crossed below the zero line, indicating weakening momentum; EMA5 has fallen below EMA8, suggesting a short-term bearish outlook; volume is up approximately 1.6x.
Price change: -2.4600%
📉 $PLTR | 30-minute bearish signal
━━━━━━━━━━━━━━━━━━
Technical analysis: ADX(35), a pronounced trend | MACD DIF crosses below the zero line, turning bearish | EMA5 crosses below EMA8, short-term bearish | KDJ weak in oversold territory (K20.9 D33.2) | Trading volume doubles
Price change: -1.8800%
📉 $1000SHIB | 30-minute bearish signal
━━━━━━━━━━━━━━━━━━
Technical analysis: ADX(48) indicates a strong trend; beware of overheating; MACD is bearish, with weakening momentum; EMA5/8/13 are bearishly aligned; KDJ is weak (K28.0 D44.0); volume is up 1.6x.
Price change: 0.0500%
━━━━━━━━━━━━━━━━━━
#技术分析 #INTC #PLTR #1000SHIB
📌 The above content is for reference only and does not constitute investment advice
1

·
--
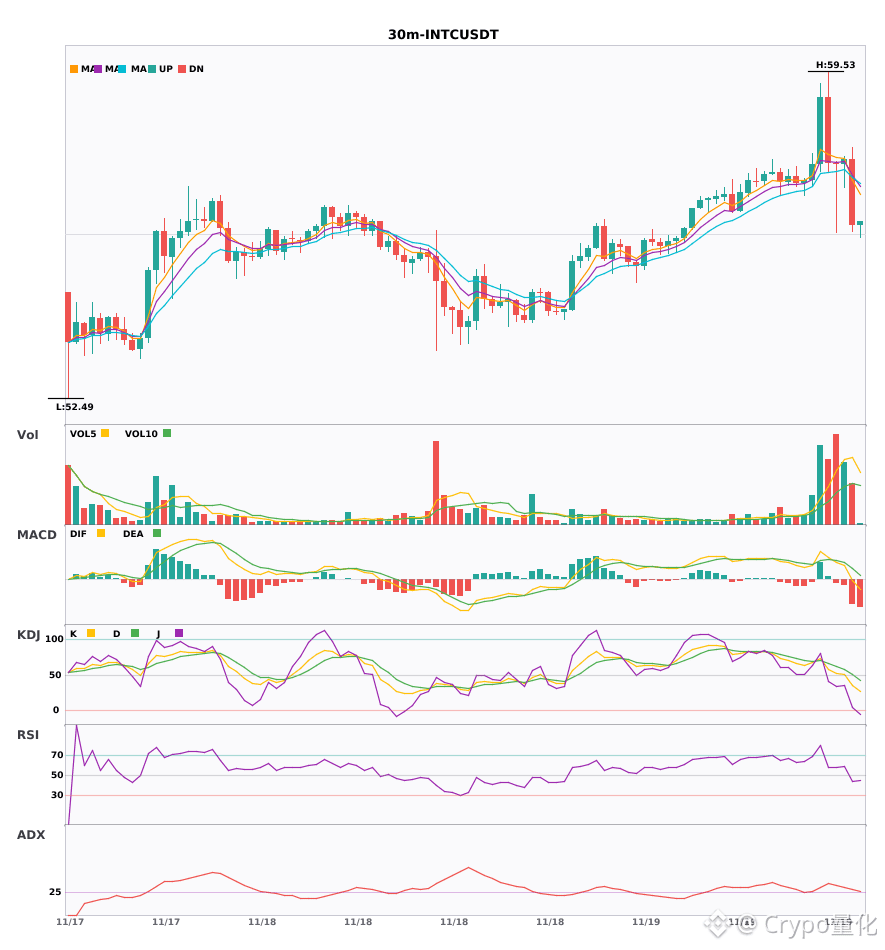
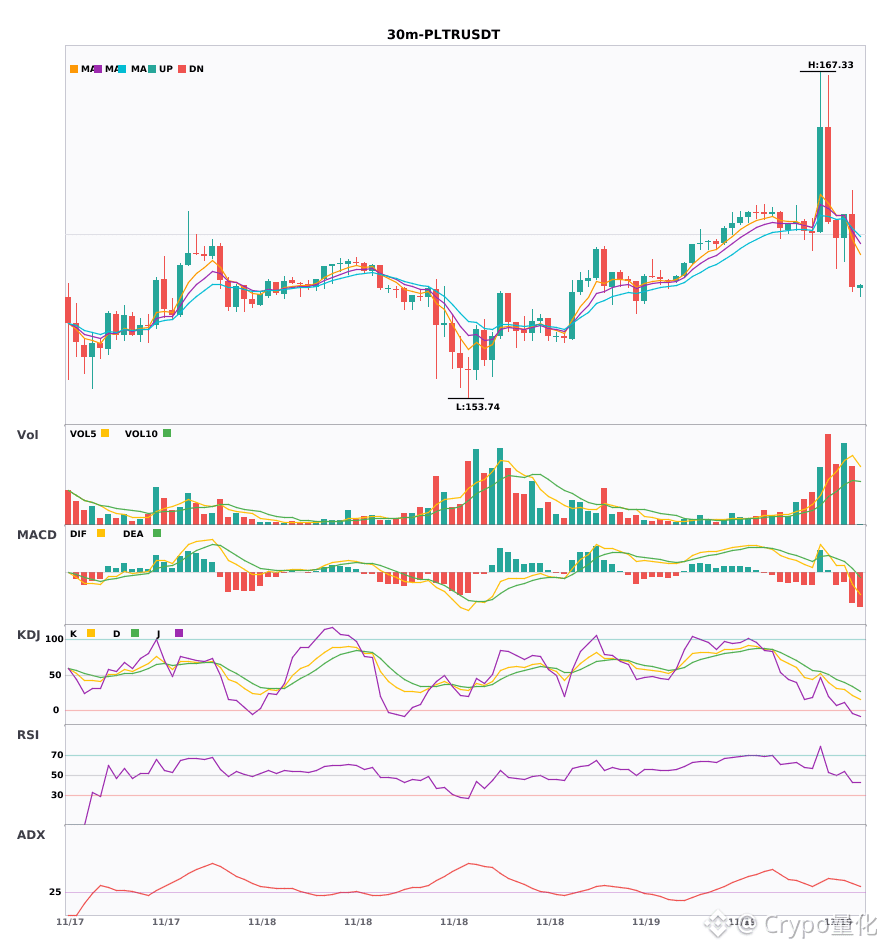
$INTC/$PLTR/$1000SHIB are all weakening on the 30-minute chart—be careful 🔥
════════════════════
🟢 $INTC 30-minute bearish signal
⚠️ Technicals: The ADX trend is just taking shape and worth watching. MACD has crossed below the zero line, turning bearish. Short-term moving averages have also crossed downward. Volume is up 1.6x.
════════════════════
🟢 $PLTR 30-minute bearish signal
⚠️ Technicals: ADX at 35 signals a clear trend. The MACD histogram is expanding in the negative direction, and the moving averages are bearishly aligned and pointing down. KDJ is weak (K20.9, D33.2), with volume doubling.
════════════════════
🟢 $1000SHIB 30-minute bearish signal
⚠️ Technicals: ADX is as high as 48, indicating a very strong trend, but watch out for an overheated pullback. MACD's bearish momentum is weakening, and the moving averages have just formed a bearish alignment. KDJ is weak; K has yet to cross above D, so bears have the upper hand. Volume is up 1.6x.
════════════════════
🔔 Follow for first-hand market updates 🔔
#技术分析 #INTC #PLTR #1000SHIB
📌 When trading, watch whether the candlestick pattern confirms the signal
$INTC /$PLTR /$1000SHIB are all weakening on the 30-minute chart—be careful 🔥
════════════════════
🟢 $INTC 30-minute bearish signal
⚠️ Technicals: The ADX trend is just taking shape and worth watching. MACD has crossed below the zero line, turning bearish. Short-term moving averages have also crossed downward. Volume is up 1.6x.
════════════════════
🟢 $PLTR 30-minute bearish signal
⚠️ Technicals: ADX at 35 signals a clear trend. The MACD histogram is expanding in the negative direction, and the moving averages are bearishly aligned and pointing down. KDJ is weak (K20.9, D33.2), with volume doubling.
════════════════════
🟢 $1000SHIB 30-minute bearish signal
⚠️ Technicals: ADX is as high as 48, indicating a very strong trend, but watch out for an overheated pullback. MACD's bearish momentum is weakening, and the moving averages have just formed a bearish alignment. KDJ is weak; K has yet to cross above D, so bears have the upper hand. Volume is up 1.6x.
════════════════════
🔔 Follow for first-hand market updates 🔔
#技术分析 #INTC #PLTR #1000SHIB
📌 When trading, watch whether the candlestick pattern confirms the signal
════════════════════
🟢 $INTC 30-minute bearish signal
⚠️ Technicals: The ADX trend is just taking shape and worth watching. MACD has crossed below the zero line, turning bearish. Short-term moving averages have also crossed downward. Volume is up 1.6x.
════════════════════
🟢 $PLTR 30-minute bearish signal
⚠️ Technicals: ADX at 35 signals a clear trend. The MACD histogram is expanding in the negative direction, and the moving averages are bearishly aligned and pointing down. KDJ is weak (K20.9, D33.2), with volume doubling.
════════════════════
🟢 $1000SHIB 30-minute bearish signal
⚠️ Technicals: ADX is as high as 48, indicating a very strong trend, but watch out for an overheated pullback. MACD's bearish momentum is weakening, and the moving averages have just formed a bearish alignment. KDJ is weak; K has yet to cross above D, so bears have the upper hand. Volume is up 1.6x.
════════════════════
🔔 Follow for first-hand market updates 🔔
#技术分析 #INTC #PLTR #1000SHIB
📌 When trading, watch whether the candlestick pattern confirms the signal
11
·
--
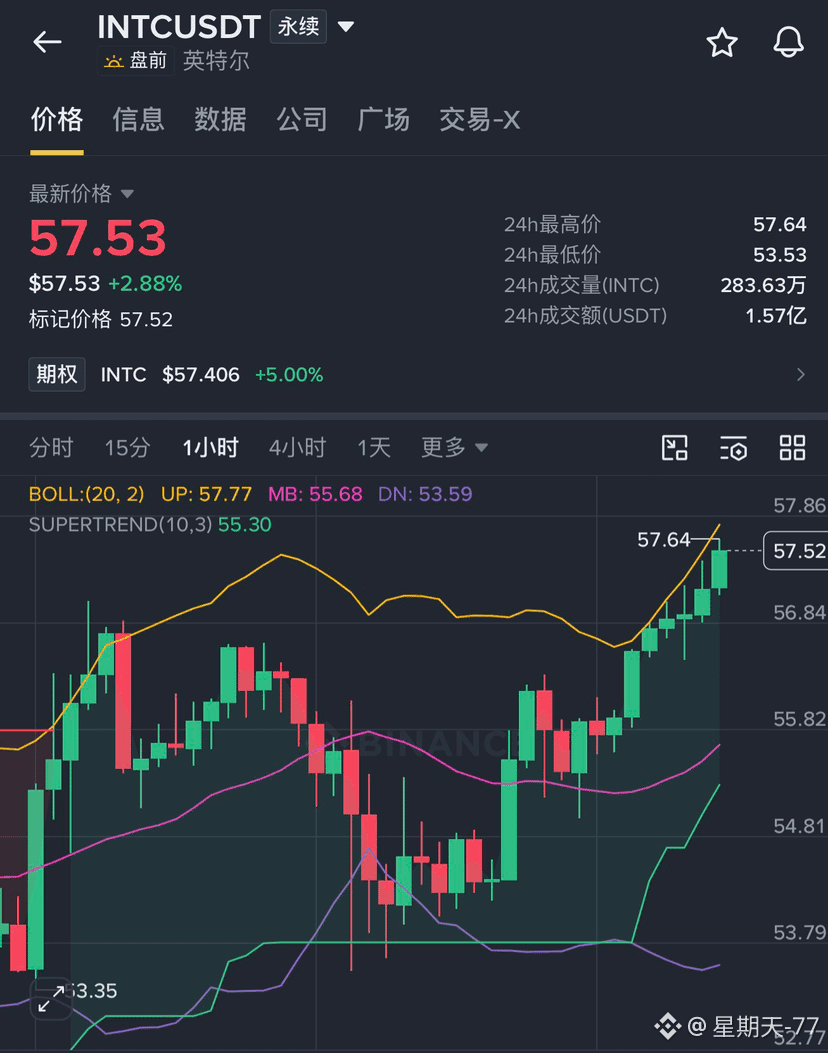
$INTC These past couple of days, it’s finally climbed a little way up from the bottom, but I’m not quite sure I believe it.
On Tuesday night, I wrote about it: 55.30, dipping to 52.72. I said each new bottom was lower than the last, and each rebound weaker.
Then it did something a little different. On Wednesday during the day, it pulled back to around 53.5 without breaking below, then started inching up in the evening. Today it climbed steadily past 56. Now it’s Thursday, a little after 7:40 p.m., and it’s at 57.48.
From 52.49 (the lowest point marked on the chart), that’s up 9.5%. From the high of 62.79, it’s still 8.5% off.
For the first time this week, it’s showing this pattern: each pullback low is higher than the last—52.49, 53.5, and now it’s holding above 57. Last time, it got pushed back around 58 and 60. It’s now just a little way from that level.
But I remember last Monday, it climbed all the way to 60.2 just like this, then one bearish candle wiped out 7% in a day.
What I’m watching now isn’t how high it can go, but whether it can hold between 58 and 60.
Did you get in around 52.5, or are you like me, watching it climb and not daring to chase?
#Intel #INTC #美联储纪要放鹰,比特币继续承压 #英伟达董事会曝分歧,三名董事支持黄仁勋回归
{future}(INTCUSDT)
$INTC These past couple of days, it’s finally climbed a little way up from the bottom, but I’m not quite sure I believe it.
On Tuesday night, I wrote about it: 55.30, dipping to 52.72. I said each new bottom was lower than the last, and each rebound weaker.
Then it did something a little different. On Wednesday during the day, it pulled back to around 53.5 without breaking below, then started inching up in the evening. Today it climbed steadily past 56. Now it’s Thursday, a little after 7:40 p.m., and it’s at 57.48.
From 52.49 (the lowest point marked on the chart), that’s up 9.5%. From the high of 62.79, it’s still 8.5% off.
For the first time this week, it’s showing this pattern: each pullback low is higher than the last—52.49, 53.5, and now it’s holding above 57. Last time, it got pushed back around 58 and 60. It’s now just a little way from that level.
But I remember last Monday, it climbed all the way to 60.2 just like this, then one bearish candle wiped out 7% in a day.
What I’m watching now isn’t how high it can go, but whether it can hold between 58 and 60.
Did you get in around 52.5, or are you like me, watching it climb and not daring to chase?
#Intel #INTC #美联储纪要放鹰,比特币继续承压 #英伟达董事会曝分歧,三名董事支持黄仁勋回归
On Tuesday night, I wrote about it: 55.30, dipping to 52.72. I said each new bottom was lower than the last, and each rebound weaker.
Then it did something a little different. On Wednesday during the day, it pulled back to around 53.5 without breaking below, then started inching up in the evening. Today it climbed steadily past 56. Now it’s Thursday, a little after 7:40 p.m., and it’s at 57.48.
From 52.49 (the lowest point marked on the chart), that’s up 9.5%. From the high of 62.79, it’s still 8.5% off.
For the first time this week, it’s showing this pattern: each pullback low is higher than the last—52.49, 53.5, and now it’s holding above 57. Last time, it got pushed back around 58 and 60. It’s now just a little way from that level.
But I remember last Monday, it climbed all the way to 60.2 just like this, then one bearish candle wiped out 7% in a day.
What I’m watching now isn’t how high it can go, but whether it can hold between 58 and 60.
Did you get in around 52.5, or are you like me, watching it climb and not daring to chase?
#Intel #INTC #美联储纪要放鹰,比特币继续承压 #英伟达董事会曝分歧,三名董事支持黄仁勋回归
2
788

·
--
INTC is no longer a one-sided story; the real point of interest is the divergence between bulls and bears.
Binance TradFi Perpetuals (traditional financial assets; elevated gap risk outside trading hours) | INTC is up 5.75% over the past 24 hours. At 2026-11-20 00:55:04 Beijing time, the price was about 56.86 (30m indicators use the 00:30 closing candle), with 24h trading volume of about 226 million; the 30m volume ratio was 9.1x, indicating rising participation. Flows: 83% of accounts are long; the taker buy/sell ratio is 1.09 (aggressive trading is nearly balanced); 30m open interest is down 0.5%.
Reference indicators: 30m KDJ 50.07/57.76/34.69; support and resistance: first watch the 56.06 / 59.53 levels. Near resistance, pay closer attention to whether there is a high-volume breakout or a pullback after a spike.
Focus on just two levels: can the taker buy/sell ratio of 1.09 hold above 1.10; and can the KDJ J value of 34.7 turn decisively in either direction? Two paths lie ahead: funds may step in and keep the rally going, or volume may fade as sentiment-driven gains are sold.
#INTC #UnusualMoveAlert
INTC is no longer a one-sided story; the real point of interest is the divergence between bulls and bears.
Binance TradFi Perpetuals (traditional financial assets; elevated gap risk outside trading hours) | INTC is up 5.75% over the past 24 hours. At 2026-11-20 00:55:04 Beijing time, the price was about 56.86 (30m indicators use the 00:30 closing candle), with 24h trading volume of about 226 million; the 30m volume ratio was 9.1x, indicating rising participation. Flows: 83% of accounts are long; the taker buy/sell ratio is 1.09 (aggressive trading is nearly balanced); 30m open interest is down 0.5%.
Reference indicators: 30m KDJ 50.07/57.76/34.69; support and resistance: first watch the 56.06 / 59.53 levels. Near resistance, pay closer attention to whether there is a high-volume breakout or a pullback after a spike.
Focus on just two levels: can the taker buy/sell ratio of 1.09 hold above 1.10; and can the KDJ J value of 34.7 turn decisively in either direction? Two paths lie ahead: funds may step in and keep the rally going, or volume may fade as sentiment-driven gains are sold.
#INTC #UnusualMoveAlert
Binance TradFi Perpetuals (traditional financial assets; elevated gap risk outside trading hours) | INTC is up 5.75% over the past 24 hours. At 2026-11-20 00:55:04 Beijing time, the price was about 56.86 (30m indicators use the 00:30 closing candle), with 24h trading volume of about 226 million; the 30m volume ratio was 9.1x, indicating rising participation. Flows: 83% of accounts are long; the taker buy/sell ratio is 1.09 (aggressive trading is nearly balanced); 30m open interest is down 0.5%.
Reference indicators: 30m KDJ 50.07/57.76/34.69; support and resistance: first watch the 56.06 / 59.53 levels. Near resistance, pay closer attention to whether there is a high-volume breakout or a pullback after a spike.
Focus on just two levels: can the taker buy/sell ratio of 1.09 hold above 1.10; and can the KDJ J value of 34.7 turn decisively in either direction? Two paths lie ahead: funds may step in and keep the rally going, or volume may fade as sentiment-driven gains are sold.
#INTC #UnusualMoveAlert
2
·
--
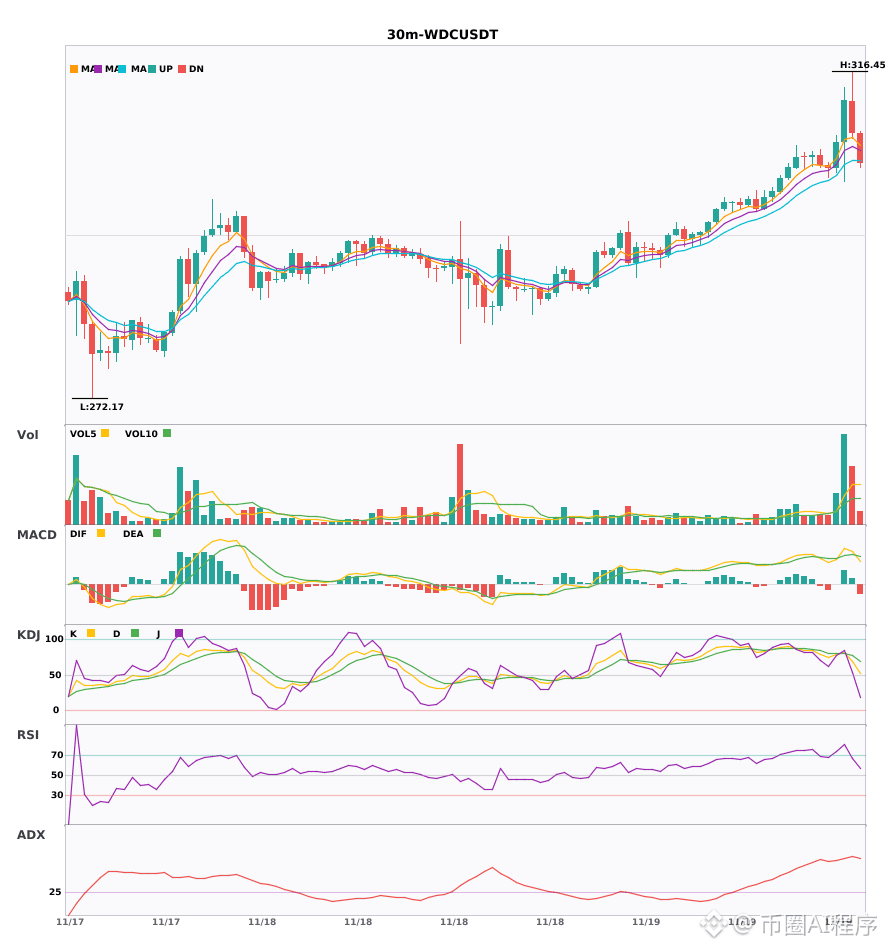
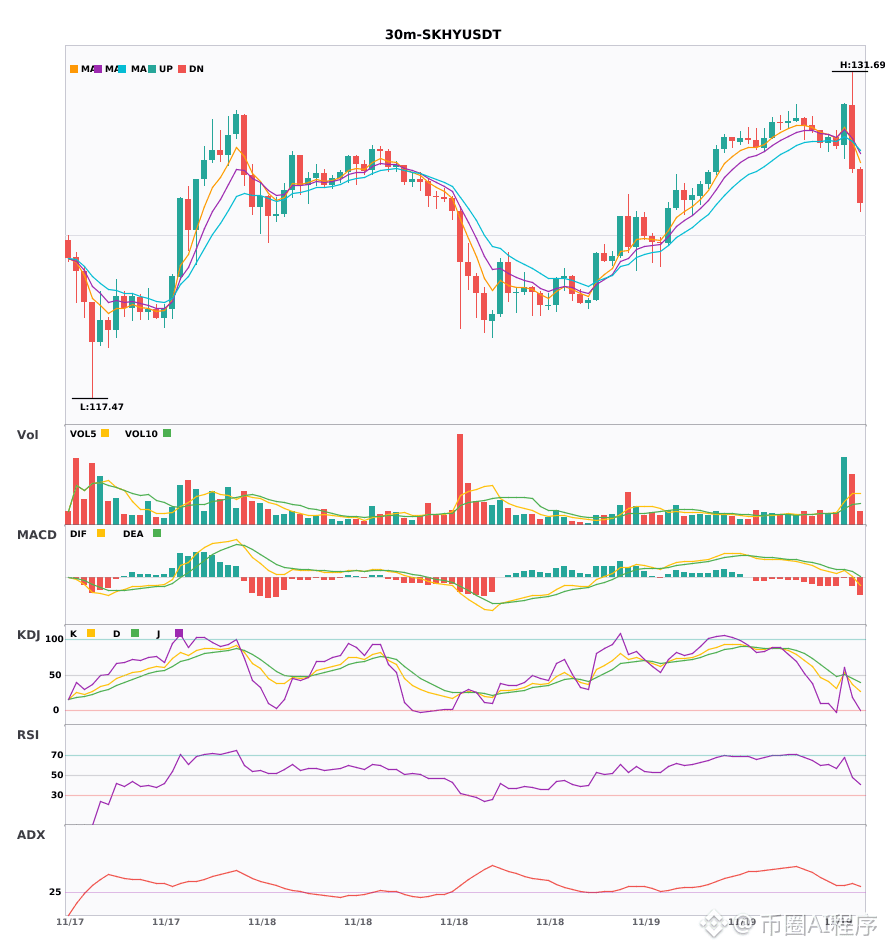
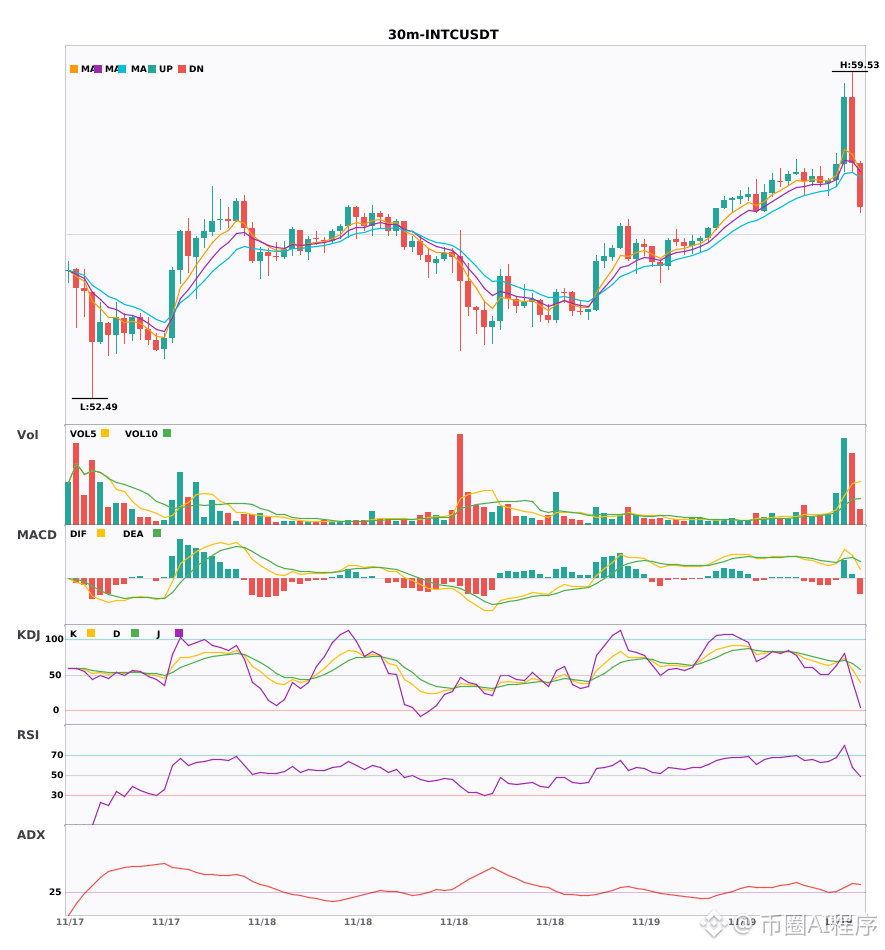
3 coins showing a bullish alignment diverging upward on the 30-minute and 4-hour charts, confirmed by a MACD golden cross and volume surge 🔥
════════════════════
🔴 $WDC 30-minute bullish signal
⚠️ Technical analysis: 4-hour bullish confluence confirmed, with a synchronized 30-minute entry signal! Volume surged after the MACD golden cross, and the red bars continue to grow; EMA5>8>13 are in a bullish alignment, diverging upward; KDJ's K line crossed above D, indicating a short-term bullish outlook. Volume surged 4.2x.
════════════════════
🔴 $SKHY 30-minute bullish signal
⚠️ Technical analysis: 4-hour bullish confluence confirmed! On the 30-minute chart, EMA5 has just crossed above EMA8, turning bullish. KDJ has formed a golden cross, with K crossing above D but not yet entering overbought territory. Volume surged 4x, with multiple timeframes aligning bullishly.
════════════════════
🔴 $INTC 30-minute bullish signal
⚠️ Technical analysis: 4-hour bullish trend + 30-minute confluence confirmed: MACD golden cross with rising volume, moving averages in a bullish alignment and trending upward, KDJ golden cross without overbought conditions, and a 4.3x volume surge. Bullish outlook.
════════════════════
🔔 Follow for the latest market movements 🔔
#多周期共振 #WDC #SKHY #INTC
📌 When trading, watch for confirmation from the candlestick pattern.
3 coins showing a bullish alignment diverging upward on the 30-minute and 4-hour charts, confirmed by a MACD golden cross and volume surge 🔥
════════════════════
🔴 $WDC 30-minute bullish signal
⚠️ Technical analysis: 4-hour bullish confluence confirmed, with a synchronized 30-minute entry signal! Volume surged after the MACD golden cross, and the red bars continue to grow; EMA5>8>13 are in a bullish alignment, diverging upward; KDJ's K line crossed above D, indicating a short-term bullish outlook. Volume surged 4.2x.
════════════════════
🔴 $SKHY 30-minute bullish signal
⚠️ Technical analysis: 4-hour bullish confluence confirmed! On the 30-minute chart, EMA5 has just crossed above EMA8, turning bullish. KDJ has formed a golden cross, with K crossing above D but not yet entering overbought territory. Volume surged 4x, with multiple timeframes aligning bullishly.
════════════════════
🔴 $INTC 30-minute bullish signal
⚠️ Technical analysis: 4-hour bullish trend + 30-minute confluence confirmed: MACD golden cross with rising volume, moving averages in a bullish alignment and trending upward, KDJ golden cross without overbought conditions, and a 4.3x volume surge. Bullish outlook.
════════════════════
🔔 Follow for the latest market movements 🔔
#多周期共振 #WDC #SKHY #INTC
📌 When trading, watch for confirmation from the candlestick pattern.
════════════════════
🔴 $WDC 30-minute bullish signal
⚠️ Technical analysis: 4-hour bullish confluence confirmed, with a synchronized 30-minute entry signal! Volume surged after the MACD golden cross, and the red bars continue to grow; EMA5>8>13 are in a bullish alignment, diverging upward; KDJ's K line crossed above D, indicating a short-term bullish outlook. Volume surged 4.2x.
════════════════════
🔴 $SKHY 30-minute bullish signal
⚠️ Technical analysis: 4-hour bullish confluence confirmed! On the 30-minute chart, EMA5 has just crossed above EMA8, turning bullish. KDJ has formed a golden cross, with K crossing above D but not yet entering overbought territory. Volume surged 4x, with multiple timeframes aligning bullishly.
════════════════════
🔴 $INTC 30-minute bullish signal
⚠️ Technical analysis: 4-hour bullish trend + 30-minute confluence confirmed: MACD golden cross with rising volume, moving averages in a bullish alignment and trending upward, KDJ golden cross without overbought conditions, and a 4.3x volume surge. Bullish outlook.
════════════════════
🔔 Follow for the latest market movements 🔔
#多周期共振 #WDC #SKHY #INTC
📌 When trading, watch for confirmation from the candlestick pattern.
13
·
--
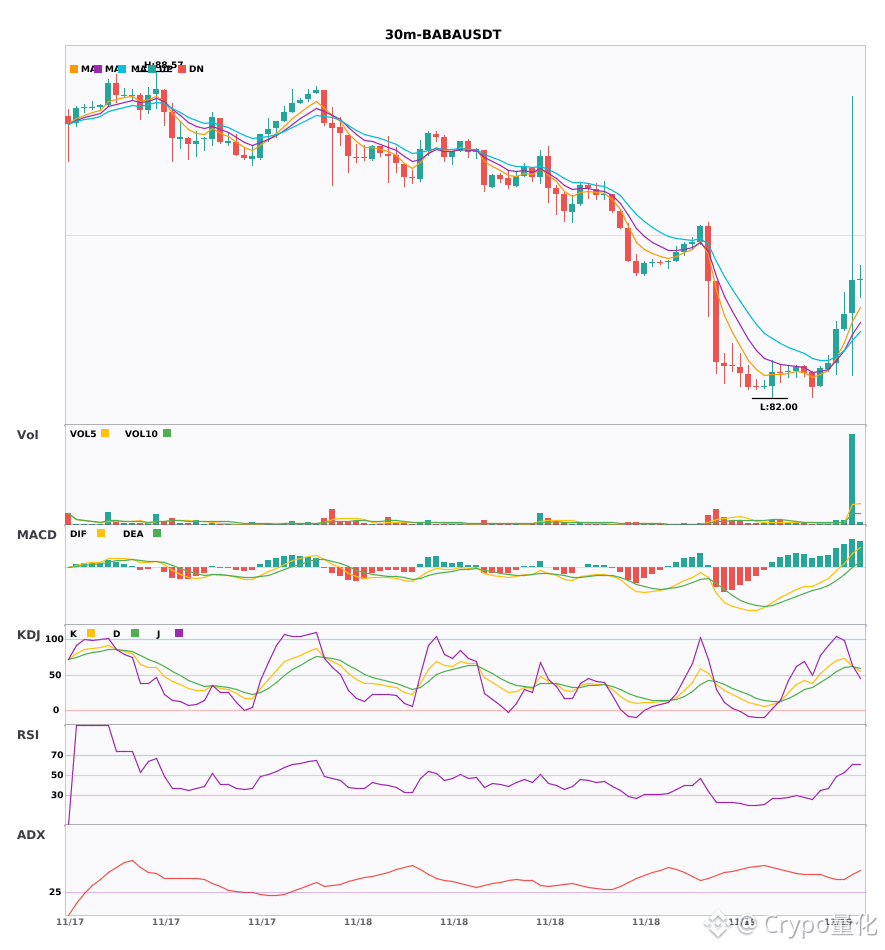
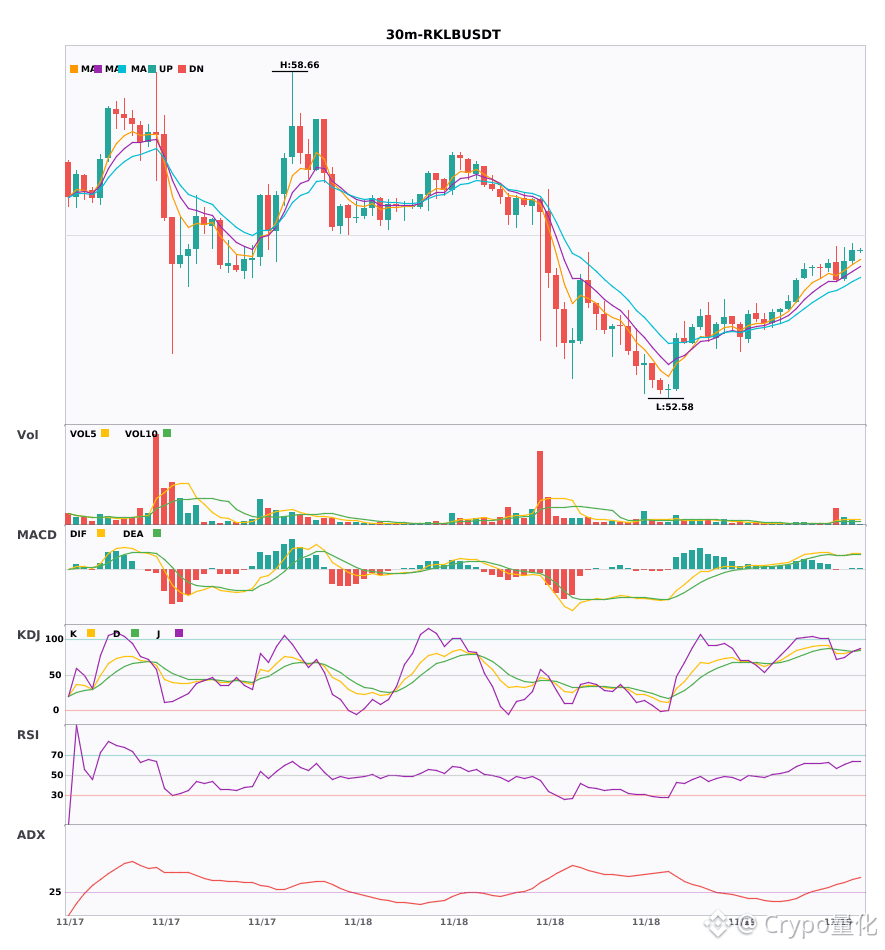
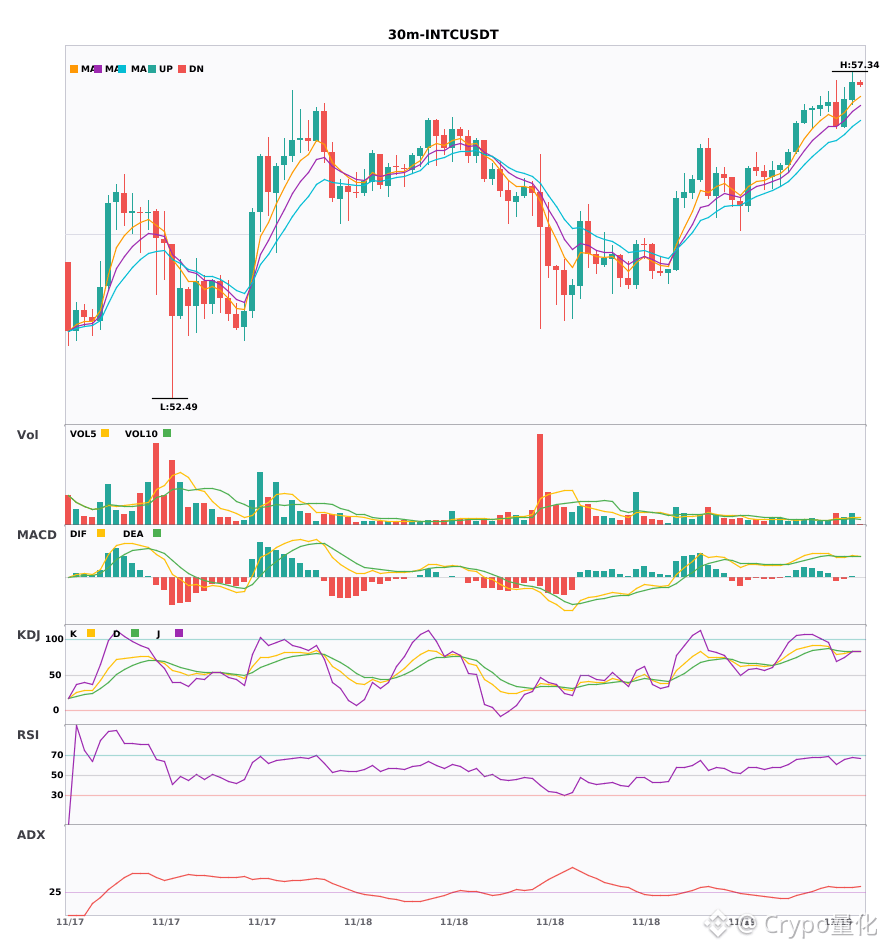
$BABA $RKLB $INTC 30-minute golden cross resonance, bullish signals are all in place 🔥
════════════════════
🔴 $BABA 30-minute bullish signal
⚠️Technical analysis: ADX 39, clear trend. MACD golden cross with increased volume, breaking above the zero line. Moving averages are converging and building momentum. KDJ favors strong bulls. Volume is up 1.8x.
════════════════════
🔴 $RKLB 30-minute bullish signal
⚠️Technical analysis: ADX above 46, an exceptionally strong trend—beware of a pullback from overbought conditions. MACD golden cross above zero with increased volume; the red bars are growing. Moving averages are in a bullish alignment, diverging upward. KDJ is in overbought territory, so watch for risk. Volume is up 2x.
════════════════════
🔴 $INTC 30-minute bullish signal
⚠️Technical analysis: ADX 33, a very strong trend. Volume increased after the MACD golden cross. Moving averages are in a bullish alignment, diverging upward. KDJ is overbought (K and D both at 83.3), so beware of a pullback. Volume is up 1.8x.
════════════════════
🔔 Follow for first-hand market alerts 🔔
#技术分析 #BABA #RKLB #INTC
📌 When trading, check whether the candlestick pattern confirms the signal
$BABA $RKLB $INTC 30-minute golden cross resonance, bullish signals are all in place 🔥
════════════════════
🔴 $BABA 30-minute bullish signal
⚠️Technical analysis: ADX 39, clear trend. MACD golden cross with increased volume, breaking above the zero line. Moving averages are converging and building momentum. KDJ favors strong bulls. Volume is up 1.8x.
════════════════════
🔴 $RKLB 30-minute bullish signal
⚠️Technical analysis: ADX above 46, an exceptionally strong trend—beware of a pullback from overbought conditions. MACD golden cross above zero with increased volume; the red bars are growing. Moving averages are in a bullish alignment, diverging upward. KDJ is in overbought territory, so watch for risk. Volume is up 2x.
════════════════════
🔴 $INTC 30-minute bullish signal
⚠️Technical analysis: ADX 33, a very strong trend. Volume increased after the MACD golden cross. Moving averages are in a bullish alignment, diverging upward. KDJ is overbought (K and D both at 83.3), so beware of a pullback. Volume is up 1.8x.
════════════════════
🔔 Follow for first-hand market alerts 🔔
#技术分析 #BABA #RKLB #INTC
📌 When trading, check whether the candlestick pattern confirms the signal
════════════════════
🔴 $BABA 30-minute bullish signal
⚠️Technical analysis: ADX 39, clear trend. MACD golden cross with increased volume, breaking above the zero line. Moving averages are converging and building momentum. KDJ favors strong bulls. Volume is up 1.8x.
════════════════════
🔴 $RKLB 30-minute bullish signal
⚠️Technical analysis: ADX above 46, an exceptionally strong trend—beware of a pullback from overbought conditions. MACD golden cross above zero with increased volume; the red bars are growing. Moving averages are in a bullish alignment, diverging upward. KDJ is in overbought territory, so watch for risk. Volume is up 2x.
════════════════════
🔴 $INTC 30-minute bullish signal
⚠️Technical analysis: ADX 33, a very strong trend. Volume increased after the MACD golden cross. Moving averages are in a bullish alignment, diverging upward. KDJ is overbought (K and D both at 83.3), so beware of a pullback. Volume is up 1.8x.
════════════════════
🔔 Follow for first-hand market alerts 🔔
#技术分析 #BABA #RKLB #INTC
📌 When trading, check whether the candlestick pattern confirms the signal
3
·
--
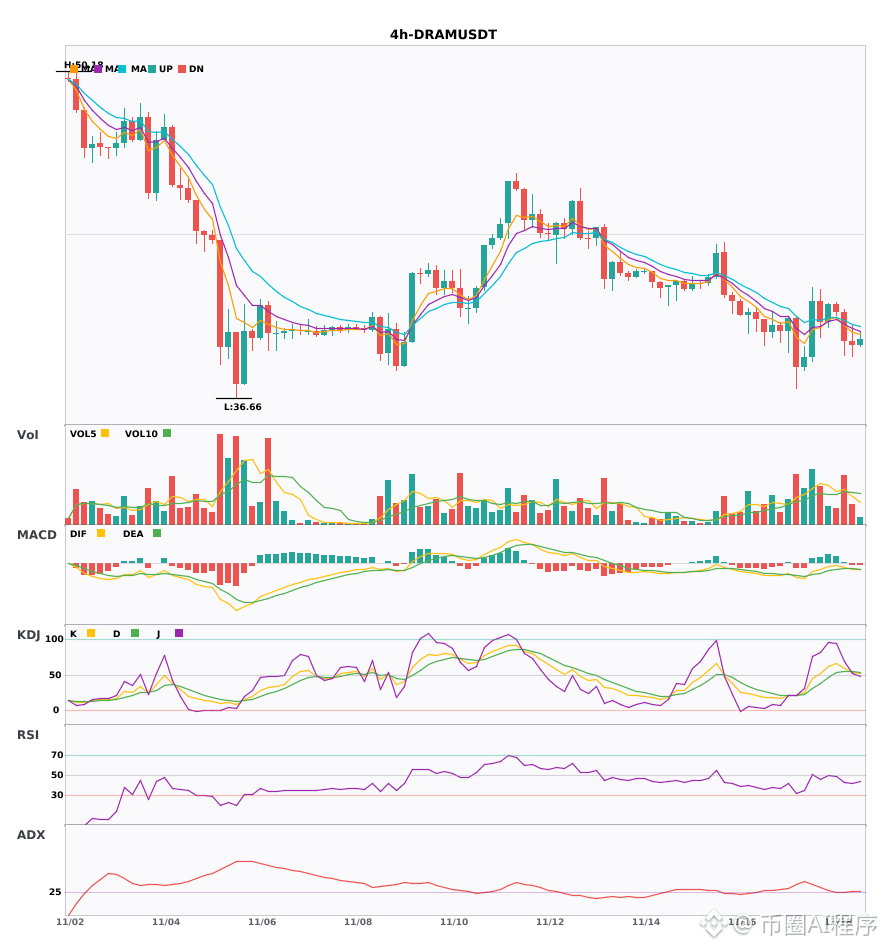
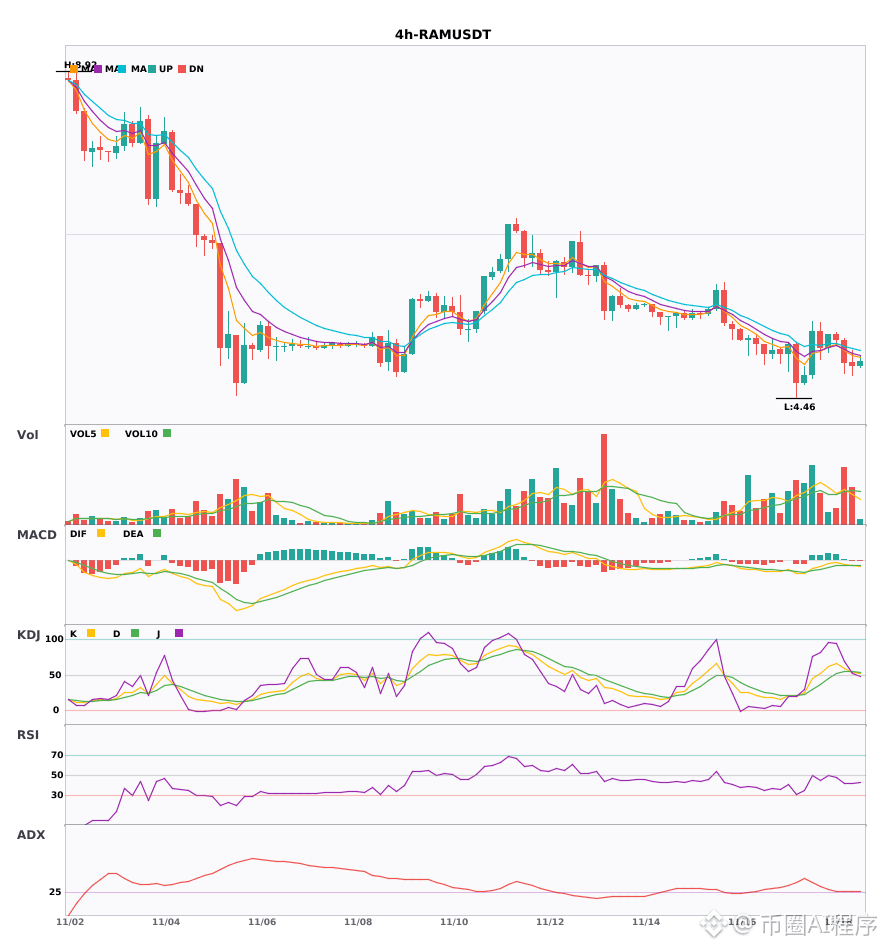
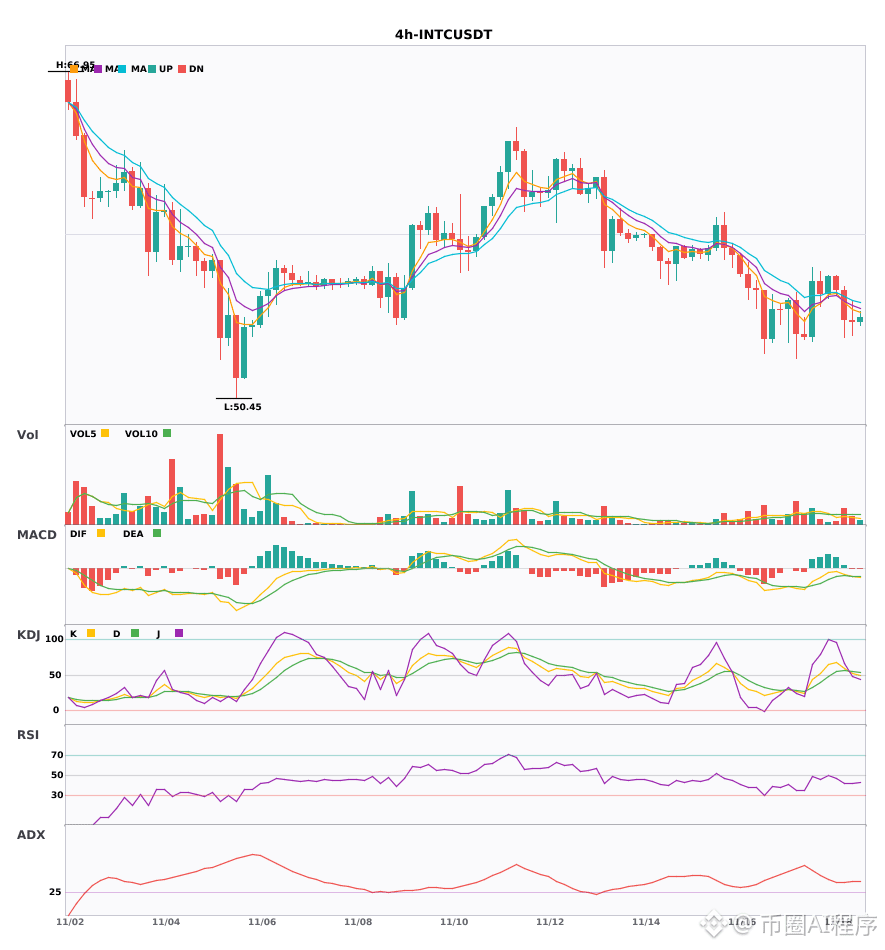
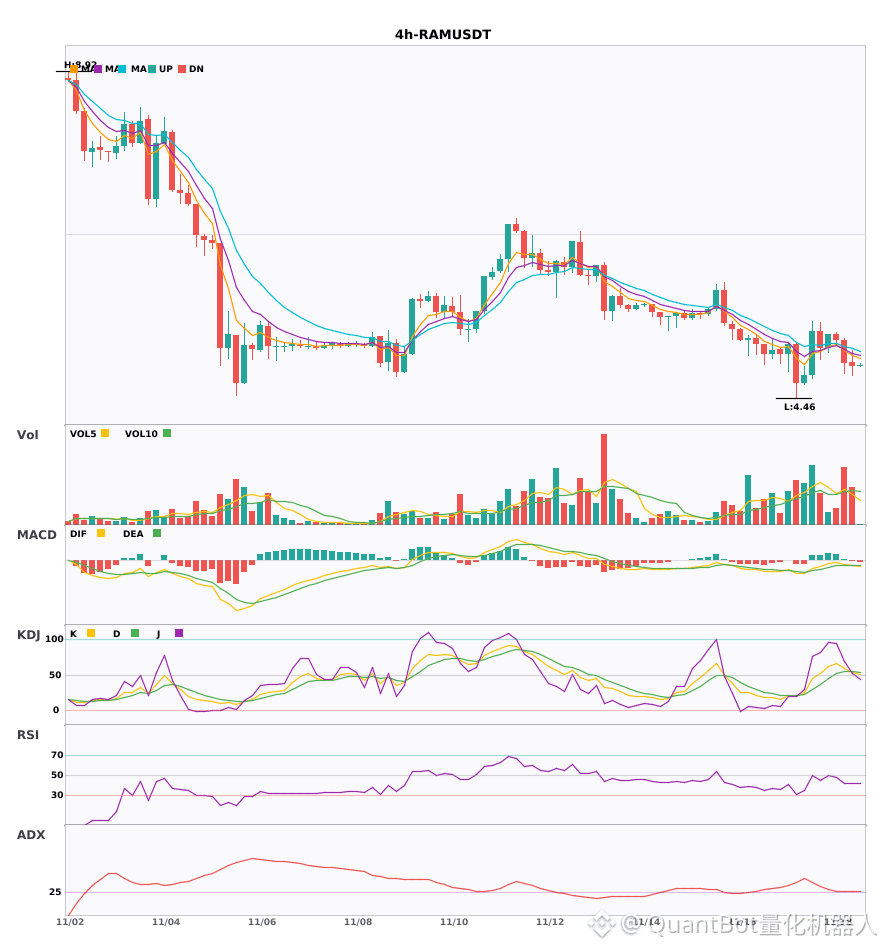
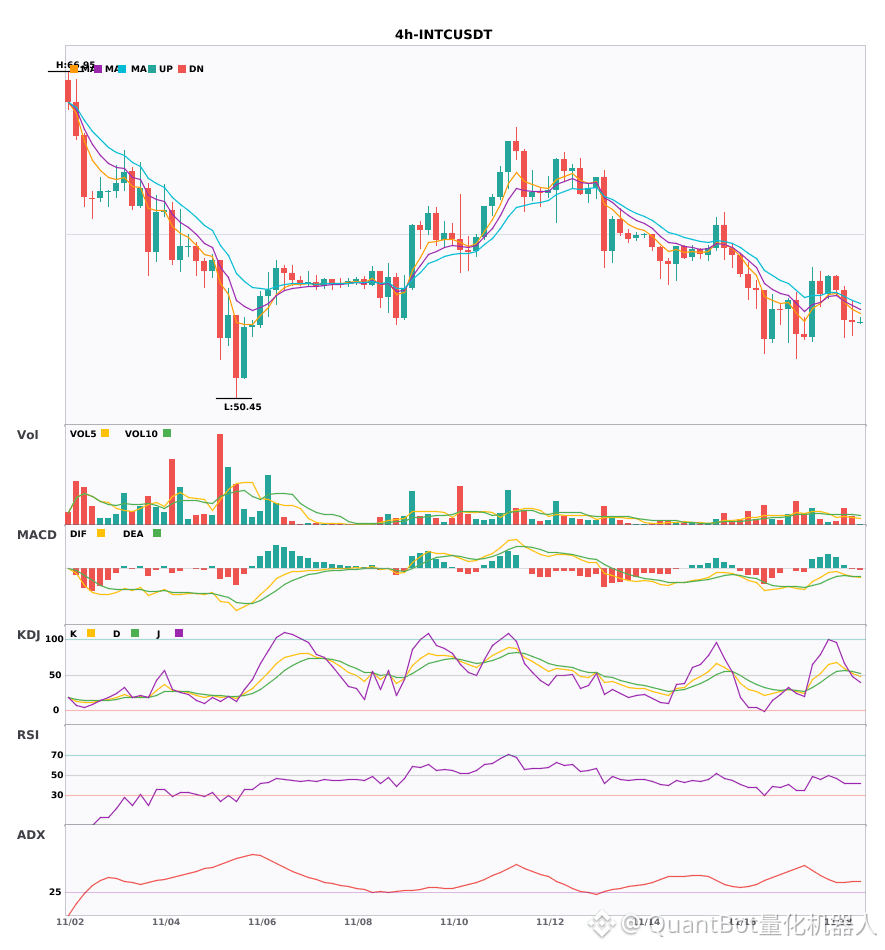
$DRAM $RAM $INTC Daily bearish trend confirmed; 4-hour chart still weakening 🔥
════════════════════
🟢 $DRAM 4-hour bearish signal
⚠️Technical analysis: 4-hour entry + daily bearish trend confirmed by confluence! MACD death cross, green bars expanding; moving averages bearishly aligned and diverging downward; KDJ death cross, not yet oversold; volume up 1.5x. Short-term outlook is bearish.
════════════════════
🟢 $RAM 4-hour bearish signal
⚠️Technical analysis: Multi-timeframe confluence: 4-hour + daily charts both bearish! MACD death cross, bearish momentum accelerating; moving averages bearishly aligned and diverging; KDJ death cross, not oversold; volume up 1.7x.
════════════════════
🟢 $INTC 4-hour bearish signal
⚠️Technical analysis: Daily and 4-hour bearish trends confirmed by confluence. MACD death cross, green bars continuing to expand; moving averages bearishly aligned and diverging downward; KDJ death cross, not oversold; volume up 1.6x. Favor the trend and stay bearish.
════════════════════
🔔 Follow for first-hand market updates 🔔
#多周期共振 #DRAM #RAM #INTC
📌 When trading, pay attention to whether the candlestick pattern meets the criteria
$DRAM $RAM $INTC Daily bearish trend confirmed; 4-hour chart still weakening 🔥
════════════════════
🟢 $DRAM 4-hour bearish signal
⚠️Technical analysis: 4-hour entry + daily bearish trend confirmed by confluence! MACD death cross, green bars expanding; moving averages bearishly aligned and diverging downward; KDJ death cross, not yet oversold; volume up 1.5x. Short-term outlook is bearish.
════════════════════
🟢 $RAM 4-hour bearish signal
⚠️Technical analysis: Multi-timeframe confluence: 4-hour + daily charts both bearish! MACD death cross, bearish momentum accelerating; moving averages bearishly aligned and diverging; KDJ death cross, not oversold; volume up 1.7x.
════════════════════
🟢 $INTC 4-hour bearish signal
⚠️Technical analysis: Daily and 4-hour bearish trends confirmed by confluence. MACD death cross, green bars continuing to expand; moving averages bearishly aligned and diverging downward; KDJ death cross, not oversold; volume up 1.6x. Favor the trend and stay bearish.
════════════════════
🔔 Follow for first-hand market updates 🔔
#多周期共振 #DRAM #RAM #INTC
📌 When trading, pay attention to whether the candlestick pattern meets the criteria
════════════════════
🟢 $DRAM 4-hour bearish signal
⚠️Technical analysis: 4-hour entry + daily bearish trend confirmed by confluence! MACD death cross, green bars expanding; moving averages bearishly aligned and diverging downward; KDJ death cross, not yet oversold; volume up 1.5x. Short-term outlook is bearish.
════════════════════
🟢 $RAM 4-hour bearish signal
⚠️Technical analysis: Multi-timeframe confluence: 4-hour + daily charts both bearish! MACD death cross, bearish momentum accelerating; moving averages bearishly aligned and diverging; KDJ death cross, not oversold; volume up 1.7x.
════════════════════
🟢 $INTC 4-hour bearish signal
⚠️Technical analysis: Daily and 4-hour bearish trends confirmed by confluence. MACD death cross, green bars continuing to expand; moving averages bearishly aligned and diverging downward; KDJ death cross, not oversold; volume up 1.6x. Favor the trend and stay bearish.
════════════════════
🔔 Follow for first-hand market updates 🔔
#多周期共振 #DRAM #RAM #INTC
📌 When trading, pay attention to whether the candlestick pattern meets the criteria
6
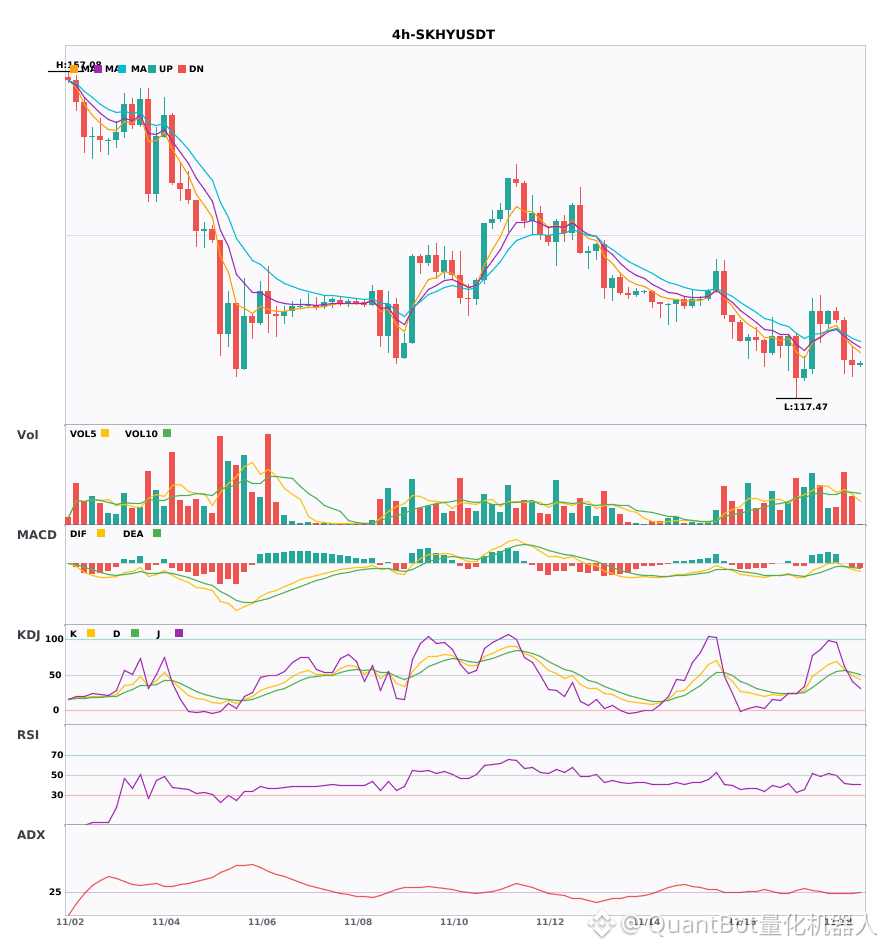
$SKHY/$RAM/$INTC 4H Bearish Confluence Signal Triggered
📉 $SKHY | 4-hour Bearish Signal
━━━━━━━━━━━━━━━━━━
Technical Analysis: ADX(26) trend established, entry possible; MACD bearish crossover below zero, bearish momentum accelerating; EMA5<EMA8<EMA13 bearish alignment; KDJ bearish crossover, short-term outlook bearish (K 49.4 D 54.0); volume increased 1.6x.
Price Change: -0.4500%
📉 $RAM | 4-hour Bearish Signal
━━━━━━━━━━━━━━━━━━
Technical Analysis: ADX(28) trend emerging, entry possible; MACD bearish crossover below zero, bearish momentum accelerating; EMAs in bearish alignment; KDJ bearish crossover, short-term bias bearish (K53.9/D54.6); volume increased 1.7x.
Price Change: -0.8900%
📉 $INTC | 4-hour Bearish Signal
━━━━━━━━━━━━━━━━━━
Technical Analysis: ADX36 confirms the trend; MACD bearish crossover below zero, bearish momentum accelerating; EMAs in bearish alignment; KDJ bearish crossover (K52.5/D54.9), bearish bias; volume increased 1.6x.
Price Change: -0.2200%
━━━━━━━━━━━━━━━━━━
#技术分析 #SKHY #RAM #INTC
📌 The above is for reference only and does not constitute investment advice
$SKHY /$RAM /$INTC 4H Bearish Confluence Signal Triggered
📉 $SKHY | 4-hour Bearish Signal
━━━━━━━━━━━━━━━━━━
Technical Analysis: ADX(26) trend established, entry possible; MACD bearish crossover below zero, bearish momentum accelerating; EMA5<EMA8<EMA13 bearish alignment; KDJ bearish crossover, short-term outlook bearish (K 49.4 D 54.0); volume increased 1.6x.
Price Change: -0.4500%
📉 $RAM | 4-hour Bearish Signal
━━━━━━━━━━━━━━━━━━
Technical Analysis: ADX(28) trend emerging, entry possible; MACD bearish crossover below zero, bearish momentum accelerating; EMAs in bearish alignment; KDJ bearish crossover, short-term bias bearish (K53.9/D54.6); volume increased 1.7x.
Price Change: -0.8900%
📉 $INTC | 4-hour Bearish Signal
━━━━━━━━━━━━━━━━━━
Technical Analysis: ADX36 confirms the trend; MACD bearish crossover below zero, bearish momentum accelerating; EMAs in bearish alignment; KDJ bearish crossover (K52.5/D54.9), bearish bias; volume increased 1.6x.
Price Change: -0.2200%
━━━━━━━━━━━━━━━━━━
#技术分析 #SKHY #RAM #INTC
📌 The above is for reference only and does not constitute investment advice
📉 $SKHY | 4-hour Bearish Signal
━━━━━━━━━━━━━━━━━━
Technical Analysis: ADX(26) trend established, entry possible; MACD bearish crossover below zero, bearish momentum accelerating; EMA5<EMA8<EMA13 bearish alignment; KDJ bearish crossover, short-term outlook bearish (K 49.4 D 54.0); volume increased 1.6x.
Price Change: -0.4500%
📉 $RAM | 4-hour Bearish Signal
━━━━━━━━━━━━━━━━━━
Technical Analysis: ADX(28) trend emerging, entry possible; MACD bearish crossover below zero, bearish momentum accelerating; EMAs in bearish alignment; KDJ bearish crossover, short-term bias bearish (K53.9/D54.6); volume increased 1.7x.
Price Change: -0.8900%
📉 $INTC | 4-hour Bearish Signal
━━━━━━━━━━━━━━━━━━
Technical Analysis: ADX36 confirms the trend; MACD bearish crossover below zero, bearish momentum accelerating; EMAs in bearish alignment; KDJ bearish crossover (K52.5/D54.9), bearish bias; volume increased 1.6x.
Price Change: -0.2200%
━━━━━━━━━━━━━━━━━━
#技术分析 #SKHY #RAM #INTC
📌 The above is for reference only and does not constitute investment advice
5
·
--
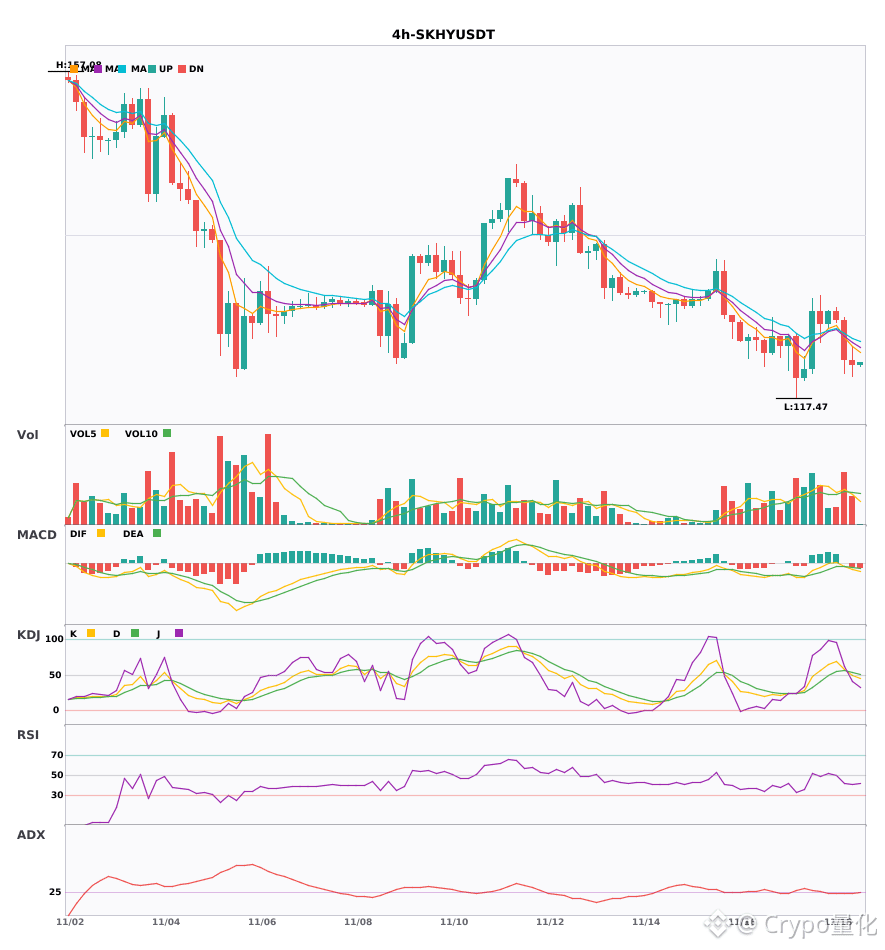
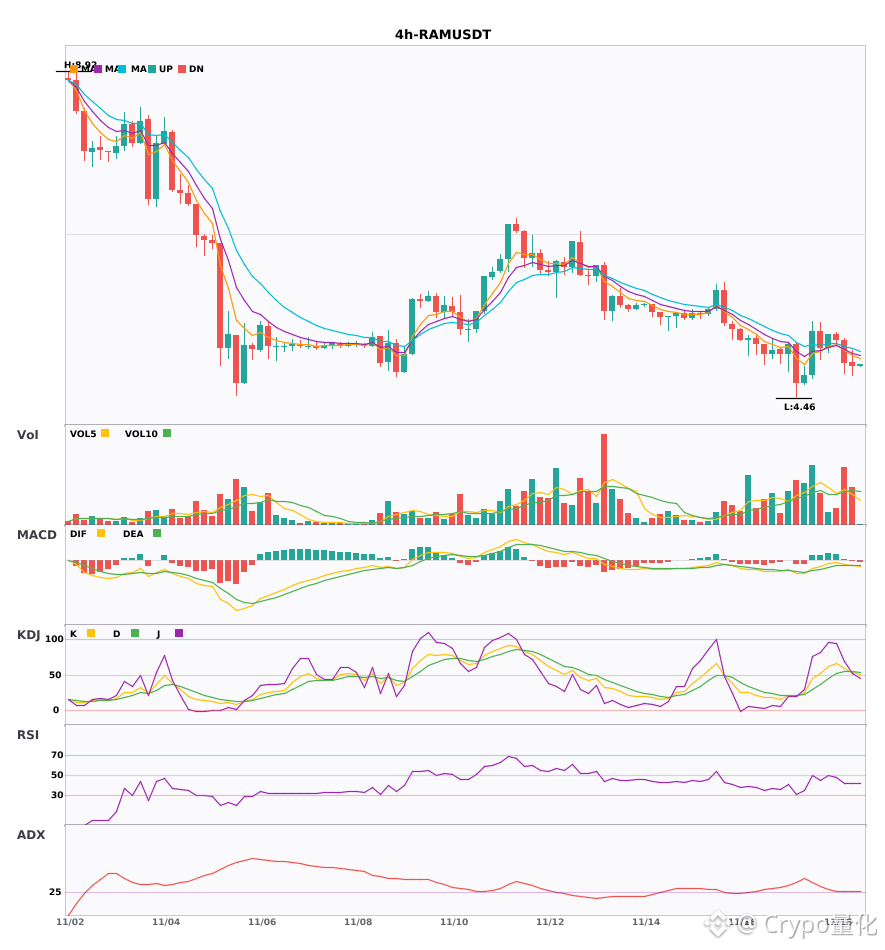
$SKHY $RAM $INTC 4-hour timeframe: bearish signals across the board; be cautious about going long 🔥
════════════════════
🟢 $SKHY 4-hour bearish signal
⚠️Technical analysis: The ADX trend has just formed and can be followed; the MACD death cross and expanding green bars show bearish momentum accelerating; moving averages are diverging downward in bearish alignment; the KDJ death cross has not yet reached the oversold zone, so the short-term bias is bearish; trading volume is up about 1.6x.
════════════════════
🟢 $RAM 4-hour bearish signal
⚠️Technical analysis: The trend is forming and can be followed; the MACD death cross signals accelerating bearish momentum; moving averages are in bearish alignment; the KDJ death cross indicates a bearish outlook; trading volume is up 1.7x.
════════════════════
🟢 $INTC 4-hour bearish signal
⚠️Technical analysis: ADX is at 36, indicating a clear trend; the MACD death cross below zero signals accelerating bearish momentum; moving averages are in bearish alignment; the KDJ death cross indicates a bearish outlook; volume is up 1.6x.
════════════════════
🔔 Follow to get the latest market alerts 🔔
#技术分析 #SKHY #RAM #INTC
📌 When trading, pay attention to whether the candlestick pattern matches.
$SKHY $RAM $INTC 4-hour timeframe: bearish signals across the board; be cautious about going long 🔥
════════════════════
🟢 $SKHY 4-hour bearish signal
⚠️Technical analysis: The ADX trend has just formed and can be followed; the MACD death cross and expanding green bars show bearish momentum accelerating; moving averages are diverging downward in bearish alignment; the KDJ death cross has not yet reached the oversold zone, so the short-term bias is bearish; trading volume is up about 1.6x.
════════════════════
🟢 $RAM 4-hour bearish signal
⚠️Technical analysis: The trend is forming and can be followed; the MACD death cross signals accelerating bearish momentum; moving averages are in bearish alignment; the KDJ death cross indicates a bearish outlook; trading volume is up 1.7x.
════════════════════
🟢 $INTC 4-hour bearish signal
⚠️Technical analysis: ADX is at 36, indicating a clear trend; the MACD death cross below zero signals accelerating bearish momentum; moving averages are in bearish alignment; the KDJ death cross indicates a bearish outlook; volume is up 1.6x.
════════════════════
🔔 Follow to get the latest market alerts 🔔
#技术分析 #SKHY #RAM #INTC
📌 When trading, pay attention to whether the candlestick pattern matches.
════════════════════
🟢 $SKHY 4-hour bearish signal
⚠️Technical analysis: The ADX trend has just formed and can be followed; the MACD death cross and expanding green bars show bearish momentum accelerating; moving averages are diverging downward in bearish alignment; the KDJ death cross has not yet reached the oversold zone, so the short-term bias is bearish; trading volume is up about 1.6x.
════════════════════
🟢 $RAM 4-hour bearish signal
⚠️Technical analysis: The trend is forming and can be followed; the MACD death cross signals accelerating bearish momentum; moving averages are in bearish alignment; the KDJ death cross indicates a bearish outlook; trading volume is up 1.7x.
════════════════════
🟢 $INTC 4-hour bearish signal
⚠️Technical analysis: ADX is at 36, indicating a clear trend; the MACD death cross below zero signals accelerating bearish momentum; moving averages are in bearish alignment; the KDJ death cross indicates a bearish outlook; volume is up 1.6x.
════════════════════
🔔 Follow to get the latest market alerts 🔔
#技术分析 #SKHY #RAM #INTC
📌 When trading, pay attention to whether the candlestick pattern matches.
2
·
--
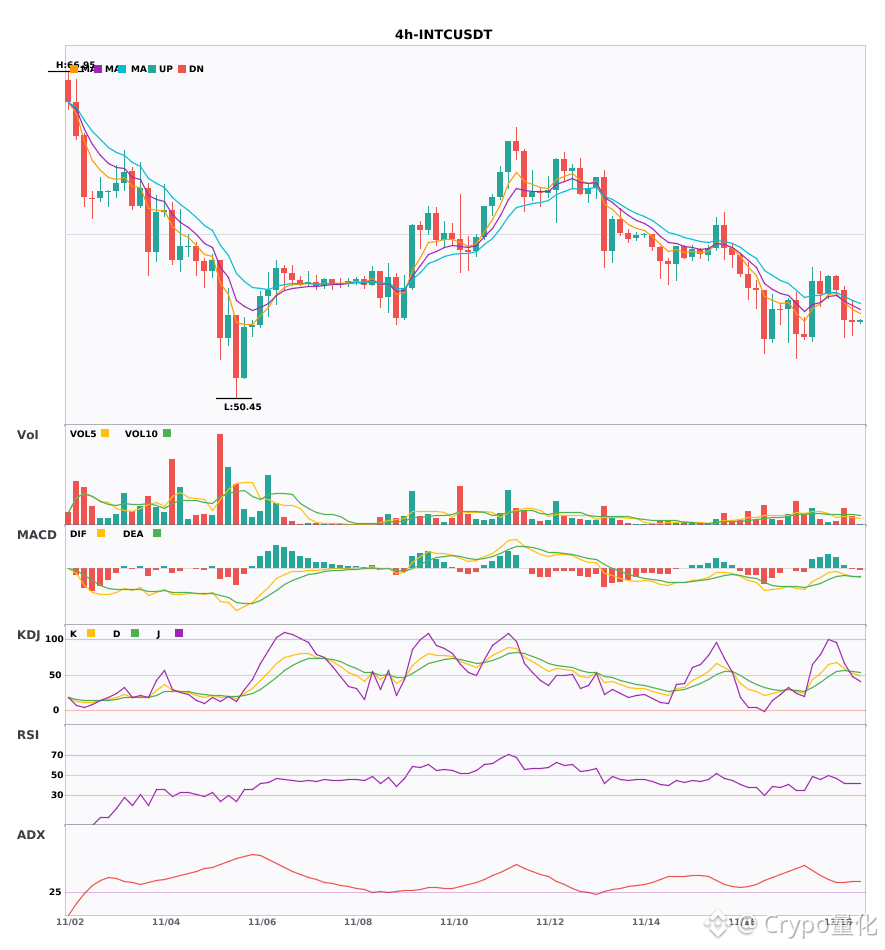
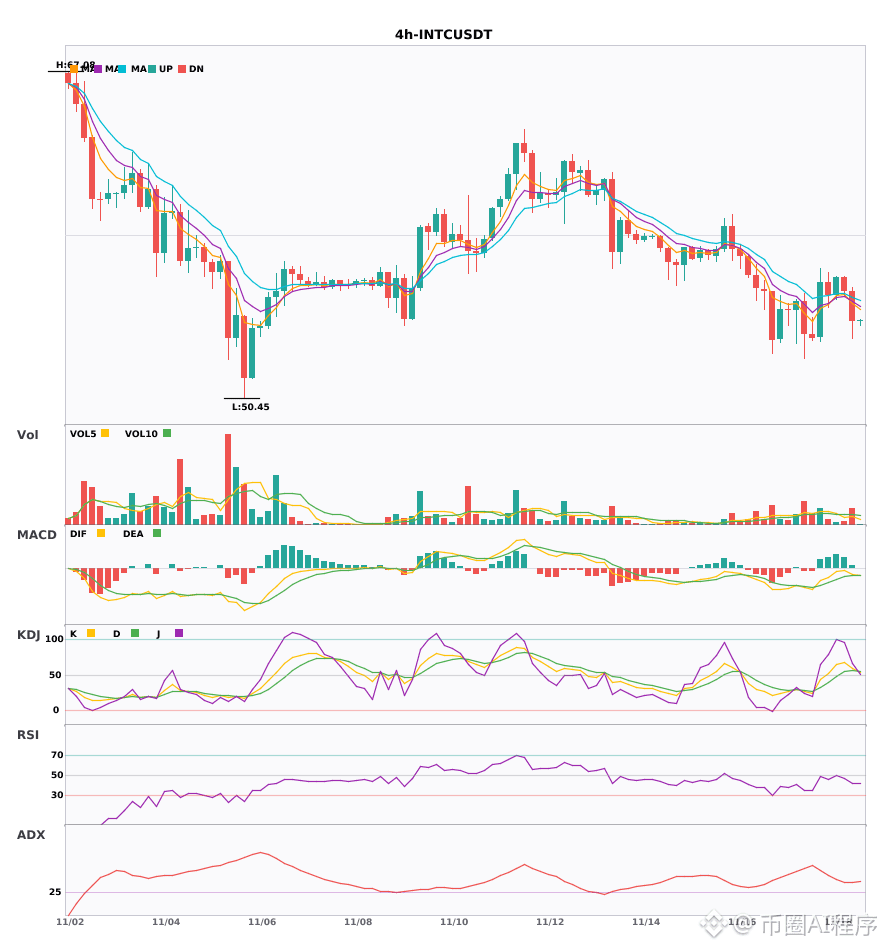
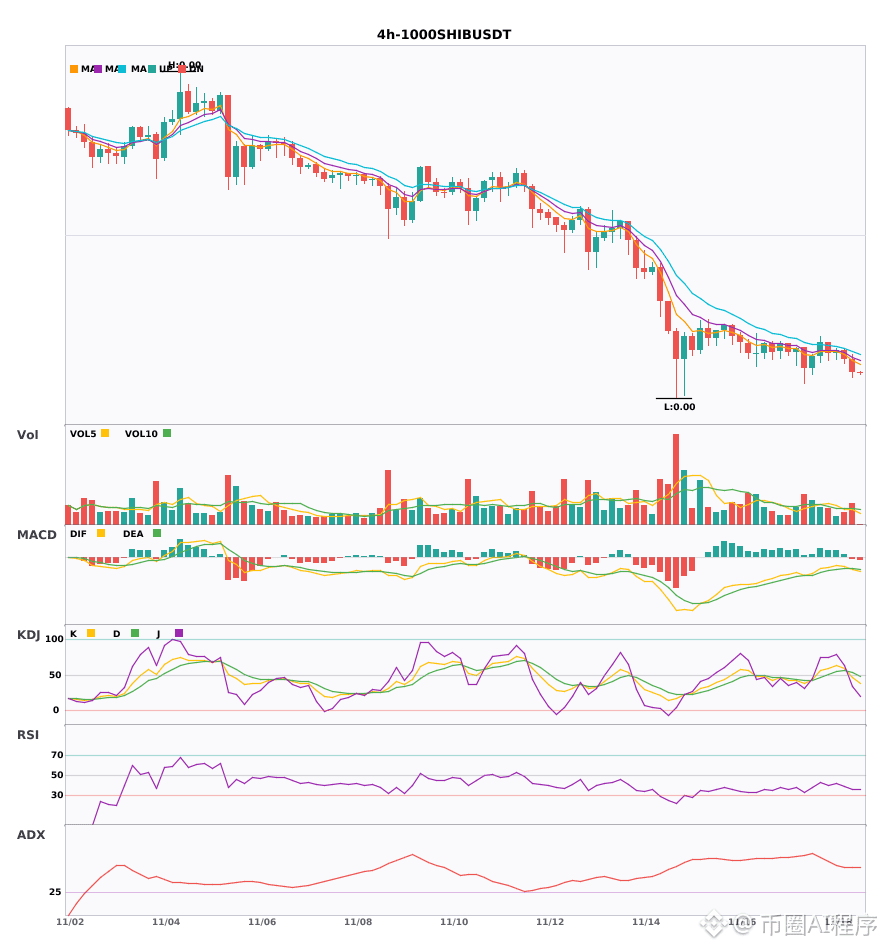
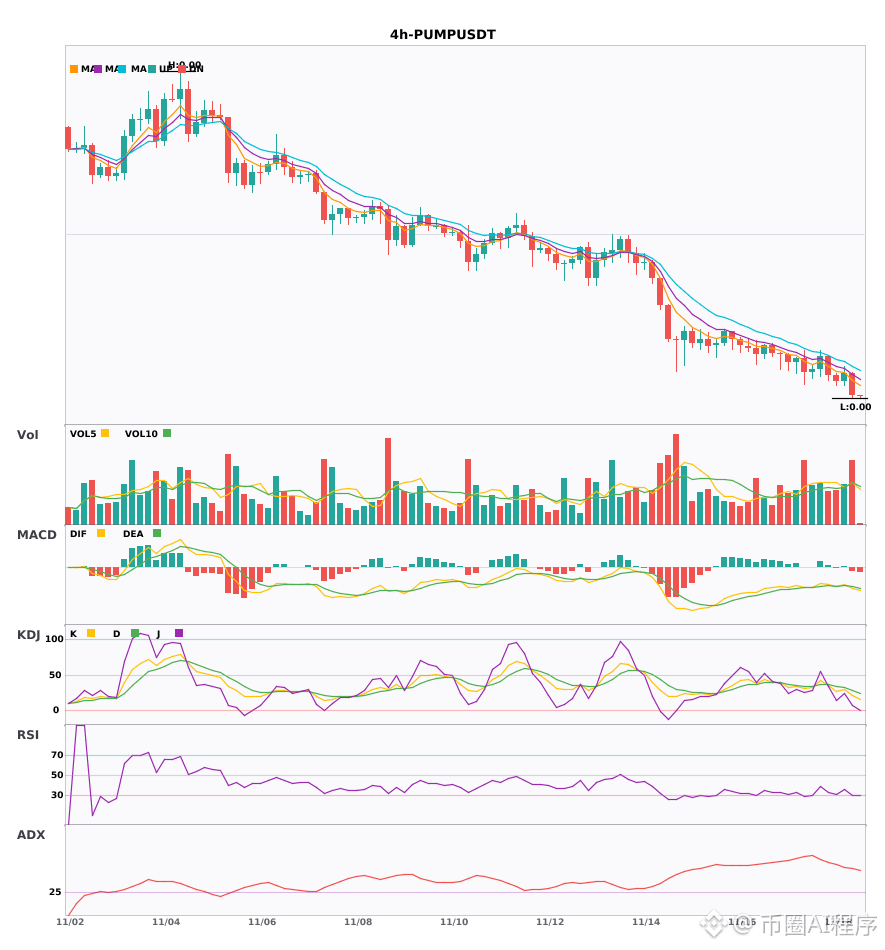
$INTC/$1000SHIB/$PUMP 4-hour and daily charts all turn bearish 🔥
════════════════════
🟢 $INTC 4-hour bearish signal
⚠️Technical analysis: Daily and 4-hour bearish confluence confirmed! The 4-hour EMA5 crossed below EMA8, signaling a short-term bearish turn, with volume up 1.6x. K in the KDJ crossed above D but hasn't entered the overbought zone.
════════════════════
🟢 $1000SHIB 4-hour bearish signal
⚠️Technical analysis: Multi-timeframe confluence! 4-hour and daily bearish signals confirmed. MACD formed a bearish cross below zero with rising volume; moving averages are bearishly aligned. KDJ formed a bearish cross but hasn't entered the oversold zone. Short-term outlook is bearish.
════════════════════
🟢 $PUMP 4-hour bearish signal
⚠️Technical analysis: Multi-timeframe confluence for a short: 4-hour MACD formed a bearish cross below zero, accelerating the decline; moving averages are bearishly aligned and diverging; KDJ crossed below D, signaling weakness. Volume is up 1.5x, and daily bearish confluence is confirmed.
════════════════════
🔔 Follow to get real-time market alerts 🔔
#多周期共振 #INTC #1000SHIB #PUMP
📌 When trading, pay attention to whether the candlestick patterns align
$INTC /$1000SHIB/$PUMP 4-hour and daily charts all turn bearish 🔥
════════════════════
🟢 $INTC 4-hour bearish signal
⚠️Technical analysis: Daily and 4-hour bearish confluence confirmed! The 4-hour EMA5 crossed below EMA8, signaling a short-term bearish turn, with volume up 1.6x. K in the KDJ crossed above D but hasn't entered the overbought zone.
════════════════════
🟢 $1000SHIB 4-hour bearish signal
⚠️Technical analysis: Multi-timeframe confluence! 4-hour and daily bearish signals confirmed. MACD formed a bearish cross below zero with rising volume; moving averages are bearishly aligned. KDJ formed a bearish cross but hasn't entered the oversold zone. Short-term outlook is bearish.
════════════════════
🟢 $PUMP 4-hour bearish signal
⚠️Technical analysis: Multi-timeframe confluence for a short: 4-hour MACD formed a bearish cross below zero, accelerating the decline; moving averages are bearishly aligned and diverging; KDJ crossed below D, signaling weakness. Volume is up 1.5x, and daily bearish confluence is confirmed.
════════════════════
🔔 Follow to get real-time market alerts 🔔
#多周期共振 #INTC #1000SHIB #PUMP
📌 When trading, pay attention to whether the candlestick patterns align
════════════════════
🟢 $INTC 4-hour bearish signal
⚠️Technical analysis: Daily and 4-hour bearish confluence confirmed! The 4-hour EMA5 crossed below EMA8, signaling a short-term bearish turn, with volume up 1.6x. K in the KDJ crossed above D but hasn't entered the overbought zone.
════════════════════
🟢 $1000SHIB 4-hour bearish signal
⚠️Technical analysis: Multi-timeframe confluence! 4-hour and daily bearish signals confirmed. MACD formed a bearish cross below zero with rising volume; moving averages are bearishly aligned. KDJ formed a bearish cross but hasn't entered the oversold zone. Short-term outlook is bearish.
════════════════════
🟢 $PUMP 4-hour bearish signal
⚠️Technical analysis: Multi-timeframe confluence for a short: 4-hour MACD formed a bearish cross below zero, accelerating the decline; moving averages are bearishly aligned and diverging; KDJ crossed below D, signaling weakness. Volume is up 1.5x, and daily bearish confluence is confirmed.
════════════════════
🔔 Follow to get real-time market alerts 🔔
#多周期共振 #INTC #1000SHIB #PUMP
📌 When trading, pay attention to whether the candlestick patterns align
15
·
--
#INTC $INTC 🔴 INTC-4-hour-trend-following short
• Real-time price: 54.39
• Signal type: MiX trend signal
• Instrument: Intel stock
SunspotAlgo @ 00:00:03 UTC+8
#INTC $INTC 🔴 INTC-4-hour-trend-following short
• Real-time price: 54.39
• Signal type: MiX trend signal
• Instrument: Intel stock
SunspotAlgo @ 00:00:03 UTC+8
• Real-time price: 54.39
• Signal type: MiX trend signal
• Instrument: Intel stock
SunspotAlgo @ 00:00:03 UTC+8
37
·
--
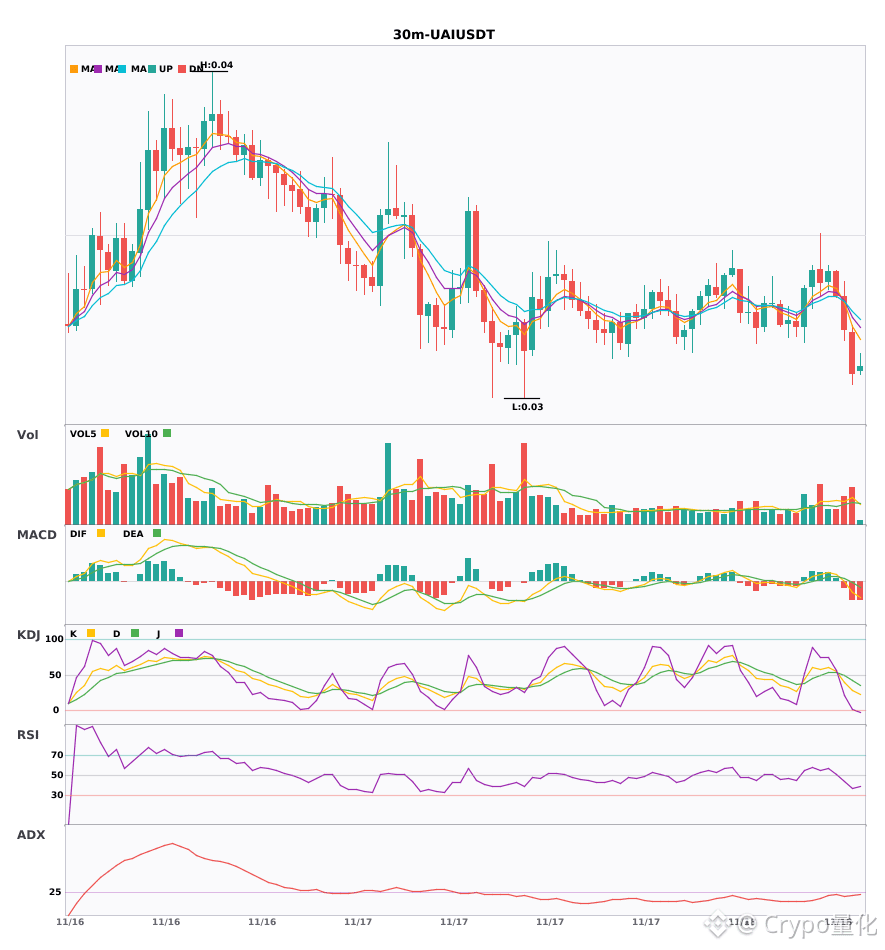
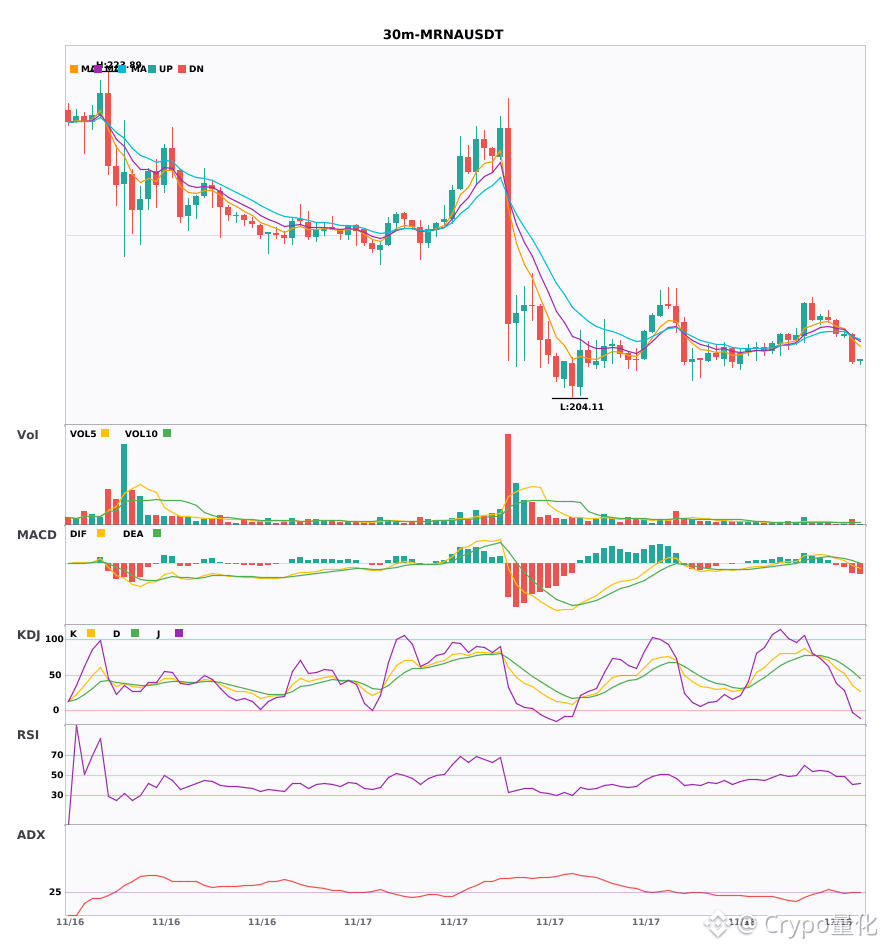
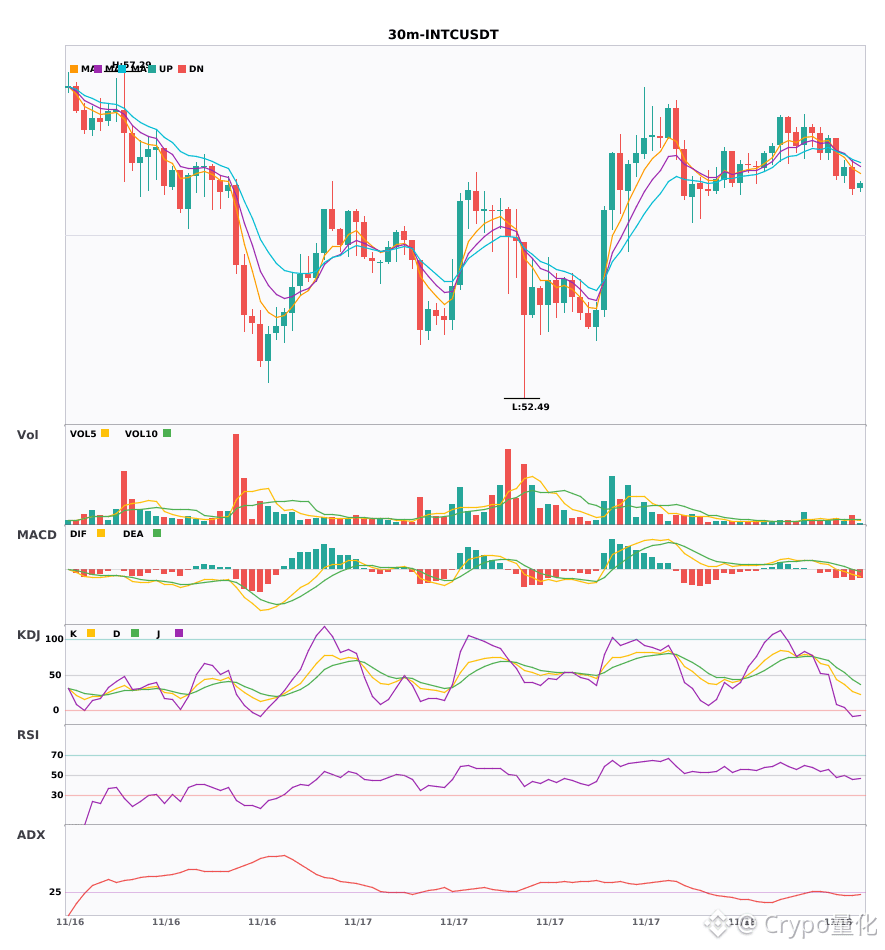
$UAI/$MRNA/$INTC 30-minute signals all turn bearish—signals firing across the board 🔥
════════════════════
🟢 $UAI 30-minute bearish signal
⚠️Technical analysis: The ADX trend has just formed, so this may be a good entry; MACD green bars are expanding, indicating strengthening momentum; moving averages are bearishly aligned and trending downward; on KDJ, K has crossed below D but is not yet oversold; trading volume is 1.7x higher.
════════════════════
🟢 $MRNA 30-minute bearish signal
⚠️Technical analysis: ADX indicates the trend is just starting, so this may be a good entry; however, MACD's DIF has fallen below the zero line, turning bearish; EMA5 has crossed below EMA8, suggesting a bearish short-term bias; trading volume is 1.7x higher.
════════════════════
🟢 $INTC 30-minute bearish signal
⚠️Technical analysis: The ADX trend has just formed, so this may be a good entry; bearish MACD momentum is strengthening; the moving averages have just formed a bearish alignment; bears have the upper hand on KDJ, and K has not yet crossed above D; trading volume is 1.6x higher.
════════════════════
🔔 Follow for first-hand market alerts 🔔
#技术分析 #UAI #MRNA #INTC
📌 When trading, pay attention to whether the candlestick pattern confirms the signal
$UAI /$MRNA /$INTC 30-minute signals all turn bearish—signals firing across the board 🔥
════════════════════
🟢 $UAI 30-minute bearish signal
⚠️Technical analysis: The ADX trend has just formed, so this may be a good entry; MACD green bars are expanding, indicating strengthening momentum; moving averages are bearishly aligned and trending downward; on KDJ, K has crossed below D but is not yet oversold; trading volume is 1.7x higher.
════════════════════
🟢 $MRNA 30-minute bearish signal
⚠️Technical analysis: ADX indicates the trend is just starting, so this may be a good entry; however, MACD's DIF has fallen below the zero line, turning bearish; EMA5 has crossed below EMA8, suggesting a bearish short-term bias; trading volume is 1.7x higher.
════════════════════
🟢 $INTC 30-minute bearish signal
⚠️Technical analysis: The ADX trend has just formed, so this may be a good entry; bearish MACD momentum is strengthening; the moving averages have just formed a bearish alignment; bears have the upper hand on KDJ, and K has not yet crossed above D; trading volume is 1.6x higher.
════════════════════
🔔 Follow for first-hand market alerts 🔔
#技术分析 #UAI #MRNA #INTC
📌 When trading, pay attention to whether the candlestick pattern confirms the signal
════════════════════
🟢 $UAI 30-minute bearish signal
⚠️Technical analysis: The ADX trend has just formed, so this may be a good entry; MACD green bars are expanding, indicating strengthening momentum; moving averages are bearishly aligned and trending downward; on KDJ, K has crossed below D but is not yet oversold; trading volume is 1.7x higher.
════════════════════
🟢 $MRNA 30-minute bearish signal
⚠️Technical analysis: ADX indicates the trend is just starting, so this may be a good entry; however, MACD's DIF has fallen below the zero line, turning bearish; EMA5 has crossed below EMA8, suggesting a bearish short-term bias; trading volume is 1.7x higher.
════════════════════
🟢 $INTC 30-minute bearish signal
⚠️Technical analysis: The ADX trend has just formed, so this may be a good entry; bearish MACD momentum is strengthening; the moving averages have just formed a bearish alignment; bears have the upper hand on KDJ, and K has not yet crossed above D; trading volume is 1.6x higher.
════════════════════
🔔 Follow for first-hand market alerts 🔔
#技术分析 #UAI #MRNA #INTC
📌 When trading, pay attention to whether the candlestick pattern confirms the signal
32
Log in to explore more content
Join global crypto users on Binance Square
⚡️ Get latest and useful information about crypto.
💬 Trusted by the world’s largest crypto exchange.
👍 Discover real insights from verified creators.
Email / Phone number
Trending Topics
1
#NvidiaLoses$2.7TrillionInMonthAndAHalf
16,477 views
114 Discussing
2
#CanBTCReboundAfterFallingBelow60K?
746,379 views
2,945 Discussing
3
#GlobalStocksFaceLongestLosingStreakSince2023
265,205 views
1,972 Discussing
4
#BlackRockIBITPostsRecord$541MSingleDayOutflow
30,570 views
88 Discussing
5
#AnthropicPlungesTowardIPOPriceonDay2
134,831 views
1,196 Discussing
6
#TwentyOneCapitalAdds172.25BTC
61,462 views
652 Discussing
7
#HKBillWouldExcludeTokenizedDepositsFromVirtualAssets
7,591 views
50 Discussing
8
#BNBDropsBelow540USDTWith8.46%DailyDecline
74,156 views
642 Discussing
9
#HKBillProposesHK$100KFineForUnauthorizedCryptoTitles
2,490 views
22 Discussing
10
#BitMineFaces$10.1BUnrealizedETHLoss
5,188 views
28 Discussing