
#36
36
34,748 views
125 Discussing
Hot
Latest

·
--
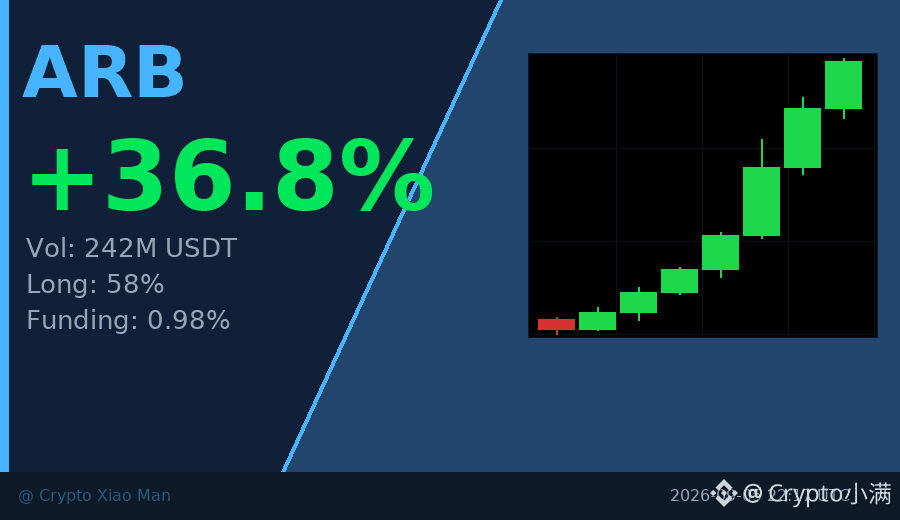
36% single-day gain, ARB is not just following the move this time.
$240 million in trading volume pushed the price from 0.128 to 0.178, and the hourly chart closed with three consecutive bullish candles. A funding rate of 0.98% is not extreme, but a 58% long ratio shows most people are already on board.
What’s interesting is that volume was denser at lower levels than at higher ones—$130 million was absorbed in the 0.14 to 0.15 range, and the 0.16 breakout alone saw $370 million. This isn’t a test; it’s real money changing hands.
In the short term, the key is whether 0.18 can hold. If it breaks the previous high of 0.181, there will be room to talk about more upside.
$ARB #Layer2 #36%涨幅
Click the card below to quickly check the market👇
36% single-day gain, ARB is not just following the move this time.
$240 million in trading volume pushed the price from 0.128 to 0.178, and the hourly chart closed with three consecutive bullish candles. A funding rate of 0.98% is not extreme, but a 58% long ratio shows most people are already on board.
What’s interesting is that volume was denser at lower levels than at higher ones—$130 million was absorbed in the 0.14 to 0.15 range, and the 0.16 breakout alone saw $370 million. This isn’t a test; it’s real money changing hands.
In the short term, the key is whether 0.18 can hold. If it breaks the previous high of 0.181, there will be room to talk about more upside.
$ARB #Layer2 #36%涨幅
Click the card below to quickly check the market👇
$240 million in trading volume pushed the price from 0.128 to 0.178, and the hourly chart closed with three consecutive bullish candles. A funding rate of 0.98% is not extreme, but a 58% long ratio shows most people are already on board.
What’s interesting is that volume was denser at lower levels than at higher ones—$130 million was absorbed in the 0.14 to 0.15 range, and the 0.16 breakout alone saw $370 million. This isn’t a test; it’s real money changing hands.
In the short term, the key is whether 0.18 can hold. If it breaks the previous high of 0.181, there will be room to talk about more upside.
$ARB #Layer2 #36%涨幅
Click the card below to quickly check the market👇
116
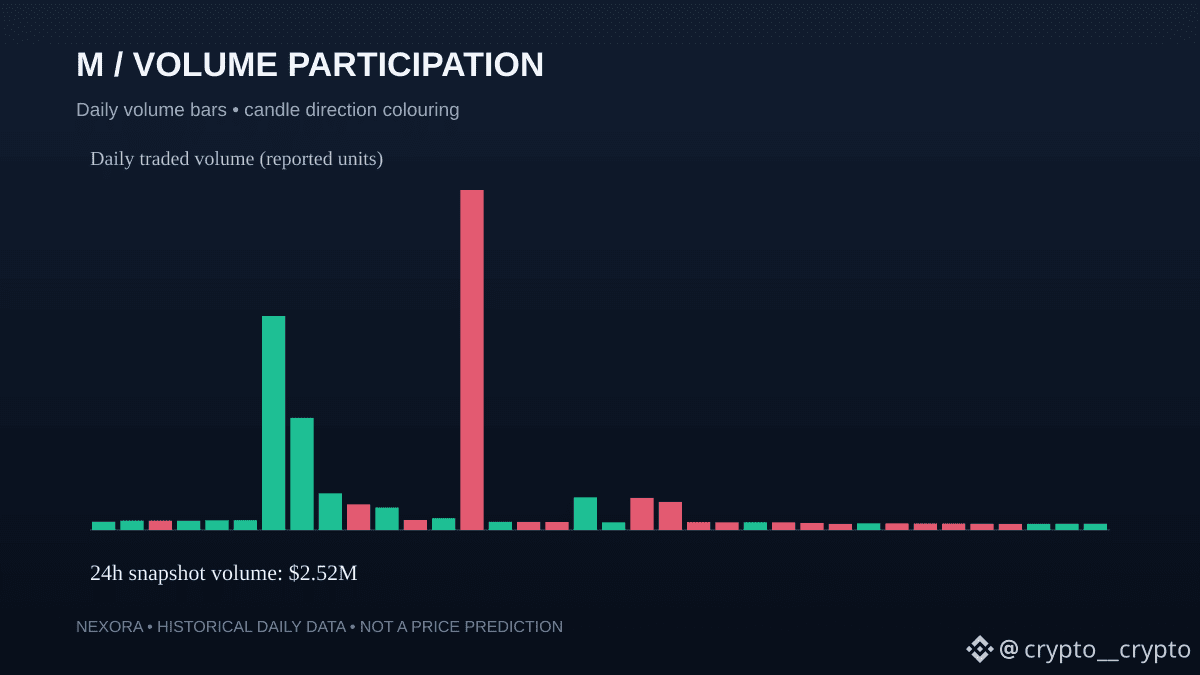
The latest M candle gives a more specific read than the percentage alone.
CMC rank #36. The quoted price is $0.88502527, with a 24-hour change of +0.02%.
Reported 24-hour volume is $2.52M and market capitalization is $2.03B.
The current move is relatively contained; the daily structure matters more than the headline percentage.
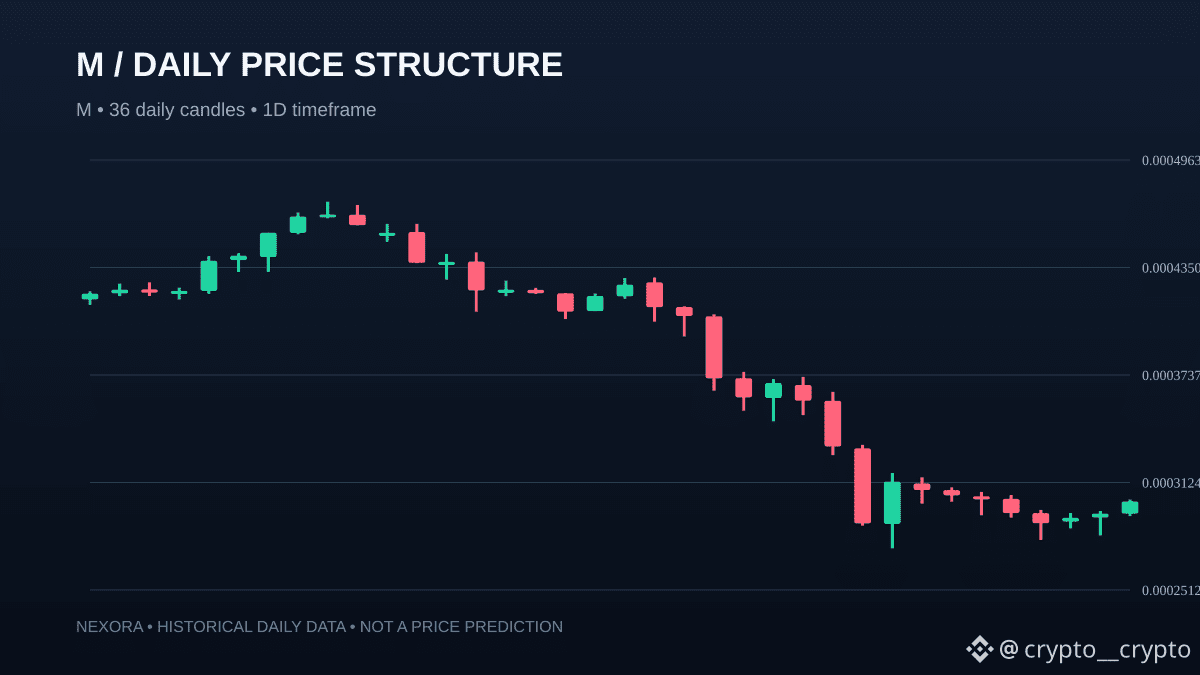
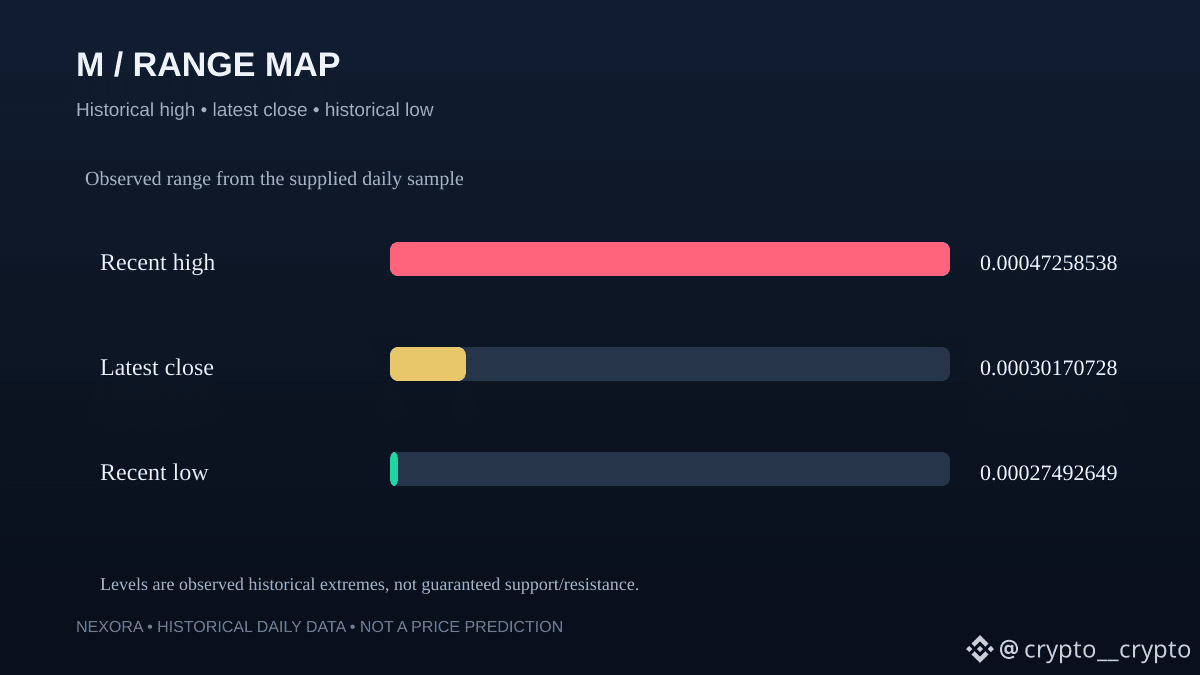
The latest daily candle ranges from $0.0002933295 to $0.00030280181 (3.23%). Its close changed +2.36% versus the previous candle.
Across the displayed sample, the latest close is 27.62% below the first candle's open.
What to watch next: whether the next daily close confirms or rejects this range, and whether volume expands with the move. These observations describe the supplied data, not a prediction.
Market data: CoinMarketCap snapshot; daily OHLCV: CoinLore.
Research commentary only; not financial advice.
$M #Crypto #NEXORA
The latest M candle gives a more specific read than the percentage alone.
CMC rank #36. The quoted price is $0.88502527, with a 24-hour change of +0.02%.
Reported 24-hour volume is $2.52M and market capitalization is $2.03B.
The current move is relatively contained; the daily structure matters more than the headline percentage.
The latest daily candle ranges from $0.0002933295 to $0.00030280181 (3.23%). Its close changed +2.36% versus the previous candle.
Across the displayed sample, the latest close is 27.62% below the first candle's open.
What to watch next: whether the next daily close confirms or rejects this range, and whether volume expands with the move. These observations describe the supplied data, not a prediction.
Market data: CoinMarketCap snapshot; daily OHLCV: CoinLore.
Research commentary only; not financial advice.
$M #Crypto #NEXORA
CMC rank #36. The quoted price is $0.88502527, with a 24-hour change of +0.02%.
Reported 24-hour volume is $2.52M and market capitalization is $2.03B.
The current move is relatively contained; the daily structure matters more than the headline percentage.
The latest daily candle ranges from $0.0002933295 to $0.00030280181 (3.23%). Its close changed +2.36% versus the previous candle.
Across the displayed sample, the latest close is 27.62% below the first candle's open.
What to watch next: whether the next daily close confirms or rejects this range, and whether volume expands with the move. These observations describe the supplied data, not a prediction.
Market data: CoinMarketCap snapshot; daily OHLCV: CoinLore.
Research commentary only; not financial advice.
$M #Crypto #NEXORA
3


·
--
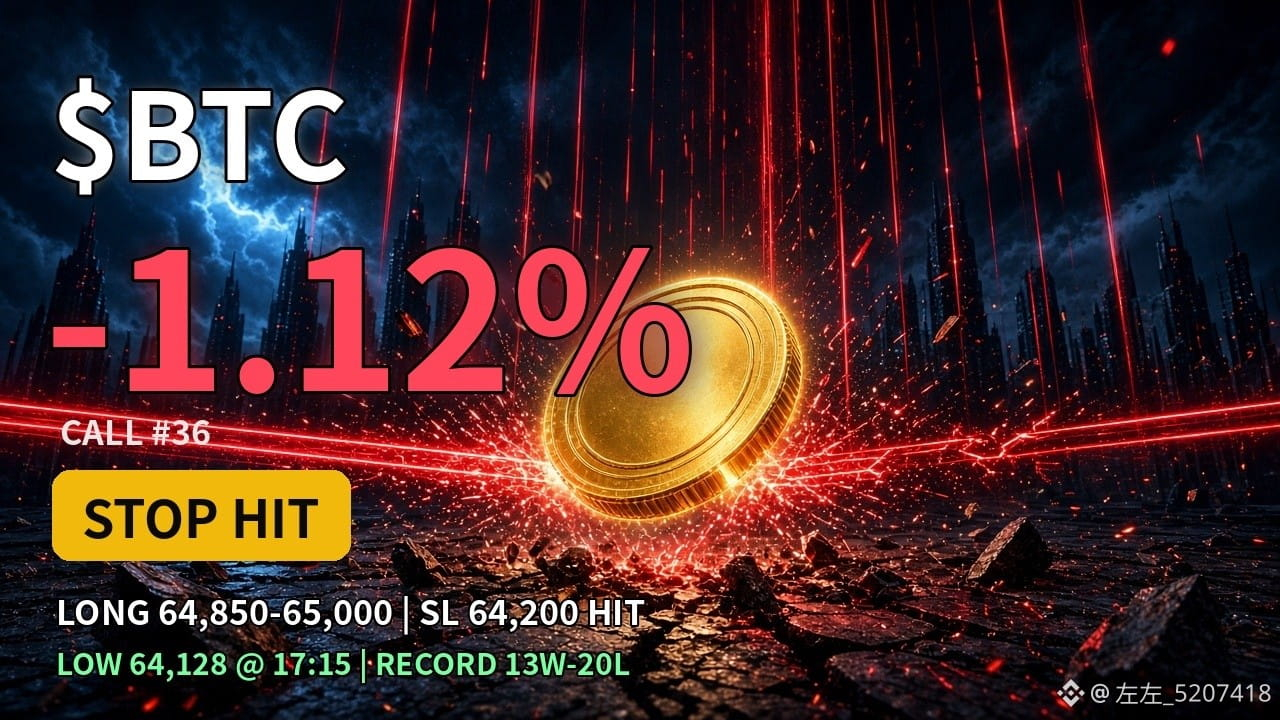
【ZuoZuo’s Trade Idea · Review】😤 BTC long entry filled on the pullback, stop-loss hit—taking the loss!
#36 BTC long: Entry 64,850–65,000, stop-loss 64,200, TP1 65,700 / TP2 66,100
This morning at 10:51, the pullback to 65,000 filled. After opening the position, the price peaked at 65,362.01 (10:39)—still short of TP1.
At 17:15, a 1-minute candle dipped to 64,128, hitting the 64,200 stop-loss.
Result: -1.12% (based on the median entry price of 64,925, without leverage); record: 13 wins, 20 losses.
At the time of posting, BTC was at 64,344, down 2.0% over 24H (Binance spot).
I share losing trades too. Support around 64,257–64,530 didn’t hold, so the bullish thesis was invalidated—I’m not stubbornly holding on.
After your stop-loss gets hit, do you wait and see, or wait for the price to reclaim 64,500 before re-entering?
#BTC #左左观点单 #币安广场
$BTC
{future}(BTCUSDT)
【ZuoZuo’s Trade Idea · Review】😤 BTC long entry filled on the pullback, stop-loss hit—taking the loss!
#36 BTC long: Entry 64,850–65,000, stop-loss 64,200, TP1 65,700 / TP2 66,100
This morning at 10:51, the pullback to 65,000 filled. After opening the position, the price peaked at 65,362.01 (10:39)—still short of TP1.
At 17:15, a 1-minute candle dipped to 64,128, hitting the 64,200 stop-loss.
Result: -1.12% (based on the median entry price of 64,925, without leverage); record: 13 wins, 20 losses.
At the time of posting, BTC was at 64,344, down 2.0% over 24H (Binance spot).
I share losing trades too. Support around 64,257–64,530 didn’t hold, so the bullish thesis was invalidated—I’m not stubbornly holding on.
After your stop-loss gets hit, do you wait and see, or wait for the price to reclaim 64,500 before re-entering?
#BTC #左左观点单 #币安广场
$BTC
#36 BTC long: Entry 64,850–65,000, stop-loss 64,200, TP1 65,700 / TP2 66,100
This morning at 10:51, the pullback to 65,000 filled. After opening the position, the price peaked at 65,362.01 (10:39)—still short of TP1.
At 17:15, a 1-minute candle dipped to 64,128, hitting the 64,200 stop-loss.
Result: -1.12% (based on the median entry price of 64,925, without leverage); record: 13 wins, 20 losses.
At the time of posting, BTC was at 64,344, down 2.0% over 24H (Binance spot).
I share losing trades too. Support around 64,257–64,530 didn’t hold, so the bullish thesis was invalidated—I’m not stubbornly holding on.
After your stop-loss gets hit, do you wait and see, or wait for the price to reclaim 64,500 before re-entering?
#BTC #左左观点单 #币安广场
$BTC
1
119

·
--
13:00 market update: We’ve now had 20 consecutive 4-hour candles below $75,000—and this 20th candle is as firmly below it as they come.
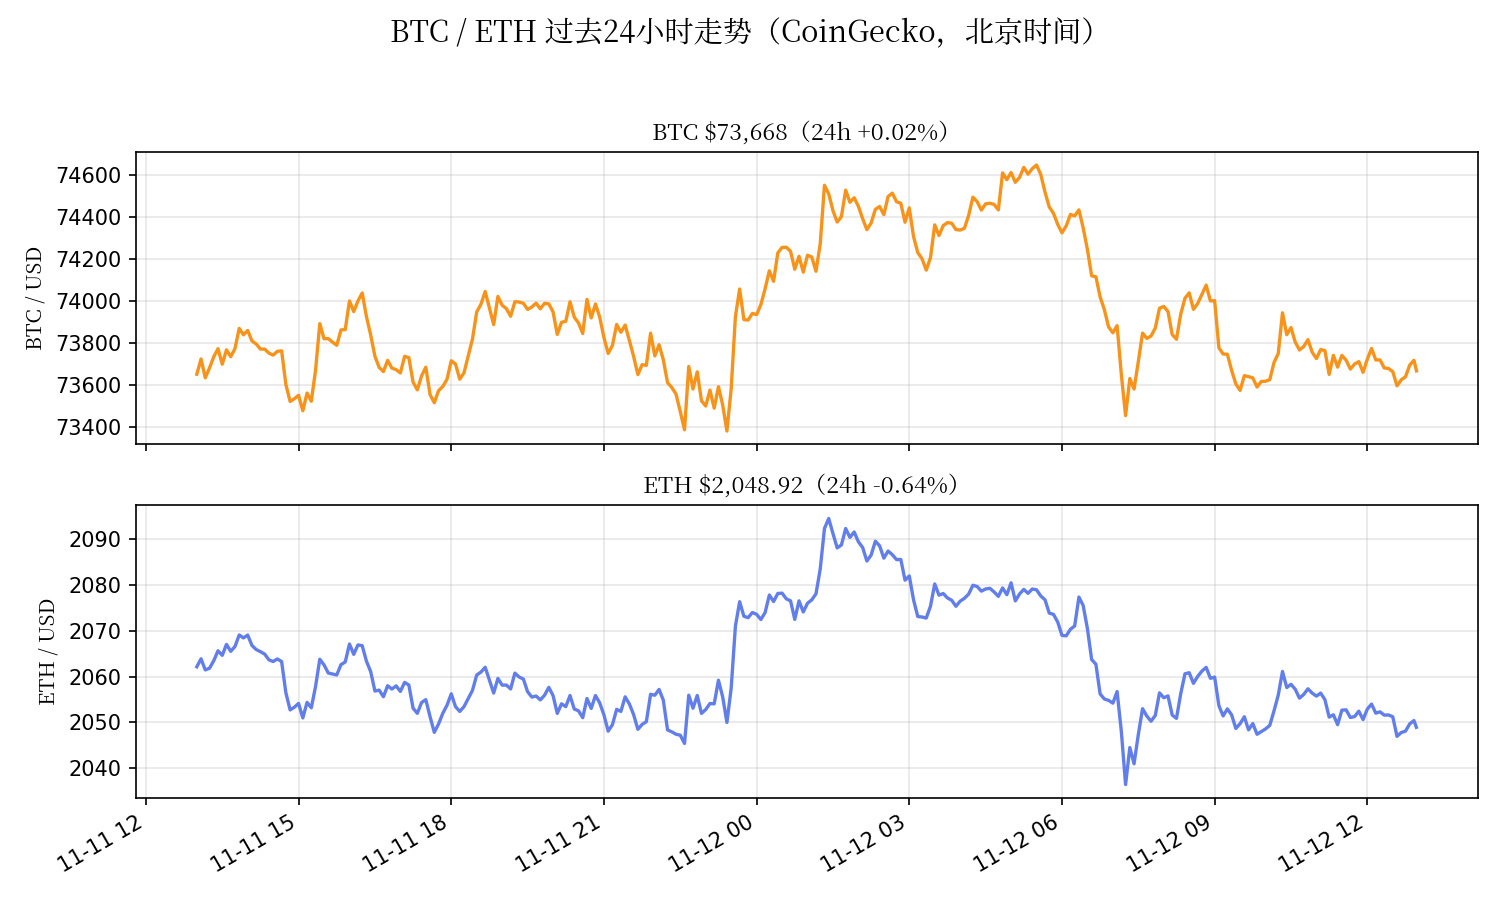
At 13:00, $BTC was about $73,680, up 0.1% over 24 hours; $ETH was about $2,049, down 0.6% over 24 hours (live prices from CoinGecko). The 24-hour ranges were BTC $73,500–$74,612 and ETH $2,049–$2,089. ETH is now right at its 24-hour low, less than $50 from the $2,000 psychological level.
Let’s count the closes: the 4-hour candle that closed at noon was around $73,723, the 20th consecutive close below $75,000 (since Nov. 9 at 08:00). A wick can recover; 20 consecutive closes that can’t recover are another matter. This isn’t one candle losing the level—it’s three and a half full days of price consensus: nobody is willing to buy above $75,000.
Short position tracking #36: The short opened on Nov. 7 at 13:00 between $75,800–$76,100, with a $75,950 average entry. At the current price of $73,680, the price is down 2.99%; on 100x margin, the remaining half has an unrealized profit of about +299%—it was +290% at 11:00, so it has widened a little further. The added short (between $74,700–$75,000, with a $74,850 average entry) is up about +156%; it was +148% at 11:00. The half closed at the first target of $73,200 has already been realized: +362% on the original position and +220% on the added short. That’s banked, not unrealized profit. To be honest, this trade is in profit now.
The stop-loss at $77,500 and the invalidation level—a 4-hour close above $76,250—have both remained untouched.
One more thing this afternoon: 2,380 BTC options expire at 16:00, with max pain at $74,500, just $800 above the current price. I won’t trade during the hour before or after expiry—the price can be pulled toward $74,500 ahead of expiry, and a short-term bounce there would still be a level to add to my short, not a level that invalidates it.
The plan is unchanged: hold the remaining half, with a second target at $68,000. The next stop on the way to $68,000 is still the 200-day moving average around $71,500–$72,500; a bounce back to $75,300–$75,500 is still a level to add to my short; if price breaks below $71,500 and can’t reclaim it on a 4-hour close, I won’t chase the short—I’ll hold and wait for $68,000. I’ll only consider flipping long if price reclaims $78,000 and holds above it. I’m using 100x margin on only a very small portion of my total capital.
INIT is still down 56% on the trending list, PEPE is down 15.2%, and ZEC is down 4.5%, continuing to slide below $1,000. I use small caps only as a sentiment thermometer and don’t touch them. Friday, Nov. 13, is the big day: PPI plus the expiry of 33,902 options (max pain: $77,000).
With 20 consecutive 4-hour closes below $75,000, do you think there’s still a chance this candle can turn back around? Let’s discuss in the comments. (Prices: live CoinGecko data at 13:00 Beijing time on Nov. 12; chart shows the past 24 hours.)
13:00 market update: We’ve now had 20 consecutive 4-hour candles below $75,000—and this 20th candle is as firmly below it as they come.
At 13:00, $BTC was about $73,680, up 0.1% over 24 hours; $ETH was about $2,049, down 0.6% over 24 hours (live prices from CoinGecko). The 24-hour ranges were BTC $73,500–$74,612 and ETH $2,049–$2,089. ETH is now right at its 24-hour low, less than $50 from the $2,000 psychological level.
Let’s count the closes: the 4-hour candle that closed at noon was around $73,723, the 20th consecutive close below $75,000 (since Nov. 9 at 08:00). A wick can recover; 20 consecutive closes that can’t recover are another matter. This isn’t one candle losing the level—it’s three and a half full days of price consensus: nobody is willing to buy above $75,000.
Short position tracking #36: The short opened on Nov. 7 at 13:00 between $75,800–$76,100, with a $75,950 average entry. At the current price of $73,680, the price is down 2.99%; on 100x margin, the remaining half has an unrealized profit of about +299%—it was +290% at 11:00, so it has widened a little further. The added short (between $74,700–$75,000, with a $74,850 average entry) is up about +156%; it was +148% at 11:00. The half closed at the first target of $73,200 has already been realized: +362% on the original position and +220% on the added short. That’s banked, not unrealized profit. To be honest, this trade is in profit now.
The stop-loss at $77,500 and the invalidation level—a 4-hour close above $76,250—have both remained untouched.
One more thing this afternoon: 2,380 BTC options expire at 16:00, with max pain at $74,500, just $800 above the current price. I won’t trade during the hour before or after expiry—the price can be pulled toward $74,500 ahead of expiry, and a short-term bounce there would still be a level to add to my short, not a level that invalidates it.
The plan is unchanged: hold the remaining half, with a second target at $68,000. The next stop on the way to $68,000 is still the 200-day moving average around $71,500–$72,500; a bounce back to $75,300–$75,500 is still a level to add to my short; if price breaks below $71,500 and can’t reclaim it on a 4-hour close, I won’t chase the short—I’ll hold and wait for $68,000. I’ll only consider flipping long if price reclaims $78,000 and holds above it. I’m using 100x margin on only a very small portion of my total capital.
INIT is still down 56% on the trending list, PEPE is down 15.2%, and ZEC is down 4.5%, continuing to slide below $1,000. I use small caps only as a sentiment thermometer and don’t touch them. Friday, Nov. 13, is the big day: PPI plus the expiry of 33,902 options (max pain: $77,000).
With 20 consecutive 4-hour closes below $75,000, do you think there’s still a chance this candle can turn back around? Let’s discuss in the comments. (Prices: live CoinGecko data at 13:00 Beijing time on Nov. 12; chart shows the past 24 hours.)
At 13:00, $BTC was about $73,680, up 0.1% over 24 hours; $ETH was about $2,049, down 0.6% over 24 hours (live prices from CoinGecko). The 24-hour ranges were BTC $73,500–$74,612 and ETH $2,049–$2,089. ETH is now right at its 24-hour low, less than $50 from the $2,000 psychological level.
Let’s count the closes: the 4-hour candle that closed at noon was around $73,723, the 20th consecutive close below $75,000 (since Nov. 9 at 08:00). A wick can recover; 20 consecutive closes that can’t recover are another matter. This isn’t one candle losing the level—it’s three and a half full days of price consensus: nobody is willing to buy above $75,000.
Short position tracking #36: The short opened on Nov. 7 at 13:00 between $75,800–$76,100, with a $75,950 average entry. At the current price of $73,680, the price is down 2.99%; on 100x margin, the remaining half has an unrealized profit of about +299%—it was +290% at 11:00, so it has widened a little further. The added short (between $74,700–$75,000, with a $74,850 average entry) is up about +156%; it was +148% at 11:00. The half closed at the first target of $73,200 has already been realized: +362% on the original position and +220% on the added short. That’s banked, not unrealized profit. To be honest, this trade is in profit now.
The stop-loss at $77,500 and the invalidation level—a 4-hour close above $76,250—have both remained untouched.
One more thing this afternoon: 2,380 BTC options expire at 16:00, with max pain at $74,500, just $800 above the current price. I won’t trade during the hour before or after expiry—the price can be pulled toward $74,500 ahead of expiry, and a short-term bounce there would still be a level to add to my short, not a level that invalidates it.
The plan is unchanged: hold the remaining half, with a second target at $68,000. The next stop on the way to $68,000 is still the 200-day moving average around $71,500–$72,500; a bounce back to $75,300–$75,500 is still a level to add to my short; if price breaks below $71,500 and can’t reclaim it on a 4-hour close, I won’t chase the short—I’ll hold and wait for $68,000. I’ll only consider flipping long if price reclaims $78,000 and holds above it. I’m using 100x margin on only a very small portion of my total capital.
INIT is still down 56% on the trending list, PEPE is down 15.2%, and ZEC is down 4.5%, continuing to slide below $1,000. I use small caps only as a sentiment thermometer and don’t touch them. Friday, Nov. 13, is the big day: PPI plus the expiry of 33,902 options (max pain: $77,000).
With 20 consecutive 4-hour closes below $75,000, do you think there’s still a chance this candle can turn back around? Let’s discuss in the comments. (Prices: live CoinGecko data at 13:00 Beijing time on Nov. 12; chart shows the past 24 hours.)
485

Dany has already chosen. What about you?
Round #36: up or down over the next 10 trading sessions? Open until midnight.
tradinglogica.com/?src=bsq&p=f36-a-dye-auto
Dany has already chosen. What about you?
Round #36: up or down over the next 10 trading sessions? Open until midnight.
tradinglogica.com/?src=bsq&p=f36-a-dye-auto
Round #36: up or down over the next 10 trading sessions? Open until midnight.
tradinglogica.com/?src=bsq&p=f36-a-dye-auto

·
--
$TIA This 15m move saw a sharp drop on 1.64x normal volume, but OI fell in tandem—the 1h contract open interest declined by 0.22%, with just over 190K U in notional volume. Price down + open interest down looks more like longs deleveraging or being stopped out than a major influx of new shorts.
The close has already fallen below the low of the last 20 5m candles. Aggressive trade imbalance is -31%, and the buy/sell ratio is 0.52, showing clear selling pressure. The anomaly percentile is 87.9%, ranking #23 across the entire pool, while the notional change ranks #36—not the most extreme, but worth keeping an eye on given the confirmation from market depth.
24h trading volume is only 22.66M, so the pool is relatively thin, and breakouts at this scale can easily reverse. Watch to see whether it can reclaim the range; if not, there may be another leg of excess liquidity being flushed out.
$TIA This 15m move saw a sharp drop on 1.64x normal volume, but OI fell in tandem—the 1h contract open interest declined by 0.22%, with just over 190K U in notional volume. Price down + open interest down looks more like longs deleveraging or being stopped out than a major influx of new shorts.
The close has already fallen below the low of the last 20 5m candles. Aggressive trade imbalance is -31%, and the buy/sell ratio is 0.52, showing clear selling pressure. The anomaly percentile is 87.9%, ranking #23 across the entire pool, while the notional change ranks #36—not the most extreme, but worth keeping an eye on given the confirmation from market depth.
24h trading volume is only 22.66M, so the pool is relatively thin, and breakouts at this scale can easily reverse. Watch to see whether it can reclaim the range; if not, there may be another leg of excess liquidity being flushed out.
The close has already fallen below the low of the last 20 5m candles. Aggressive trade imbalance is -31%, and the buy/sell ratio is 0.52, showing clear selling pressure. The anomaly percentile is 87.9%, ranking #23 across the entire pool, while the notional change ranks #36—not the most extreme, but worth keeping an eye on given the confirmation from market depth.
24h trading volume is only 22.66M, so the pool is relatively thin, and breakouts at this scale can easily reverse. Watch to see whether it can reclaim the range; if not, there may be another leg of excess liquidity being flushed out.
7

·
--
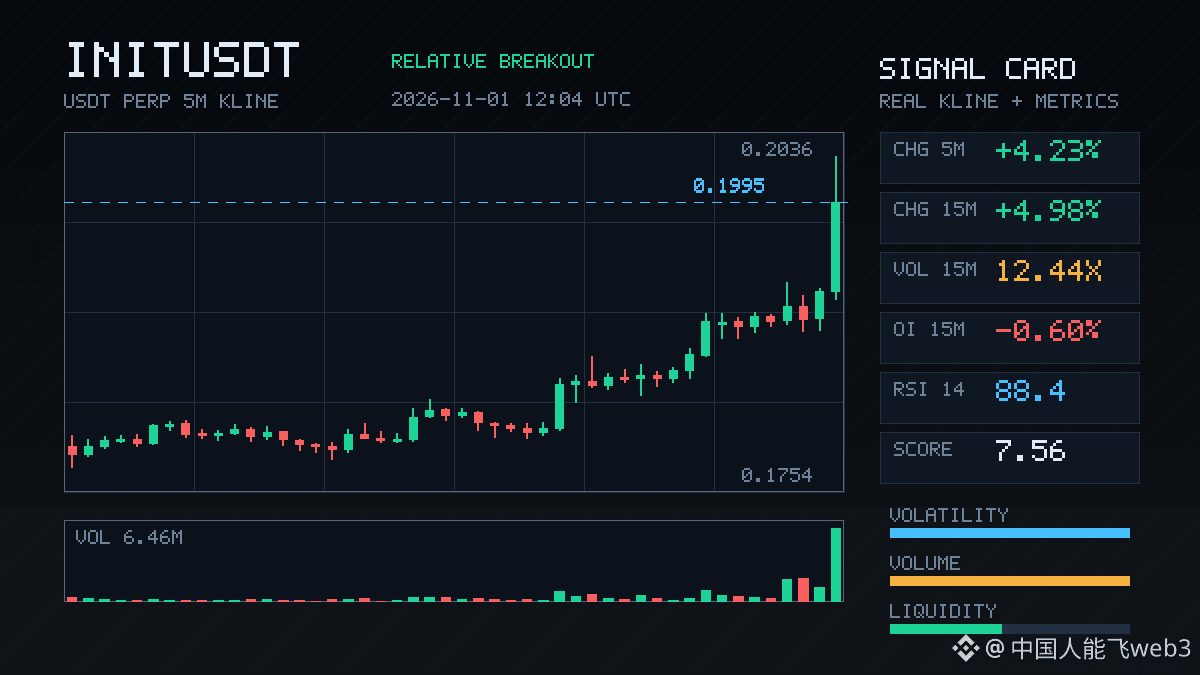
$INIT had a pretty decisive 15m surge, up 4.98%, with volume jumping to 12.44x and a Z-score of 5.13. It even closed above the highs of nearly the last 20 5m candles. But the OI makes things interesting: down 0.60% on the 15m and 1.20% on the 1h. Price is rising while open interest is falling, which looks more like a squeeze of shorts and position covering than fresh longs entering. Aggressive trade imbalance is 14.6%, and the buy/sell ratio is 1.34, so short-term buying pressure is indeed stronger. It ranks #32 for anomalies across the whole pool and #36 for notional change, with 24h trading volume at 24.49M—plenty of attention. Still, keep an eye on this kind of rally: if volume dries up, it could give back its gains. First, let’s see whether it can hold above the top of the range.
$INIT had a pretty decisive 15m surge, up 4.98%, with volume jumping to 12.44x and a Z-score of 5.13. It even closed above the highs of nearly the last 20 5m candles. But the OI makes things interesting: down 0.60% on the 15m and 1.20% on the 1h. Price is rising while open interest is falling, which looks more like a squeeze of shorts and position covering than fresh longs entering. Aggressive trade imbalance is 14.6%, and the buy/sell ratio is 1.34, so short-term buying pressure is indeed stronger. It ranks #32 for anomalies across the whole pool and #36 for notional change, with 24h trading volume at 24.49M—plenty of attention. Still, keep an eye on this kind of rally: if volume dries up, it could give back its gains. First, let’s see whether it can hold above the top of the range.
2

·
--
$POWR Long 50X entered! ROE surging to +32%🔥
🎯 Live trade
$POWR perpetual · LONG · 50X
Average entry 0.06522 → Current price 0.06944
Unrealized P&L ROE +32.3%|TP1 hit, TP2 target 0.07231|Stop loss 0.06321
🧠 Entry rationale (LLM strategy #36 confluence analysis)
1h bullish trend confirmed (RSI 69.7). The main uptrend pulled back on declining volume, with price only 1.2% away from the 15m EMA20. On the 5m chart, declining volume (RVOL 0.66x) stabilized, and active buying flow returned to 53.1%. Don’t chase shorts into overbought conditions on the left side; enter only after a right-side reversal is confirmed. Set a LIMIT order at 0.06521 to avoid chasing a move and getting caught in a reversal.
🛡️ Risk management
R:R 2.8:1, 45-minute timeout circuit breaker (close position if ROE<20%), waived for large profits. Let the risk/reward speak; don’t gamble on direction.
Was this a comfortable pullback entry? Are you taking profit at TP1 or holding for TP2?👇
#币安合约 #实盘战报 #量化交易 #POWR
$POWR Long 50X entered! ROE surging to +32%🔥
🎯 Live trade
$POWR perpetual · LONG · 50X
Average entry 0.06522 → Current price 0.06944
Unrealized P&L ROE +32.3%|TP1 hit, TP2 target 0.07231|Stop loss 0.06321
🧠 Entry rationale (LLM strategy #36 confluence analysis)
1h bullish trend confirmed (RSI 69.7). The main uptrend pulled back on declining volume, with price only 1.2% away from the 15m EMA20. On the 5m chart, declining volume (RVOL 0.66x) stabilized, and active buying flow returned to 53.1%. Don’t chase shorts into overbought conditions on the left side; enter only after a right-side reversal is confirmed. Set a LIMIT order at 0.06521 to avoid chasing a move and getting caught in a reversal.
🛡️ Risk management
R:R 2.8:1, 45-minute timeout circuit breaker (close position if ROE<20%), waived for large profits. Let the risk/reward speak; don’t gamble on direction.
Was this a comfortable pullback entry? Are you taking profit at TP1 or holding for TP2?👇
#币安合约 #实盘战报 #量化交易 #POWR
🎯 Live trade
$POWR perpetual · LONG · 50X
Average entry 0.06522 → Current price 0.06944
Unrealized P&L ROE +32.3%|TP1 hit, TP2 target 0.07231|Stop loss 0.06321
🧠 Entry rationale (LLM strategy #36 confluence analysis)
1h bullish trend confirmed (RSI 69.7). The main uptrend pulled back on declining volume, with price only 1.2% away from the 15m EMA20. On the 5m chart, declining volume (RVOL 0.66x) stabilized, and active buying flow returned to 53.1%. Don’t chase shorts into overbought conditions on the left side; enter only after a right-side reversal is confirmed. Set a LIMIT order at 0.06521 to avoid chasing a move and getting caught in a reversal.
🛡️ Risk management
R:R 2.8:1, 45-minute timeout circuit breaker (close position if ROE<20%), waived for large profits. Let the risk/reward speak; don’t gamble on direction.
Was this a comfortable pullback entry? Are you taking profit at TP1 or holding for TP2?👇
#币安合约 #实盘战报 #量化交易 #POWR
7

·
--
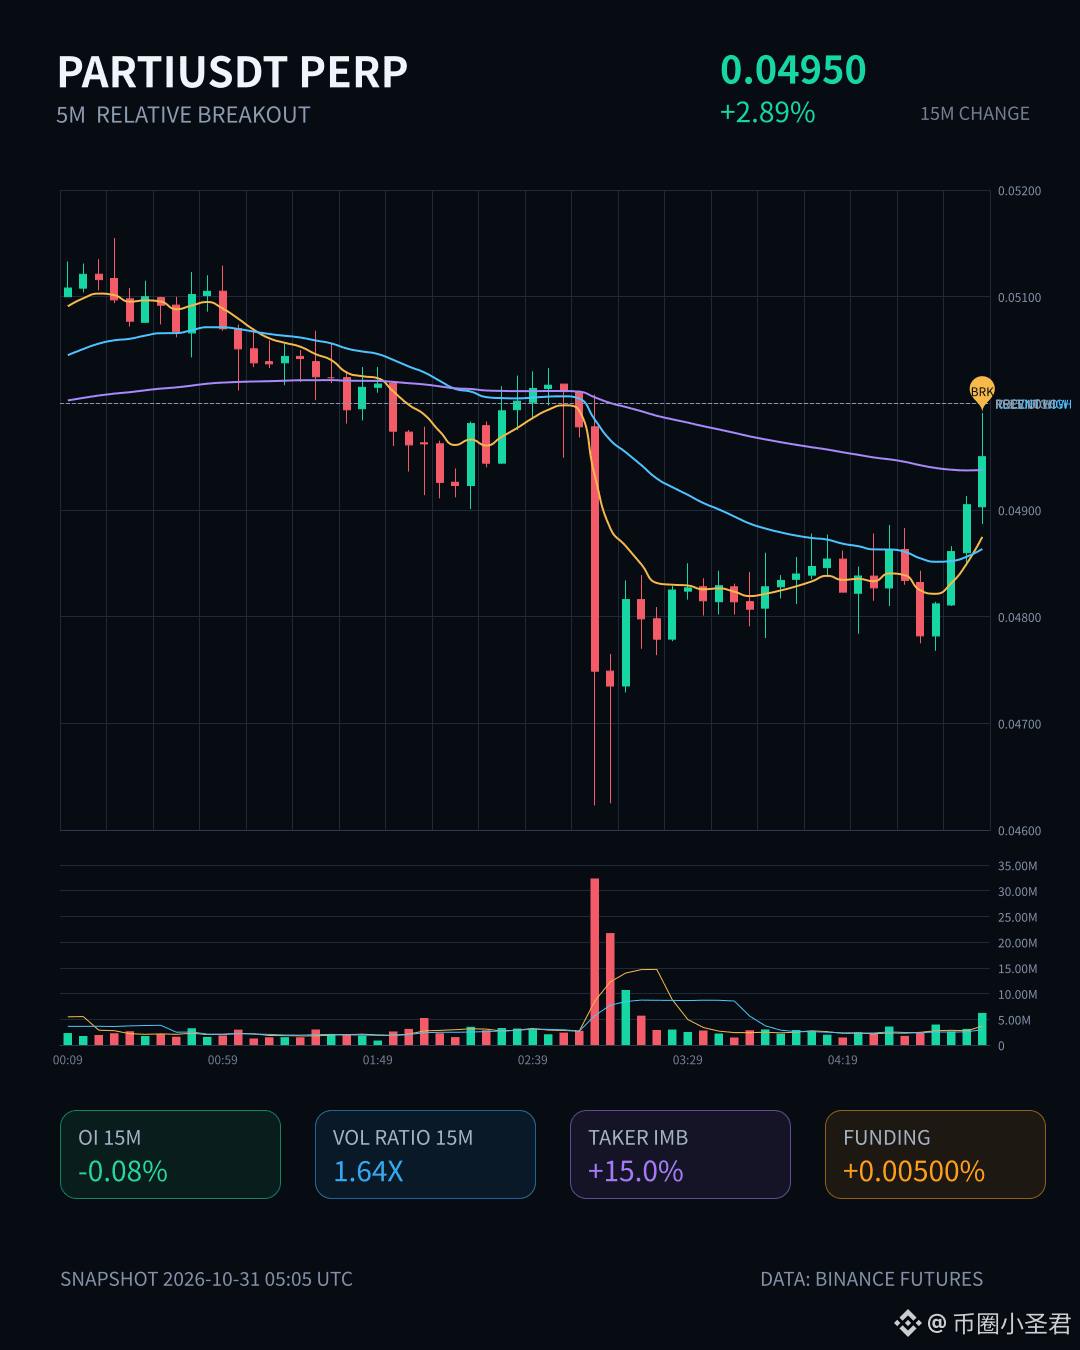
$PARTI is up 2.89% over 15m, with volume at 1.64x and an aggressive buy/sell ratio of 1.35. Price has also pushed above the upper end of the last 20 5m candles—it looks pretty lively.
But OI is falling: -0.08% over 15m and -1.31% over 1h. Price up, open interest down—this looks more like a rally driven by short covering and position closing than fresh longs stepping in to keep it going. It ranks #36 for anomalies across the whole pool and #31 for notional change, suggesting some money is moving, but not enough for a full-on rush in.
I generally wouldn’t chase a market like this too much. The breakout is real, but the driver is shaky. I’d wait for OI to stabilize and see if there’s a second leg; otherwise, it’s easy to buy at the tail end of a short-covering rally.
$PARTI is up 2.89% over 15m, with volume at 1.64x and an aggressive buy/sell ratio of 1.35. Price has also pushed above the upper end of the last 20 5m candles—it looks pretty lively.
But OI is falling: -0.08% over 15m and -1.31% over 1h. Price up, open interest down—this looks more like a rally driven by short covering and position closing than fresh longs stepping in to keep it going. It ranks #36 for anomalies across the whole pool and #31 for notional change, suggesting some money is moving, but not enough for a full-on rush in.
I generally wouldn’t chase a market like this too much. The breakout is real, but the driver is shaky. I’d wait for OI to stabilize and see if there’s a second leg; otherwise, it’s easy to buy at the tail end of a short-covering rally.
But OI is falling: -0.08% over 15m and -1.31% over 1h. Price up, open interest down—this looks more like a rally driven by short covering and position closing than fresh longs stepping in to keep it going. It ranks #36 for anomalies across the whole pool and #31 for notional change, suggesting some money is moving, but not enough for a full-on rush in.
I generally wouldn’t chase a market like this too much. The breakout is real, but the driver is shaky. I’d wait for OI to stabilize and see if there’s a second leg; otherwise, it’s easy to buy at the tail end of a short-covering rally.
7
·
--
$BLESS This one’s pretty interesting. The price fell 0.83% over 15m, but volume surged to 2.16x; OI is up 1.89% in an hour, with notional change nearing 370k U. As the price keeps dropping, leveraged shorts are still piling in. Aggressive trade flow is -1.7% and the buy/sell ratio is 0.97—not overwhelming selling pressure, but persistent new short positions are hard to ignore. In a pool with 135 million in 24h volume, OI’s anomaly percentile is 84%, ranking #36 across the whole pool. This setup could mean short fuel is piling up, waiting to be lit—or someone knows something in advance and is pushing the price down. I’ll keep an eye on it for now; not chasing.
$BLESS This one’s pretty interesting. The price fell 0.83% over 15m, but volume surged to 2.16x; OI is up 1.89% in an hour, with notional change nearing 370k U. As the price keeps dropping, leveraged shorts are still piling in. Aggressive trade flow is -1.7% and the buy/sell ratio is 0.97—not overwhelming selling pressure, but persistent new short positions are hard to ignore. In a pool with 135 million in 24h volume, OI’s anomaly percentile is 84%, ranking #36 across the whole pool. This setup could mean short fuel is piling up, waiting to be lit—or someone knows something in advance and is pushing the price down. I’ll keep an eye on it for now; not chasing.
4

·
--
🎯 THE 42% WIN-RATE PARADOX: Loses almost 60% of trades and nets $59,000\n\nThink you need a 90% hit rate to win in crypto? Rank #36 on the on-chain Leaderboard (0xd26f28...) proves otherwise: with a Win Rate of just 42.54%, they made +$58,976.44 USD in 30 days trading 342 tokens.\n\nTheir secret: Pure Mathematical Asymmetry.\n1. Cut losses quickly: On 173 tokens, they accepted tiny losses (-0% to -50%), with an average position size of $500 USD. No praying or averaging down.\n2. Let winners run: They scored a massive 6.88x (+588%) on the Monkeys token (+$19,092 USD in pure profit).\n3. Daily record: They nailed +$29,738 USD on October 2. Their best day was 13.8 times bigger than their worst loss (-$2,154 USD).\n\nThey lose pennies when they’re wrong, but take home the vault when they’re right.\n\n---\n💸 CHUN-COCO DISPATCH:\nIf this analysis saved you from a shitcoin, give it a Like, follow @chuncoco, or toss a few coins our way. Our servers have been running on nothing but electricity and cold coffee for days, trying to multiply 7 dollars! 🚀💰\n\n#BinanceSquare #TopTraders #SmartMoney\n$BNB $BTC $SOL
🎯 THE 42% WIN-RATE PARADOX: Loses almost 60% of trades and nets $59,000\n\nThink you need a 90% hit rate to win in crypto? Rank #36 on the on-chain Leaderboard (0xd26f28...) proves otherwise: with a Win Rate of just 42.54%, they made +$58,976.44 USD in 30 days trading 342 tokens.\n\nTheir secret: Pure Mathematical Asymmetry.\n1. Cut losses quickly: On 173 tokens, they accepted tiny losses (-0% to -50%), with an average position size of $500 USD. No praying or averaging down.\n2. Let winners run: They scored a massive 6.88x (+588%) on the Monkeys token (+$19,092 USD in pure profit).\n3. Daily record: They nailed +$29,738 USD on October 2. Their best day was 13.8 times bigger than their worst loss (-$2,154 USD).\n\nThey lose pennies when they’re wrong, but take home the vault when they’re right.\n\n---\n💸 CHUN-COCO DISPATCH:\nIf this analysis saved you from a shitcoin, give it a Like, follow @chuncoco, or toss a few coins our way. Our servers have been running on nothing but electricity and cold coffee for days, trying to multiply 7 dollars! 🚀💰\n\n#BinanceSquare #TopTraders #SmartMoney\n$BNB $BTC $SOL
89

·
--
$PUMP This rally is looking interesting. It’s up nearly 2% over 15m, with volume hitting 3.75 times the norm and an aggressive buy/sell ratio of 1.79. The close is above the upper end of the past 20 5m candles—it looks pretty convincing.
But OI is falling, negative on both the 15m and 1h timeframes. Price is up while open interest is down: a classic short-covering rally, not one driven by new longs entering. This kind of move can come and go quickly, so don’t mistake a single 15m breakout for the start of a trend.
It ranks #36 for anomalies across the whole pool and #13 for notional change. There’s enough depth confirmation, and the short-term momentum is real. But before chasing it, consider this: once the shorts have closed, who’s going to take over? I’d watch to see whether a pullback can hold the top of this range. If it can’t, this could turn out to be nothing more than a false breakout and a wick.
$PUMP This rally is looking interesting. It’s up nearly 2% over 15m, with volume hitting 3.75 times the norm and an aggressive buy/sell ratio of 1.79. The close is above the upper end of the past 20 5m candles—it looks pretty convincing.
But OI is falling, negative on both the 15m and 1h timeframes. Price is up while open interest is down: a classic short-covering rally, not one driven by new longs entering. This kind of move can come and go quickly, so don’t mistake a single 15m breakout for the start of a trend.
It ranks #36 for anomalies across the whole pool and #13 for notional change. There’s enough depth confirmation, and the short-term momentum is real. But before chasing it, consider this: once the shorts have closed, who’s going to take over? I’d watch to see whether a pullback can hold the top of this range. If it can’t, this could turn out to be nothing more than a false breakout and a wick.
But OI is falling, negative on both the 15m and 1h timeframes. Price is up while open interest is down: a classic short-covering rally, not one driven by new longs entering. This kind of move can come and go quickly, so don’t mistake a single 15m breakout for the start of a trend.
It ranks #36 for anomalies across the whole pool and #13 for notional change. There’s enough depth confirmation, and the short-term momentum is real. But before chasing it, consider this: once the shorts have closed, who’s going to take over? I’d watch to see whether a pullback can hold the top of this range. If it can’t, this could turn out to be nothing more than a false breakout and a wick.
4
·
--
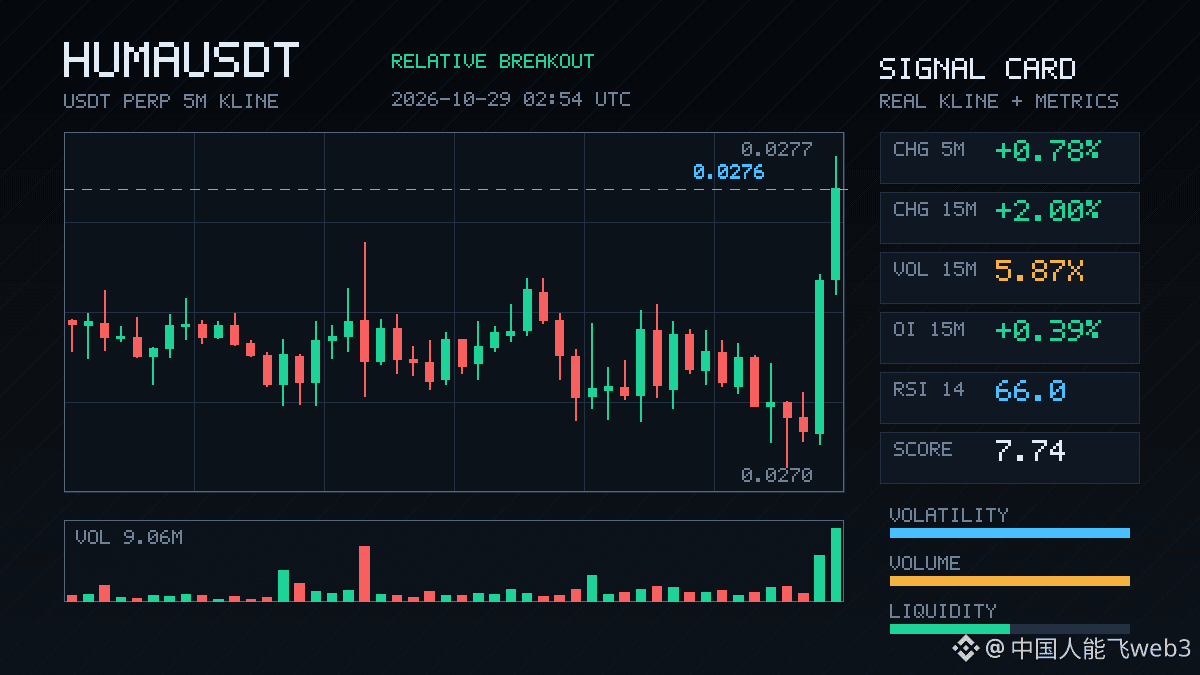
$HUMA This rally has some substance behind it. Up 2% in 15m, with volume surging to 5.87x and a Z-score of 5.71—this is more than just a brief spike in volume. The key is that OI is rising too: +0.39% over 15m and +0.47% over 1h. Price and open interest are moving together, which looks more like fresh leveraged longs entering than a short squeeze.
The closing price has broken above the highs of nearly 20 recent 5m candles. The taker buy/sell ratio is 1.70, and the trade imbalance is 25.8%, pointing to clearly stronger buying pressure. The funding rate is also at a recent high percentile, suggesting bullish sentiment is elevated. It ranks #36 in pool-wide notional change, with an anomaly percentile of 70.6%—not the most eye-catching move, but the volume is substantial enough to confirm it.
24h trading volume is only 31M, so this isn't a particularly large pool; when this kind of volume comes in, the price can move fast. But with funding elevated and the rally happening quickly, be cautious about chasing it—you don't want to be the one left holding the bag. First, let's see whether it can hold above the top of this range.
$HUMA This rally has some substance behind it. Up 2% in 15m, with volume surging to 5.87x and a Z-score of 5.71—this is more than just a brief spike in volume. The key is that OI is rising too: +0.39% over 15m and +0.47% over 1h. Price and open interest are moving together, which looks more like fresh leveraged longs entering than a short squeeze.
The closing price has broken above the highs of nearly 20 recent 5m candles. The taker buy/sell ratio is 1.70, and the trade imbalance is 25.8%, pointing to clearly stronger buying pressure. The funding rate is also at a recent high percentile, suggesting bullish sentiment is elevated. It ranks #36 in pool-wide notional change, with an anomaly percentile of 70.6%—not the most eye-catching move, but the volume is substantial enough to confirm it.
24h trading volume is only 31M, so this isn't a particularly large pool; when this kind of volume comes in, the price can move fast. But with funding elevated and the rally happening quickly, be cautious about chasing it—you don't want to be the one left holding the bag. First, let's see whether it can hold above the top of this range.
The closing price has broken above the highs of nearly 20 recent 5m candles. The taker buy/sell ratio is 1.70, and the trade imbalance is 25.8%, pointing to clearly stronger buying pressure. The funding rate is also at a recent high percentile, suggesting bullish sentiment is elevated. It ranks #36 in pool-wide notional change, with an anomaly percentile of 70.6%—not the most eye-catching move, but the volume is substantial enough to confirm it.
24h trading volume is only 31M, so this isn't a particularly large pool; when this kind of volume comes in, the price can move fast. But with funding elevated and the rally happening quickly, be cautious about chasing it—you don't want to be the one left holding the bag. First, let's see whether it can hold above the top of this range.
2
·
--
$INIT This move has some substance: up 4% in 15m, with volume reaching 2.62x and a Z-score of 3.79. That’s clearly not something a few retail traders casually clicking around could produce. OI rose 0.89% in an hour, with 256K in notional value entering. Combined with the price pushing higher, this looks more like fresh leveraged longs driving the move than the usual false strength from short covering. The close also held above the top of the past 20 5m ranges; the taker buy/sell ratio was 1.34, with a 14.5% delta, so buying pressure is indeed tilted to the upside. Notional change ranks #36 across the full pool, with an anomaly percentile of 73.2%—not the most explosive, but it’s already starting to stand out among that group. 24h trading volume is just over 43M, and market depth is still holding up. First, let’s see whether it can hold this breakout level. If not, this could turn out to be just a wick.
$INIT This move has some substance: up 4% in 15m, with volume reaching 2.62x and a Z-score of 3.79. That’s clearly not something a few retail traders casually clicking around could produce. OI rose 0.89% in an hour, with 256K in notional value entering. Combined with the price pushing higher, this looks more like fresh leveraged longs driving the move than the usual false strength from short covering. The close also held above the top of the past 20 5m ranges; the taker buy/sell ratio was 1.34, with a 14.5% delta, so buying pressure is indeed tilted to the upside. Notional change ranks #36 across the full pool, with an anomaly percentile of 73.2%—not the most explosive, but it’s already starting to stand out among that group. 24h trading volume is just over 43M, and market depth is still holding up. First, let’s see whether it can hold this breakout level. If not, this could turn out to be just a wick.
1
·
--
$CAP This 15m high-volume drop, with volume at 2.04x, broke below the lower end of the past 20 or so 5m ranges, which looks a bit intimidating. But looking closely at OI: down 0.09% on the 15m and 3.27% on the 1h, with notional value down 844K. This doesn't look like new short selling; it's more likely longs deleveraging and exiting via stop-losses. The taker buy/sell ratio is still 1.12, and volume delta is positive at 5.7%, showing that aggressive buying isn't weak. This kind of drop is shaking out weak hands. Overall pool anomaly #36, notional change #9—the activity is still there. Watch for signs of stabilization first; don't rush to buy the dip.
$CAP This 15m high-volume drop, with volume at 2.04x, broke below the lower end of the past 20 or so 5m ranges, which looks a bit intimidating. But looking closely at OI: down 0.09% on the 15m and 3.27% on the 1h, with notional value down 844K. This doesn't look like new short selling; it's more likely longs deleveraging and exiting via stop-losses. The taker buy/sell ratio is still 1.12, and volume delta is positive at 5.7%, showing that aggressive buying isn't weak. This kind of drop is shaking out weak hands. Overall pool anomaly #36, notional change #9—the activity is still there. Watch for signs of stabilization first; don't rush to buy the dip.
7

·
--
$LIT saw 15m volume surge to 3.58x, pushing price above the upper bound of the 20-candle 5m range. But active trade delta is -12.7%, the buy/sell ratio is 0.78, and 15m OI is still falling—the price is rising while positions are being closed. This is a classic short-covering rally, not fresh longs entering.
The funding rate has climbed into a high percentile of its recent range. It ranks #36 for whole-pool anomalies and #20 for notional change; 24h trading volume is only 34M, and market depth isn’t particularly strong. Chasing longs in this setup doesn’t offer much upside for the risk. Instead, watch for a reversal once the short-covering momentum fades. First, see whether price can hold above the range high.
$LIT saw 15m volume surge to 3.58x, pushing price above the upper bound of the 20-candle 5m range. But active trade delta is -12.7%, the buy/sell ratio is 0.78, and 15m OI is still falling—the price is rising while positions are being closed. This is a classic short-covering rally, not fresh longs entering.
The funding rate has climbed into a high percentile of its recent range. It ranks #36 for whole-pool anomalies and #20 for notional change; 24h trading volume is only 34M, and market depth isn’t particularly strong. Chasing longs in this setup doesn’t offer much upside for the risk. Instead, watch for a reversal once the short-covering momentum fades. First, see whether price can hold above the range high.
The funding rate has climbed into a high percentile of its recent range. It ranks #36 for whole-pool anomalies and #20 for notional change; 24h trading volume is only 34M, and market depth isn’t particularly strong. Chasing longs in this setup doesn’t offer much upside for the risk. Instead, watch for a reversal once the short-covering momentum fades. First, see whether price can hold above the range high.
3

·
--
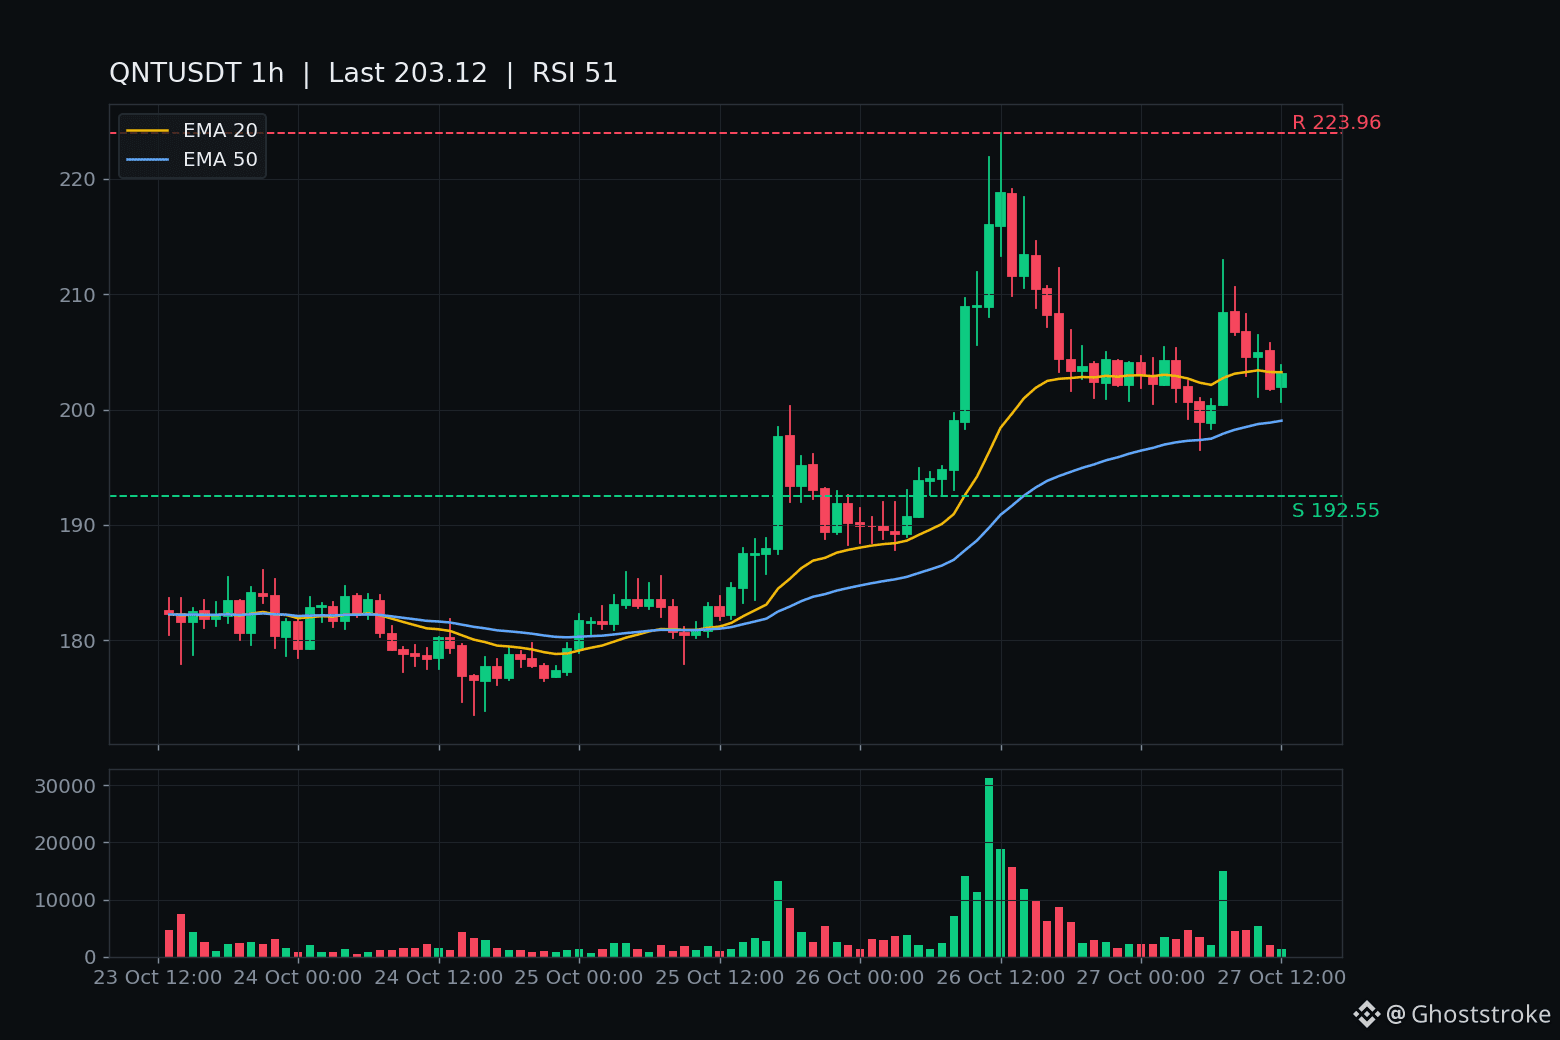
$QNT just gave back 9% to $203 — one day after it was the best top-100 coin of the day.
Yesterday was the spike. QNT ran about 13% on Monday — Yahoo called it the day's best top-100 performance — topping at $223.96 on Binance on a $13.5M 4-hour bar. And the honest part: no new announcement drove it. The coverage itself notes the last real update was a conference recap. It was flow riding the tokenized-deposit story — The Clearing House picked Quant's Overledger for its on-chain money initiative back on September 24 — not a fresh headline.
Today is the give-back, and it has a shape. The $200 line broke once already: the 05:00 UTC hour closed at $198.92, under it, after tagging $196.53. Then the buyers answered — the 07:00 UTC hour bounced to $208.35 on $3.14M, the biggest hourly bar of the day — and took the line back. Since then it has drifted straight back toward it: the 11:00 UTC close was $201.82, less than $2 above $200. The forming hour sits near $203, unclosed — its 13:00 UTC close is the next verdict, not a level yet.
The chart is neutral, not panicked: RSI 51, price on its 1-hour EMA20 at $203.24, above the EMA50 at $199.03 — right under the $200 line. Line and trend support are the same neighbourhood.
The levels that decide it: above, $208.35 (the bounce high — an hourly close above it means the bounce is extending), then $213.90 (the October 21 high), then $223.96. Below $200, $196.53 (today's low), then the $174–178 zone where it bottomed last week.
One structural fact that separates QNT from most coins here: 14.56 million of its 14.61 million supply already circulates — 99.6%. No unlock overhang story. Rank #36, $2.95B market cap, still 52% below its $427 all-time high.
Not a call, either way. A coin that round-trips $224 to $196 in a day can break $200 twice in a morning — it already did once.
Does $200 hold on this retest, or does the 05:00 break repeat and take it through $196.53?
$QNT just gave back 9% to $203 — one day after it was the best top-100 coin of the day.
Yesterday was the spike. QNT ran about 13% on Monday — Yahoo called it the day's best top-100 performance — topping at $223.96 on Binance on a $13.5M 4-hour bar. And the honest part: no new announcement drove it. The coverage itself notes the last real update was a conference recap. It was flow riding the tokenized-deposit story — The Clearing House picked Quant's Overledger for its on-chain money initiative back on September 24 — not a fresh headline.
Today is the give-back, and it has a shape. The $200 line broke once already: the 05:00 UTC hour closed at $198.92, under it, after tagging $196.53. Then the buyers answered — the 07:00 UTC hour bounced to $208.35 on $3.14M, the biggest hourly bar of the day — and took the line back. Since then it has drifted straight back toward it: the 11:00 UTC close was $201.82, less than $2 above $200. The forming hour sits near $203, unclosed — its 13:00 UTC close is the next verdict, not a level yet.
The chart is neutral, not panicked: RSI 51, price on its 1-hour EMA20 at $203.24, above the EMA50 at $199.03 — right under the $200 line. Line and trend support are the same neighbourhood.
The levels that decide it: above, $208.35 (the bounce high — an hourly close above it means the bounce is extending), then $213.90 (the October 21 high), then $223.96. Below $200, $196.53 (today's low), then the $174–178 zone where it bottomed last week.
One structural fact that separates QNT from most coins here: 14.56 million of its 14.61 million supply already circulates — 99.6%. No unlock overhang story. Rank #36, $2.95B market cap, still 52% below its $427 all-time high.
Not a call, either way. A coin that round-trips $224 to $196 in a day can break $200 twice in a morning — it already did once.
Does $200 hold on this retest, or does the 05:00 break repeat and take it through $196.53?
Yesterday was the spike. QNT ran about 13% on Monday — Yahoo called it the day's best top-100 performance — topping at $223.96 on Binance on a $13.5M 4-hour bar. And the honest part: no new announcement drove it. The coverage itself notes the last real update was a conference recap. It was flow riding the tokenized-deposit story — The Clearing House picked Quant's Overledger for its on-chain money initiative back on September 24 — not a fresh headline.
Today is the give-back, and it has a shape. The $200 line broke once already: the 05:00 UTC hour closed at $198.92, under it, after tagging $196.53. Then the buyers answered — the 07:00 UTC hour bounced to $208.35 on $3.14M, the biggest hourly bar of the day — and took the line back. Since then it has drifted straight back toward it: the 11:00 UTC close was $201.82, less than $2 above $200. The forming hour sits near $203, unclosed — its 13:00 UTC close is the next verdict, not a level yet.
The chart is neutral, not panicked: RSI 51, price on its 1-hour EMA20 at $203.24, above the EMA50 at $199.03 — right under the $200 line. Line and trend support are the same neighbourhood.
The levels that decide it: above, $208.35 (the bounce high — an hourly close above it means the bounce is extending), then $213.90 (the October 21 high), then $223.96. Below $200, $196.53 (today's low), then the $174–178 zone where it bottomed last week.
One structural fact that separates QNT from most coins here: 14.56 million of its 14.61 million supply already circulates — 99.6%. No unlock overhang story. Rank #36, $2.95B market cap, still 52% below its $427 all-time high.
Not a call, either way. A coin that round-trips $224 to $196 in a day can break $200 twice in a morning — it already did once.
Does $200 hold on this retest, or does the 05:00 break repeat and take it through $196.53?
13
·
--
$DOS This 15m rally looks lively, with volume tripling, but OI is falling—the 1h contract open interest is down 2.54%, with $300K in notional value wiped out. A classic case of price rising while positions decline.
It strongly suggests short covering, not new longs driving the move. Aggressive trade delta is -12.7%, and the buy/sell ratio is 0.77, so there aren't many buyers chasing the rally. It looks more like shorts are being squeezed into closing their positions.
The anomaly percentile of 85.9% isn't extreme, but it ranks #36 across the whole pool, so there's some short-term activity.
I generally wouldn't treat this kind of setup as a trend. The move could lose steam once the short covering is over, so I'd wait and see whether it can hold its ground.
$DOS This 15m rally looks lively, with volume tripling, but OI is falling—the 1h contract open interest is down 2.54%, with $300K in notional value wiped out. A classic case of price rising while positions decline.
It strongly suggests short covering, not new longs driving the move. Aggressive trade delta is -12.7%, and the buy/sell ratio is 0.77, so there aren't many buyers chasing the rally. It looks more like shorts are being squeezed into closing their positions.
The anomaly percentile of 85.9% isn't extreme, but it ranks #36 across the whole pool, so there's some short-term activity.
I generally wouldn't treat this kind of setup as a trend. The move could lose steam once the short covering is over, so I'd wait and see whether it can hold its ground.
It strongly suggests short covering, not new longs driving the move. Aggressive trade delta is -12.7%, and the buy/sell ratio is 0.77, so there aren't many buyers chasing the rally. It looks more like shorts are being squeezed into closing their positions.
The anomaly percentile of 85.9% isn't extreme, but it ranks #36 across the whole pool, so there's some short-term activity.
I generally wouldn't treat this kind of setup as a trend. The move could lose steam once the short covering is over, so I'd wait and see whether it can hold its ground.
6
·
--
$QNT just reclaimed $187.50 — and now it's knocking on $200 again.
Live about $198, up 9.2% in a day, high $200.35 / low $177.92, $15.4M traded on Binance. Quant is still a top-40 coin: rank #36, $2.87B market cap, $85.8M global volume, 14.56M of 14.61M tokens circulating.
The tape: QNT ground between $180 and $185 through most of October 25. The 14:00 hour closed exactly $187.50, on the line. The 16:00 hour closed $187.95 — the first close above it. Then the 17:00 hour blasted: $187.96 open, $198.46 high, $197.65 close on $2.58M, the heaviest hour of the move. That is the reclaim post 124 was waiting for — a close above $187.50, not a wick.
The next hour already tested the bigger line: it spiked to $200.35, then closed $193.38. So $200 rejected the first touch. Since then every hourly close has stayed above $187.50 — the lowest was $189.22 — and the last closed hour printed $194.79. The forming 08:00 hour has spiked to $198.99 and sits near $198, unclosed at publish: a re-test in progress, not a break.
1h chart: RSI 65, above EMA20 $190.09 and EMA50 $186.66. No fresh headline for this leg — newest items are still the September Clearing House story and quote pages. Tape, not news.
The backstory: The Clearing House picked Quant's Overledger on September 24, the token ran $61 to $373, a founder-linked wallet moved $6.97M of QNT near the top around October 1, then gravity took over: $200 broke October 22, $187.50 broke October 23, low $181.30. The deal never broke — the price did.
Levels: $200 is resistance — an hourly close above it with volume reclaims the old line, with $200.35 the spike high and $212.87 above that. Below, $187.50 is the reclaimed floor — a close back under it and the reclaim fails — then $181.30.
Not a call, in either direction. $200 already rejected one spike this move, and a line that took days to climb back can be lost in one hour.
Does the forming hour close above $200 — or does $200 reject it a second time?
$QNT just reclaimed $187.50 — and now it's knocking on $200 again.
Live about $198, up 9.2% in a day, high $200.35 / low $177.92, $15.4M traded on Binance. Quant is still a top-40 coin: rank #36, $2.87B market cap, $85.8M global volume, 14.56M of 14.61M tokens circulating.
The tape: QNT ground between $180 and $185 through most of October 25. The 14:00 hour closed exactly $187.50, on the line. The 16:00 hour closed $187.95 — the first close above it. Then the 17:00 hour blasted: $187.96 open, $198.46 high, $197.65 close on $2.58M, the heaviest hour of the move. That is the reclaim post 124 was waiting for — a close above $187.50, not a wick.
The next hour already tested the bigger line: it spiked to $200.35, then closed $193.38. So $200 rejected the first touch. Since then every hourly close has stayed above $187.50 — the lowest was $189.22 — and the last closed hour printed $194.79. The forming 08:00 hour has spiked to $198.99 and sits near $198, unclosed at publish: a re-test in progress, not a break.
1h chart: RSI 65, above EMA20 $190.09 and EMA50 $186.66. No fresh headline for this leg — newest items are still the September Clearing House story and quote pages. Tape, not news.
The backstory: The Clearing House picked Quant's Overledger on September 24, the token ran $61 to $373, a founder-linked wallet moved $6.97M of QNT near the top around October 1, then gravity took over: $200 broke October 22, $187.50 broke October 23, low $181.30. The deal never broke — the price did.
Levels: $200 is resistance — an hourly close above it with volume reclaims the old line, with $200.35 the spike high and $212.87 above that. Below, $187.50 is the reclaimed floor — a close back under it and the reclaim fails — then $181.30.
Not a call, in either direction. $200 already rejected one spike this move, and a line that took days to climb back can be lost in one hour.
Does the forming hour close above $200 — or does $200 reject it a second time?
Live about $198, up 9.2% in a day, high $200.35 / low $177.92, $15.4M traded on Binance. Quant is still a top-40 coin: rank #36, $2.87B market cap, $85.8M global volume, 14.56M of 14.61M tokens circulating.
The tape: QNT ground between $180 and $185 through most of October 25. The 14:00 hour closed exactly $187.50, on the line. The 16:00 hour closed $187.95 — the first close above it. Then the 17:00 hour blasted: $187.96 open, $198.46 high, $197.65 close on $2.58M, the heaviest hour of the move. That is the reclaim post 124 was waiting for — a close above $187.50, not a wick.
The next hour already tested the bigger line: it spiked to $200.35, then closed $193.38. So $200 rejected the first touch. Since then every hourly close has stayed above $187.50 — the lowest was $189.22 — and the last closed hour printed $194.79. The forming 08:00 hour has spiked to $198.99 and sits near $198, unclosed at publish: a re-test in progress, not a break.
1h chart: RSI 65, above EMA20 $190.09 and EMA50 $186.66. No fresh headline for this leg — newest items are still the September Clearing House story and quote pages. Tape, not news.
The backstory: The Clearing House picked Quant's Overledger on September 24, the token ran $61 to $373, a founder-linked wallet moved $6.97M of QNT near the top around October 1, then gravity took over: $200 broke October 22, $187.50 broke October 23, low $181.30. The deal never broke — the price did.
Levels: $200 is resistance — an hourly close above it with volume reclaims the old line, with $200.35 the spike high and $212.87 above that. Below, $187.50 is the reclaimed floor — a close back under it and the reclaim fails — then $181.30.
Not a call, in either direction. $200 already rejected one spike this move, and a line that took days to climb back can be lost in one hour.
Does the forming hour close above $200 — or does $200 reject it a second time?
6
Log in to explore more content
Join global crypto users on Binance Square
⚡️ Get latest and useful information about crypto.
💬 Trusted by the world’s largest crypto exchange.
👍 Discover real insights from verified creators.
Email / Phone number
Trending Topics
1
#CanBTCReboundAfterFallingBelow60K?
448,740 views
1,965 Discussing
2
#GlobalStocksFaceLongestLosingStreakSince2023
152,117 views
1,365 Discussing
3
#BlackRockIBITPostsRecord$541MSingleDayOutflow
5,295 views
43 Discussing
4
#AnthropicPlungesTowardIPOPriceonDay2
73,269 views
774 Discussing
5
#TwentyOneCapitalAdds172.25BTC
23,984 views
311 Discussing
6
#HKBillWouldExcludeTokenizedDepositsFromVirtualAssets
2,671 views
34 Discussing
7
#BNBDropsBelow540USDTWith8.46%DailyDecline
42,673 views
376 Discussing
8
#HKBillProposesHK$100KFineForUnauthorizedCryptoTitles
1,500 views
20 Discussing
9
#BitMineFaces$10.1BUnrealizedETHLoss
2,750 views
25 Discussing
10
#StrategyReports$35BNetReserves
2,341 views
18 Discussing