
#41
41
20,826 views
111 Discussing
Hot
Latest

A real chart, with no name or date.
Date #41: Will it go up or down over the next 10 trading sessions? It runs until midnight.
tradinglogica.com/?src=bsq&p=f41-a-cur-auto
A real chart, with no name or date.
Date #41: Will it go up or down over the next 10 trading sessions? It runs until midnight.
tradinglogica.com/?src=bsq&p=f41-a-cur-auto
Date #41: Will it go up or down over the next 10 trading sessions? It runs until midnight.
tradinglogica.com/?src=bsq&p=f41-a-cur-auto
1

·
--
The daily candle closed below the 200-day moving average, and the unrealized profit on my short jumped another big step—first, the numbers; then the conclusion.
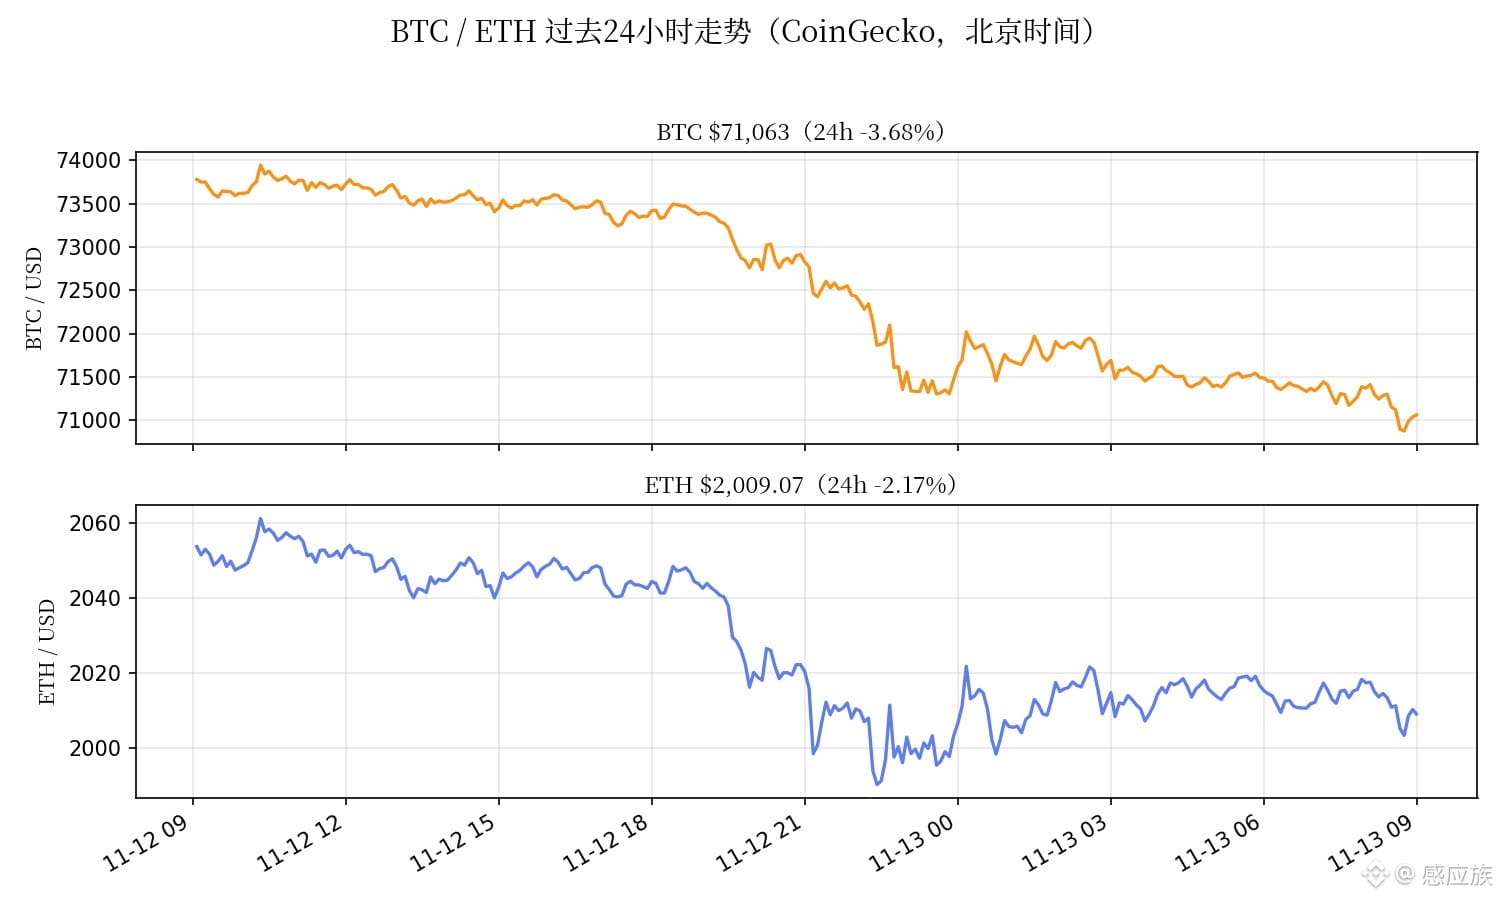
09:00: $BTC at around $71,035, down 4.0% in 24 hours; $ETH at around $2,009, down 2.4% in 24 hours (live prices from CoinGecko). The overnight low was around $71,060, the lowest since August 20 (around $71,180 according to CoinMarketCap). This morning’s 08:00 daily close was around $71,372, versus the 200-day moving average at around $73,125—the first daily close below this line since August (CoinMarketCap). The 20:00, 00:00, 04:00, and 08:00 four-hour candles all closed below $75,000, making it the 25th consecutive close below that level.
Short position update #41: Opened on November 7 at 13:00 in the $75,800–$76,100 range, with a midpoint entry of $75,950. At the current price of $71,035, the price is down 6.47%; at 100x leverage, the remaining half is showing about +647% unrealized profit—at 21:00 last night it was still +411%, so that’s an increase of 236 percentage points overnight. The add-on short (entry range $74,700–$75,000, midpoint $74,850) is up about +510% (from +270% last night). The half I closed and banked is already locked in: +362% on the original position and +220% on the add-on. Honestly, this trade is making a decent profit now, but we haven’t reached the target yet, so there’s no rush to celebrate.
Why the drop? The same few catalysts are still at play: Nvidia continued to fall after Jensen Huang’s resignation, MSCI removed Strategy from its index, and ETFs saw another roughly $300 million in outflows on Wednesday—the fifth straight day (as reported last night). After the break below the 200-day moving average, technical selling followed. CoinGlass data shows around $475 million in long liquidations in four hours (reported by CoinMarketCap). $ETH hit an overnight low of $2,002.9, less than $3 from the $2,000 level. It didn’t break, but it came down to the wire.
The plan hasn’t changed: keep holding the remaining half, with a target of $68,000. As for the $71,500 level: the 08:00 four-hour candle closed at $71,372, so it has already closed below it. Under the rule I set earlier—if price breaks below $71,500 and fails to reclaim it on a four-hour close, don’t chase the short—I won’t add to the position. I’ll hold and wait for $68,000. A rebound to $75,300–$75,500 is still an area to add to the short; if the daily candle closes back above the 200-day moving average at $73,125, or a four-hour candle closes above $76,250, I’ll admit I was wrong and exit. The stop-loss above $77,500 remains unchanged.
Tonight at 21:30, the U.S. October PPI is due (forecast: +0.4% month over month, +6.6% year over year, core +0.3%, according to a Dow Jones survey). Also, 33,902 BTC options expire, with max pain at $77,000. I won’t trade for an hour before or after the data. Do you think ETH will break below $2,000 tonight? Let’s discuss in the comments. (Prices: live CoinGecko data at 09:00 Beijing time on November 13; chart shows the past 24 hours.)
The daily candle closed below the 200-day moving average, and the unrealized profit on my short jumped another big step—first, the numbers; then the conclusion.
09:00: $BTC at around $71,035, down 4.0% in 24 hours; $ETH at around $2,009, down 2.4% in 24 hours (live prices from CoinGecko). The overnight low was around $71,060, the lowest since August 20 (around $71,180 according to CoinMarketCap). This morning’s 08:00 daily close was around $71,372, versus the 200-day moving average at around $73,125—the first daily close below this line since August (CoinMarketCap). The 20:00, 00:00, 04:00, and 08:00 four-hour candles all closed below $75,000, making it the 25th consecutive close below that level.
Short position update #41: Opened on November 7 at 13:00 in the $75,800–$76,100 range, with a midpoint entry of $75,950. At the current price of $71,035, the price is down 6.47%; at 100x leverage, the remaining half is showing about +647% unrealized profit—at 21:00 last night it was still +411%, so that’s an increase of 236 percentage points overnight. The add-on short (entry range $74,700–$75,000, midpoint $74,850) is up about +510% (from +270% last night). The half I closed and banked is already locked in: +362% on the original position and +220% on the add-on. Honestly, this trade is making a decent profit now, but we haven’t reached the target yet, so there’s no rush to celebrate.
Why the drop? The same few catalysts are still at play: Nvidia continued to fall after Jensen Huang’s resignation, MSCI removed Strategy from its index, and ETFs saw another roughly $300 million in outflows on Wednesday—the fifth straight day (as reported last night). After the break below the 200-day moving average, technical selling followed. CoinGlass data shows around $475 million in long liquidations in four hours (reported by CoinMarketCap). $ETH hit an overnight low of $2,002.9, less than $3 from the $2,000 level. It didn’t break, but it came down to the wire.
The plan hasn’t changed: keep holding the remaining half, with a target of $68,000. As for the $71,500 level: the 08:00 four-hour candle closed at $71,372, so it has already closed below it. Under the rule I set earlier—if price breaks below $71,500 and fails to reclaim it on a four-hour close, don’t chase the short—I won’t add to the position. I’ll hold and wait for $68,000. A rebound to $75,300–$75,500 is still an area to add to the short; if the daily candle closes back above the 200-day moving average at $73,125, or a four-hour candle closes above $76,250, I’ll admit I was wrong and exit. The stop-loss above $77,500 remains unchanged.
Tonight at 21:30, the U.S. October PPI is due (forecast: +0.4% month over month, +6.6% year over year, core +0.3%, according to a Dow Jones survey). Also, 33,902 BTC options expire, with max pain at $77,000. I won’t trade for an hour before or after the data. Do you think ETH will break below $2,000 tonight? Let’s discuss in the comments. (Prices: live CoinGecko data at 09:00 Beijing time on November 13; chart shows the past 24 hours.)
09:00: $BTC at around $71,035, down 4.0% in 24 hours; $ETH at around $2,009, down 2.4% in 24 hours (live prices from CoinGecko). The overnight low was around $71,060, the lowest since August 20 (around $71,180 according to CoinMarketCap). This morning’s 08:00 daily close was around $71,372, versus the 200-day moving average at around $73,125—the first daily close below this line since August (CoinMarketCap). The 20:00, 00:00, 04:00, and 08:00 four-hour candles all closed below $75,000, making it the 25th consecutive close below that level.
Short position update #41: Opened on November 7 at 13:00 in the $75,800–$76,100 range, with a midpoint entry of $75,950. At the current price of $71,035, the price is down 6.47%; at 100x leverage, the remaining half is showing about +647% unrealized profit—at 21:00 last night it was still +411%, so that’s an increase of 236 percentage points overnight. The add-on short (entry range $74,700–$75,000, midpoint $74,850) is up about +510% (from +270% last night). The half I closed and banked is already locked in: +362% on the original position and +220% on the add-on. Honestly, this trade is making a decent profit now, but we haven’t reached the target yet, so there’s no rush to celebrate.
Why the drop? The same few catalysts are still at play: Nvidia continued to fall after Jensen Huang’s resignation, MSCI removed Strategy from its index, and ETFs saw another roughly $300 million in outflows on Wednesday—the fifth straight day (as reported last night). After the break below the 200-day moving average, technical selling followed. CoinGlass data shows around $475 million in long liquidations in four hours (reported by CoinMarketCap). $ETH hit an overnight low of $2,002.9, less than $3 from the $2,000 level. It didn’t break, but it came down to the wire.
The plan hasn’t changed: keep holding the remaining half, with a target of $68,000. As for the $71,500 level: the 08:00 four-hour candle closed at $71,372, so it has already closed below it. Under the rule I set earlier—if price breaks below $71,500 and fails to reclaim it on a four-hour close, don’t chase the short—I won’t add to the position. I’ll hold and wait for $68,000. A rebound to $75,300–$75,500 is still an area to add to the short; if the daily candle closes back above the 200-day moving average at $73,125, or a four-hour candle closes above $76,250, I’ll admit I was wrong and exit. The stop-loss above $77,500 remains unchanged.
Tonight at 21:30, the U.S. October PPI is due (forecast: +0.4% month over month, +6.6% year over year, core +0.3%, according to a Dow Jones survey). Also, 33,902 BTC options expire, with max pain at $77,000. I won’t trade for an hour before or after the data. Do you think ETH will break below $2,000 tonight? Let’s discuss in the comments. (Prices: live CoinGecko data at 09:00 Beijing time on November 13; chart shows the past 24 hours.)
116

·
--
$ONE This rally looks a bit weak. The price is up just 0.91% over 15m, while OI is down around 3.6% over both 15m and 1h, with nearly 500k U in notional exposure wiped out. Price rising while open interest falls is a classic short squeeze, not fresh longs entering. With the active trade delta at -11.7% and the buy/sell ratio at 0.79, selling pressure is coming through. Volume is only 0.89x, and the Z-score is 0.50, so chasing longs doesn't offer much value. The funding rate is still in a high percentile recently, and the OI anomaly percentile is 77.8%, ranked #41 across the whole pool. This setup looks more like the afterglow of shorts being squeezed out than the start of a trend. The 24h trading volume of 549 million looks substantial, but aggressive sellers are in the lead. I'd suggest not rushing to pile in—wait for OI to recover before taking another look. $ONE
$ONE This rally looks a bit weak. The price is up just 0.91% over 15m, while OI is down around 3.6% over both 15m and 1h, with nearly 500k U in notional exposure wiped out. Price rising while open interest falls is a classic short squeeze, not fresh longs entering. With the active trade delta at -11.7% and the buy/sell ratio at 0.79, selling pressure is coming through. Volume is only 0.89x, and the Z-score is 0.50, so chasing longs doesn't offer much value. The funding rate is still in a high percentile recently, and the OI anomaly percentile is 77.8%, ranked #41 across the whole pool. This setup looks more like the afterglow of shorts being squeezed out than the start of a trend. The 24h trading volume of 549 million looks substantial, but aggressive sellers are in the lead. I'd suggest not rushing to pile in—wait for OI to recover before taking another look. $ONE
9

·
--
$ENA's $0.1838 line is back — first closed hour above it in 4 days, and it's the leg's biggest volume bar.
The tape (1h, closed candles through 14:00 UTC — the forming 15:00 hour is excluded, unclosed):
Oct 30–31: the breakdown leg — saga low $0.1658 on the $19.08M panic bar. Nov 1–3: dead-cat grind $0.169–$0.178, every bounce attempt dying under $0.1838. This morning: 06:00 tagged the line as a wick ($0.1838) and failed, 11:00 tagged $0.1853 and closed $0.1832, 12:00 rejected to $0.1792 on $1.88M.
Then 14:00 UTC: O $0.1789 → H $0.1857 → C $0.1840 on $3.71M. First closed hour above $0.1838 since Oct 31, and the heaviest hourly bar of the whole bounce. 1h RSI 63, price above EMA20 $0.1781/EMA50 $0.1767 — the bearish stack from the breakdown is gone.
Live ~$0.1880, +10.5% 24h, H $0.1895 / L $0.1673, $30.4M Binance volume / 136k trades. CoinGecko: rank #41, $2.53B mcap, 13.41B/15B circulating (89.4%), -87.6% off the $1.52 ATH, 7d -2.9%.
Honest framing: no fresh timed headline — searxng shows quote pages and stale chatter only, no roadmap/unlock news. This is flow reclaiming a broken floor, not a catalyst. And the saga's pattern is real: four of the last five reclaim attempts above $0.1838 died within hours. The $0.1973 recovery high still stands untouched.
New lines: $0.1973 (hourly close above = the bounce has legs), then $0.2047 (the decider — close back above with volume = the reclaim refusing to die). $0.1838 is now a reclaimed line — a closed hour back below = the stall un-stalls. Saga low $0.1658: closed hour below = open air.
Not a call, either way. Next verdict: the 16:00 UTC close (21:30 IST) — above $0.1973, or back under $0.1838. Which prints first?
$ENA 's $0.1838 line is back — first closed hour above it in 4 days, and it's the leg's biggest volume bar.
The tape (1h, closed candles through 14:00 UTC — the forming 15:00 hour is excluded, unclosed):
Oct 30–31: the breakdown leg — saga low $0.1658 on the $19.08M panic bar. Nov 1–3: dead-cat grind $0.169–$0.178, every bounce attempt dying under $0.1838. This morning: 06:00 tagged the line as a wick ($0.1838) and failed, 11:00 tagged $0.1853 and closed $0.1832, 12:00 rejected to $0.1792 on $1.88M.
Then 14:00 UTC: O $0.1789 → H $0.1857 → C $0.1840 on $3.71M. First closed hour above $0.1838 since Oct 31, and the heaviest hourly bar of the whole bounce. 1h RSI 63, price above EMA20 $0.1781/EMA50 $0.1767 — the bearish stack from the breakdown is gone.
Live ~$0.1880, +10.5% 24h, H $0.1895 / L $0.1673, $30.4M Binance volume / 136k trades. CoinGecko: rank #41, $2.53B mcap, 13.41B/15B circulating (89.4%), -87.6% off the $1.52 ATH, 7d -2.9%.
Honest framing: no fresh timed headline — searxng shows quote pages and stale chatter only, no roadmap/unlock news. This is flow reclaiming a broken floor, not a catalyst. And the saga's pattern is real: four of the last five reclaim attempts above $0.1838 died within hours. The $0.1973 recovery high still stands untouched.
New lines: $0.1973 (hourly close above = the bounce has legs), then $0.2047 (the decider — close back above with volume = the reclaim refusing to die). $0.1838 is now a reclaimed line — a closed hour back below = the stall un-stalls. Saga low $0.1658: closed hour below = open air.
Not a call, either way. Next verdict: the 16:00 UTC close (21:30 IST) — above $0.1973, or back under $0.1838. Which prints first?
The tape (1h, closed candles through 14:00 UTC — the forming 15:00 hour is excluded, unclosed):
Oct 30–31: the breakdown leg — saga low $0.1658 on the $19.08M panic bar. Nov 1–3: dead-cat grind $0.169–$0.178, every bounce attempt dying under $0.1838. This morning: 06:00 tagged the line as a wick ($0.1838) and failed, 11:00 tagged $0.1853 and closed $0.1832, 12:00 rejected to $0.1792 on $1.88M.
Then 14:00 UTC: O $0.1789 → H $0.1857 → C $0.1840 on $3.71M. First closed hour above $0.1838 since Oct 31, and the heaviest hourly bar of the whole bounce. 1h RSI 63, price above EMA20 $0.1781/EMA50 $0.1767 — the bearish stack from the breakdown is gone.
Live ~$0.1880, +10.5% 24h, H $0.1895 / L $0.1673, $30.4M Binance volume / 136k trades. CoinGecko: rank #41, $2.53B mcap, 13.41B/15B circulating (89.4%), -87.6% off the $1.52 ATH, 7d -2.9%.
Honest framing: no fresh timed headline — searxng shows quote pages and stale chatter only, no roadmap/unlock news. This is flow reclaiming a broken floor, not a catalyst. And the saga's pattern is real: four of the last five reclaim attempts above $0.1838 died within hours. The $0.1973 recovery high still stands untouched.
New lines: $0.1973 (hourly close above = the bounce has legs), then $0.2047 (the decider — close back above with volume = the reclaim refusing to die). $0.1838 is now a reclaimed line — a closed hour back below = the stall un-stalls. Saga low $0.1658: closed hour below = open air.
Not a call, either way. Next verdict: the 16:00 UTC close (21:30 IST) — above $0.1973, or back under $0.1838. Which prints first?
9

·
--
$AIO dropped 3.36% in 15 minutes, with volume suddenly doubling. But look closely at OI: down 3.71% over 15 minutes and 7.95% over 1 hour, with nearly 600,000 U in notional value wiped out. This isn't new shorts entering—it's longs getting liquidated, stopped out, and actively reducing their positions. Price and OI are falling in tandem, a classic deleveraging move, not trend shorts adding to their positions.
The taker flow imbalance is -6.3%, and the buy/sell ratio is 0.88, so selling pressure is present. But the funding rate is still in the higher end of its recent range, suggesting longs were too crowded before. The current level is near a historically extreme range, and this has persisted across several consecutive periods. The 5-minute close has already fallen below the lows of nearly the last 20 candles. OI is at the 96.6th percentile, ranking #41 across the entire pool—position reduction on this scale is no small move.
24-hour trading volume is nearly 50 million U, and liquidity is sufficient, but the current structure looks more like a flush-out than a crash. Don't rush to buy the dip; wait until the long leverage has been thoroughly flushed out.
$AIO dropped 3.36% in 15 minutes, with volume suddenly doubling. But look closely at OI: down 3.71% over 15 minutes and 7.95% over 1 hour, with nearly 600,000 U in notional value wiped out. This isn't new shorts entering—it's longs getting liquidated, stopped out, and actively reducing their positions. Price and OI are falling in tandem, a classic deleveraging move, not trend shorts adding to their positions.
The taker flow imbalance is -6.3%, and the buy/sell ratio is 0.88, so selling pressure is present. But the funding rate is still in the higher end of its recent range, suggesting longs were too crowded before. The current level is near a historically extreme range, and this has persisted across several consecutive periods. The 5-minute close has already fallen below the lows of nearly the last 20 candles. OI is at the 96.6th percentile, ranking #41 across the entire pool—position reduction on this scale is no small move.
24-hour trading volume is nearly 50 million U, and liquidity is sufficient, but the current structure looks more like a flush-out than a crash. Don't rush to buy the dip; wait until the long leverage has been thoroughly flushed out.
The taker flow imbalance is -6.3%, and the buy/sell ratio is 0.88, so selling pressure is present. But the funding rate is still in the higher end of its recent range, suggesting longs were too crowded before. The current level is near a historically extreme range, and this has persisted across several consecutive periods. The 5-minute close has already fallen below the lows of nearly the last 20 candles. OI is at the 96.6th percentile, ranking #41 across the entire pool—position reduction on this scale is no small move.
24-hour trading volume is nearly 50 million U, and liquidity is sufficient, but the current structure looks more like a flush-out than a crash. Don't rush to buy the dip; wait until the long leverage has been thoroughly flushed out.
2


·
--
I’ve been scanning CoinGecko’s trending list and spotted a handful of gems that could spark a move in my portfolio 🙂. The mix of low‑rank and mid‑rank tokens caught my attention, especially those with solid weekly gains.
📈 Pearl (PEARL) +12.4%, Pudgy Penguins (PENGU) +8.9%, Axis Robotics (AXIS) +15.2%, Quantus (QTC) +9.7%, Ethena (ENA) +18.3%, Jupiter (JUP) +11.5%, Pons (PONS) +7.1%. These spikes suggest growing community buzz and potential upside.
I’m keeping an eye on the market‑cap ranks—Ethena at #41 and Jupiter at #78 stand out—so I can jump in before the rally gains steam 🚀. I’ll also monitor the lower‑ranked Axis Robotics and Quantus for any surprise breakouts. Stay tuned for updates 🔎
$INIT, $BLUR, $IDOL
I’ve been scanning CoinGecko’s trending list and spotted a handful of gems that could spark a move in my portfolio 🙂. The mix of low‑rank and mid‑rank tokens caught my attention, especially those with solid weekly gains.
📈 Pearl (PEARL) +12.4%, Pudgy Penguins (PENGU) +8.9%, Axis Robotics (AXIS) +15.2%, Quantus (QTC) +9.7%, Ethena (ENA) +18.3%, Jupiter (JUP) +11.5%, Pons (PONS) +7.1%. These spikes suggest growing community buzz and potential upside.
I’m keeping an eye on the market‑cap ranks—Ethena at #41 and Jupiter at #78 stand out—so I can jump in before the rally gains steam 🚀. I’ll also monitor the lower‑ranked Axis Robotics and Quantus for any surprise breakouts. Stay tuned for updates 🔎
$INIT , $BLUR , $IDOL
📈 Pearl (PEARL) +12.4%, Pudgy Penguins (PENGU) +8.9%, Axis Robotics (AXIS) +15.2%, Quantus (QTC) +9.7%, Ethena (ENA) +18.3%, Jupiter (JUP) +11.5%, Pons (PONS) +7.1%. These spikes suggest growing community buzz and potential upside.
I’m keeping an eye on the market‑cap ranks—Ethena at #41 and Jupiter at #78 stand out—so I can jump in before the rally gains steam 🚀. I’ll also monitor the lower‑ranked Axis Robotics and Quantus for any surprise breakouts. Stay tuned for updates 🔎
$INIT , $BLUR , $IDOL
777

·
--
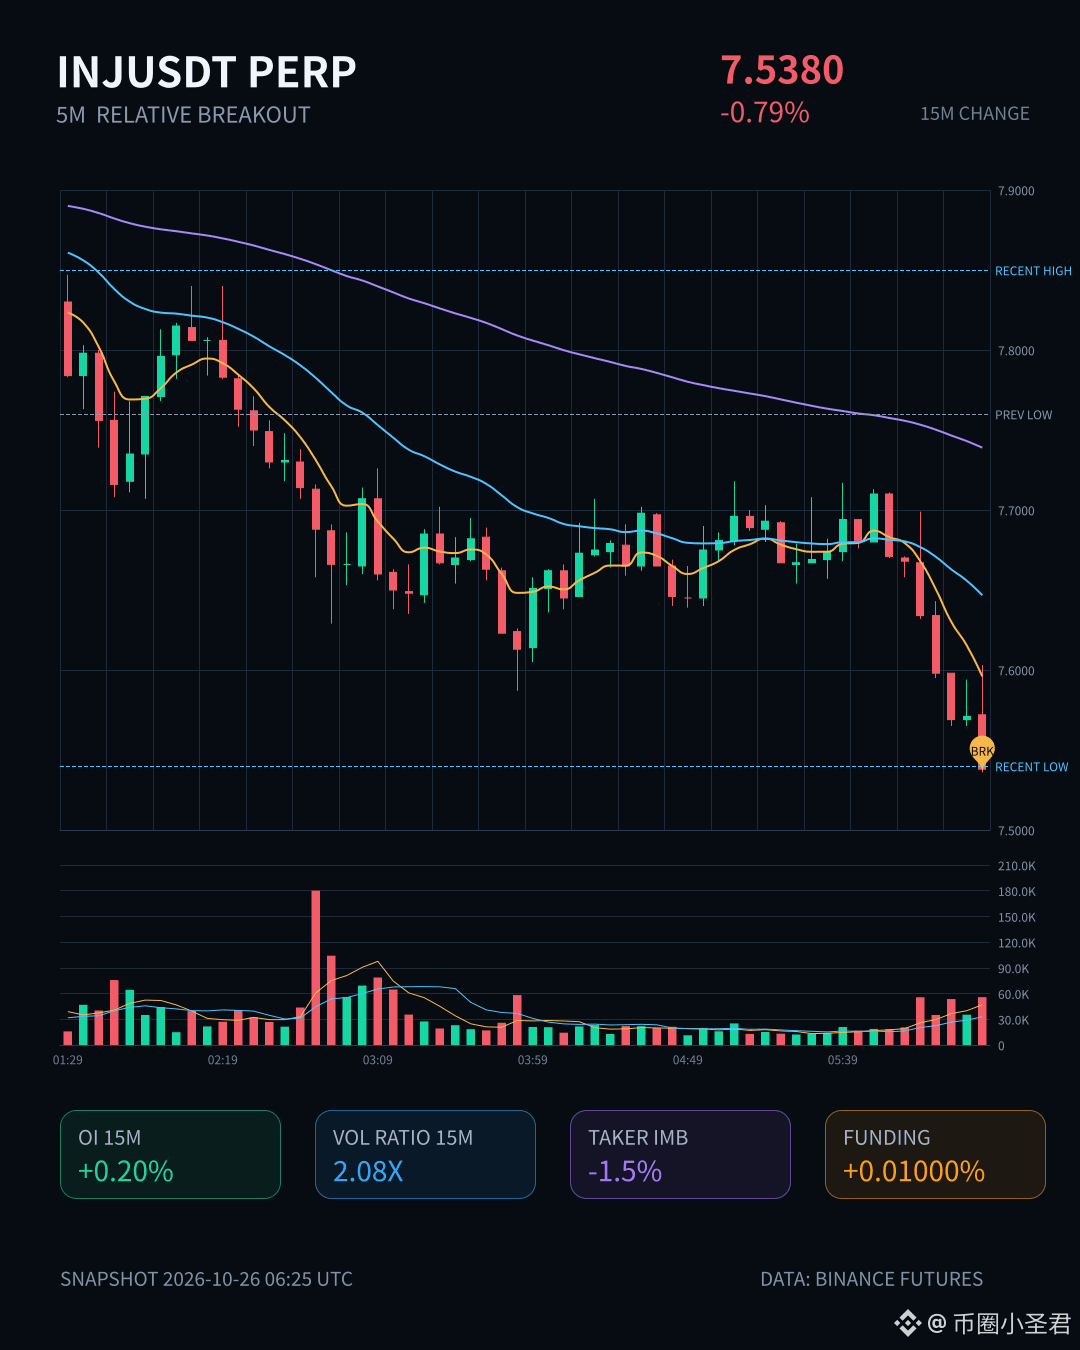
$INJ This 15m move is interesting: price fell 0.79% while OI kept rising. The 1h contract is up 0.62%, which clearly suggests new leveraged shorts are entering, rather than old longs being liquidated.
Volume came in at 2.08x, and the close fell below the lows of nearly the last 20 5m candles. Aggressive trade flow was -1.5%, and the buy/sell ratio was 0.97. Selling pressure isn't especially fierce, but the direction is consistent. The anomaly percentile is 69.6%, ranking #41 across the entire pool, while notional change ranks #35. The order book depth confirms the move.
With this kind of setup, I generally wouldn't rush to buy the dip. New shorts are pushing the price down; I'll wait to see a divergence between OI and price. The 24h trading volume is 64M, so liquidity is sufficient, but that also means price at this level can easily get swept back and forth. I'll keep watching for now.
$INJ This 15m move is interesting: price fell 0.79% while OI kept rising. The 1h contract is up 0.62%, which clearly suggests new leveraged shorts are entering, rather than old longs being liquidated.
Volume came in at 2.08x, and the close fell below the lows of nearly the last 20 5m candles. Aggressive trade flow was -1.5%, and the buy/sell ratio was 0.97. Selling pressure isn't especially fierce, but the direction is consistent. The anomaly percentile is 69.6%, ranking #41 across the entire pool, while notional change ranks #35. The order book depth confirms the move.
With this kind of setup, I generally wouldn't rush to buy the dip. New shorts are pushing the price down; I'll wait to see a divergence between OI and price. The 24h trading volume is 64M, so liquidity is sufficient, but that also means price at this level can easily get swept back and forth. I'll keep watching for now.
Volume came in at 2.08x, and the close fell below the lows of nearly the last 20 5m candles. Aggressive trade flow was -1.5%, and the buy/sell ratio was 0.97. Selling pressure isn't especially fierce, but the direction is consistent. The anomaly percentile is 69.6%, ranking #41 across the entire pool, while notional change ranks #35. The order book depth confirms the move.
With this kind of setup, I generally wouldn't rush to buy the dip. New shorts are pushing the price down; I'll wait to see a divergence between OI and price. The 24h trading volume is 64M, so liquidity is sufficient, but that also means price at this level can easily get swept back and forth. I'll keep watching for now.
5

·
--
Bullish
DAY 6: THE FINAL PUSH IS ON!
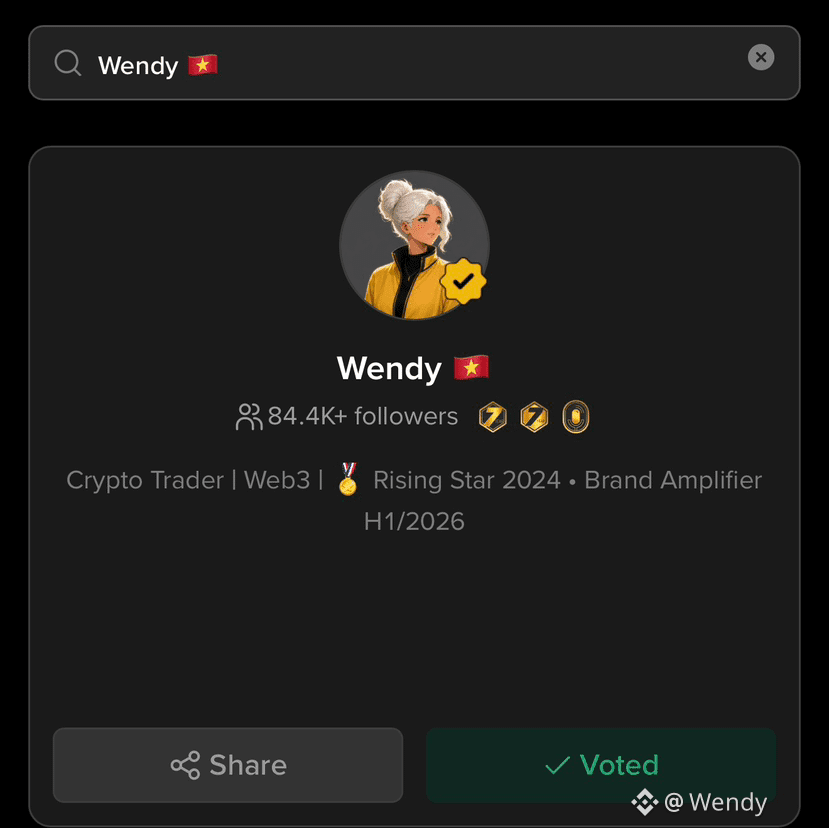
I’m currently #41 in Rising Star, and the finish line is getting closer!
Your support means everything. Let’s climb higher together! ❤️
🌟 Vote for me:
[https://app.binance.com/uni-qr/cact26user/681](https://app.binance.com/uni-qr/cact26user/681?uc=app_square_share_link&us=copylink)
#TheBlockchain100 #BinanceSquare $BTC $BNB
DAY 6: THE FINAL PUSH IS ON!
I’m currently #41 in Rising Star, and the finish line is getting closer!
Your support means everything. Let’s climb higher together! ❤️
🌟 Vote for me:
https://app.binance.com/uni-qr/cact26user/681
#TheBlockchain100 #BinanceSquare $BTC $BNB
I’m currently #41 in Rising Star, and the finish line is getting closer!
Your support means everything. Let’s climb higher together! ❤️
🌟 Vote for me:
https://app.binance.com/uni-qr/cact26user/681
#TheBlockchain100 #BinanceSquare $BTC $BNB

Wendy 🇻🇳
·
--
🏆 DAY 5: WE’RE CLIMBING 💛
Thank you all for your incredible support! 💛 Let’s keep climbing together!
Vote for my friend:
https://app.binance.com/uni-qr/cact26user/358
Vote for me:
https://app.binance.com/uni-qr/cact26user/681
#Binance #Theblockchain100 #BinanceBlockchainWeek $BTC $ETH $BNB
Thank you all for your incredible support! 💛 Let’s keep climbing together!
Vote for my friend:
https://app.binance.com/uni-qr/cact26user/358
Vote for me:
https://app.binance.com/uni-qr/cact26user/681
#Binance #Theblockchain100 #BinanceBlockchainWeek $BTC $ETH $BNB
958
2
61
958

·
--
$COMP short position opened—going in with 75X leverage! 🔥
🎯 Live trade
$COMP Perpetual · SHORT · 75X
Average entry price: 25.78 USDT, precise market entry
Funds are redacted; only the levels and reasoning are shown
🧠 Why go short here?
This trade isn’t a guess—it’s a right-side reversal point identified by LLM strategy #41 :
• 24h surge of +18.43%, followed by another +4.13% in 1h—the sentiment is overheated
• 15m RSI = 81.2 and 5m RSI = 80.0: overbought signals aligned across both timeframes
• Price pulled back -0.84% from the high of 25.9425, triggering the ≥0.8% reversal condition
• 5m MACD red bars are shrinking, showing clear weakening in bullish momentum
• RVOL at 2.84x on elevated volume, confirming high-level turnover
Spot overbought conditions on the left, wait for a reversal on the right—only pull the trigger when both conditions are met.
🛡️ Risk management and discipline
TP1 24.6728 / TP2 23.8832 / SL 26.3837
Risk-reward ratio: 2.8:1; stop-loss set about 2.5% above the previous high
Holding window: 20–60 minutes. If it hasn’t moved +0.3% beyond the breakeven zone after 30 minutes, exit with a time-based stop-loss.
No holding on, no adding to the position, no guessing the bottom—execute exactly at the levels the strategy gives.
Did you follow this trade? Or do you think 75X is too aggressive? Share your thoughts in the comments 👇
#币安合约 #实盘战报 #量化交易 #COMP
$COMP short position opened—going in with 75X leverage! 🔥
🎯 Live trade
$COMP Perpetual · SHORT · 75X
Average entry price: 25.78 USDT, precise market entry
Funds are redacted; only the levels and reasoning are shown
🧠 Why go short here?
This trade isn’t a guess—it’s a right-side reversal point identified by LLM strategy #41 :
• 24h surge of +18.43%, followed by another +4.13% in 1h—the sentiment is overheated
• 15m RSI = 81.2 and 5m RSI = 80.0: overbought signals aligned across both timeframes
• Price pulled back -0.84% from the high of 25.9425, triggering the ≥0.8% reversal condition
• 5m MACD red bars are shrinking, showing clear weakening in bullish momentum
• RVOL at 2.84x on elevated volume, confirming high-level turnover
Spot overbought conditions on the left, wait for a reversal on the right—only pull the trigger when both conditions are met.
🛡️ Risk management and discipline
TP1 24.6728 / TP2 23.8832 / SL 26.3837
Risk-reward ratio: 2.8:1; stop-loss set about 2.5% above the previous high
Holding window: 20–60 minutes. If it hasn’t moved +0.3% beyond the breakeven zone after 30 minutes, exit with a time-based stop-loss.
No holding on, no adding to the position, no guessing the bottom—execute exactly at the levels the strategy gives.
Did you follow this trade? Or do you think 75X is too aggressive? Share your thoughts in the comments 👇
#币安合约 #实盘战报 #量化交易 #COMP
🎯 Live trade
$COMP Perpetual · SHORT · 75X
Average entry price: 25.78 USDT, precise market entry
Funds are redacted; only the levels and reasoning are shown
🧠 Why go short here?
This trade isn’t a guess—it’s a right-side reversal point identified by LLM strategy #41 :
• 24h surge of +18.43%, followed by another +4.13% in 1h—the sentiment is overheated
• 15m RSI = 81.2 and 5m RSI = 80.0: overbought signals aligned across both timeframes
• Price pulled back -0.84% from the high of 25.9425, triggering the ≥0.8% reversal condition
• 5m MACD red bars are shrinking, showing clear weakening in bullish momentum
• RVOL at 2.84x on elevated volume, confirming high-level turnover
Spot overbought conditions on the left, wait for a reversal on the right—only pull the trigger when both conditions are met.
🛡️ Risk management and discipline
TP1 24.6728 / TP2 23.8832 / SL 26.3837
Risk-reward ratio: 2.8:1; stop-loss set about 2.5% above the previous high
Holding window: 20–60 minutes. If it hasn’t moved +0.3% beyond the breakeven zone after 30 minutes, exit with a time-based stop-loss.
No holding on, no adding to the position, no guessing the bottom—execute exactly at the levels the strategy gives.
Did you follow this trade? Or do you think 75X is too aggressive? Share your thoughts in the comments 👇
#币安合约 #实盘战报 #量化交易 #COMP
188

·
--
We're excited to share the latest trending tokens on CoinGecko 💰. Our community is always looking for the next big thing, and we're happy to provide the latest updates. We've got our eyes on Zama, Solana, and DeXe, among others.
We're seeing some significant movements in the market, with Solana and Ethereum holding strong positions. Zcash and Ondo are also gaining traction, with market cap ranks of #15 and #41, respectively. Meanwhile, Cash Cat is lurking at #411, waiting for its chance to shine 🚀.
We're confident that our community will find this information useful in making informed decisions 📊. As we continue to monitor the market, we're excited to see which tokens will rise to the top next 🔥. We're committed to keeping our community up-to-date on the latest trends and market movements.
$BANK, $DODO, $ON
We're excited to share the latest trending tokens on CoinGecko 💰. Our community is always looking for the next big thing, and we're happy to provide the latest updates. We've got our eyes on Zama, Solana, and DeXe, among others.
We're seeing some significant movements in the market, with Solana and Ethereum holding strong positions. Zcash and Ondo are also gaining traction, with market cap ranks of #15 and #41, respectively. Meanwhile, Cash Cat is lurking at #411, waiting for its chance to shine 🚀.
We're confident that our community will find this information useful in making informed decisions 📊. As we continue to monitor the market, we're excited to see which tokens will rise to the top next 🔥. We're committed to keeping our community up-to-date on the latest trends and market movements.
$BANK , $DODO , $ON
We're seeing some significant movements in the market, with Solana and Ethereum holding strong positions. Zcash and Ondo are also gaining traction, with market cap ranks of #15 and #41, respectively. Meanwhile, Cash Cat is lurking at #411, waiting for its chance to shine 🚀.
We're confident that our community will find this information useful in making informed decisions 📊. As we continue to monitor the market, we're excited to see which tokens will rise to the top next 🔥. We're committed to keeping our community up-to-date on the latest trends and market movements.
$BANK , $DODO , $ON
124

·
--
$TAO got stuck at $197—can’t go up or down. The chart is in a very typical low-range consolidation phase. Over the past 30 days, it ground down from $215 to $191. The overall focus has shifted lower, but the $187 to $200 range has been tested repeatedly: shorts haven’t been able to break it down, and longs can’t push it higher. The most interesting part was July 10: trading volume suddenly surged to $385M, price spiked to $214, and then was immediately pushed back down. After that, volume gradually shrank all the way to just over $60M—suggesting that some funds tried to make a move once, failed, and then everyone started waiting for the next excuse.
Market cap rank #41. For an AI-sector token of this size, a $102M daily trading volume isn’t healthy, but it’s not to the point of illiquidity either. It’s still 74% away from its ATH. In the past year, it’s fallen nearly 45%. $TAO is no longer that once-hyped star pick—its current pricing logic is more like: someone still cares about it, but nobody is in a rush to buy.
What I care about most is that the $190 level has been tested repeatedly without ever breaking down. This isn’t something that retail investors alone can hold up. If next the volume can rise back above $150M and the price holds $195, then the bottom structure remains intact. But if $190 is broken down decisively on high volume, there won’t be any meaningful psychological support levels below.
The real disagreement comes down to this: is the current sideways action buildup energy after chips have been absorbed, or is it a turnover platform during a continuation lower? The market hasn’t answered yet—volume will be the first thing to speak.
$TAO got stuck at $197—can’t go up or down. The chart is in a very typical low-range consolidation phase. Over the past 30 days, it ground down from $215 to $191. The overall focus has shifted lower, but the $187 to $200 range has been tested repeatedly: shorts haven’t been able to break it down, and longs can’t push it higher. The most interesting part was July 10: trading volume suddenly surged to $385M, price spiked to $214, and then was immediately pushed back down. After that, volume gradually shrank all the way to just over $60M—suggesting that some funds tried to make a move once, failed, and then everyone started waiting for the next excuse.
Market cap rank #41. For an AI-sector token of this size, a $102M daily trading volume isn’t healthy, but it’s not to the point of illiquidity either. It’s still 74% away from its ATH. In the past year, it’s fallen nearly 45%. $TAO is no longer that once-hyped star pick—its current pricing logic is more like: someone still cares about it, but nobody is in a rush to buy.
What I care about most is that the $190 level has been tested repeatedly without ever breaking down. This isn’t something that retail investors alone can hold up. If next the volume can rise back above $150M and the price holds $195, then the bottom structure remains intact. But if $190 is broken down decisively on high volume, there won’t be any meaningful psychological support levels below.
The real disagreement comes down to this: is the current sideways action buildup energy after chips have been absorbed, or is it a turnover platform during a continuation lower? The market hasn’t answered yet—volume will be the first thing to speak.
Market cap rank #41. For an AI-sector token of this size, a $102M daily trading volume isn’t healthy, but it’s not to the point of illiquidity either. It’s still 74% away from its ATH. In the past year, it’s fallen nearly 45%. $TAO is no longer that once-hyped star pick—its current pricing logic is more like: someone still cares about it, but nobody is in a rush to buy.
What I care about most is that the $190 level has been tested repeatedly without ever breaking down. This isn’t something that retail investors alone can hold up. If next the volume can rise back above $150M and the price holds $195, then the bottom structure remains intact. But if $190 is broken down decisively on high volume, there won’t be any meaningful psychological support levels below.
The real disagreement comes down to this: is the current sideways action buildup energy after chips have been absorbed, or is it a turnover platform during a continuation lower? The market hasn’t answered yet—volume will be the first thing to speak.
27

·
--
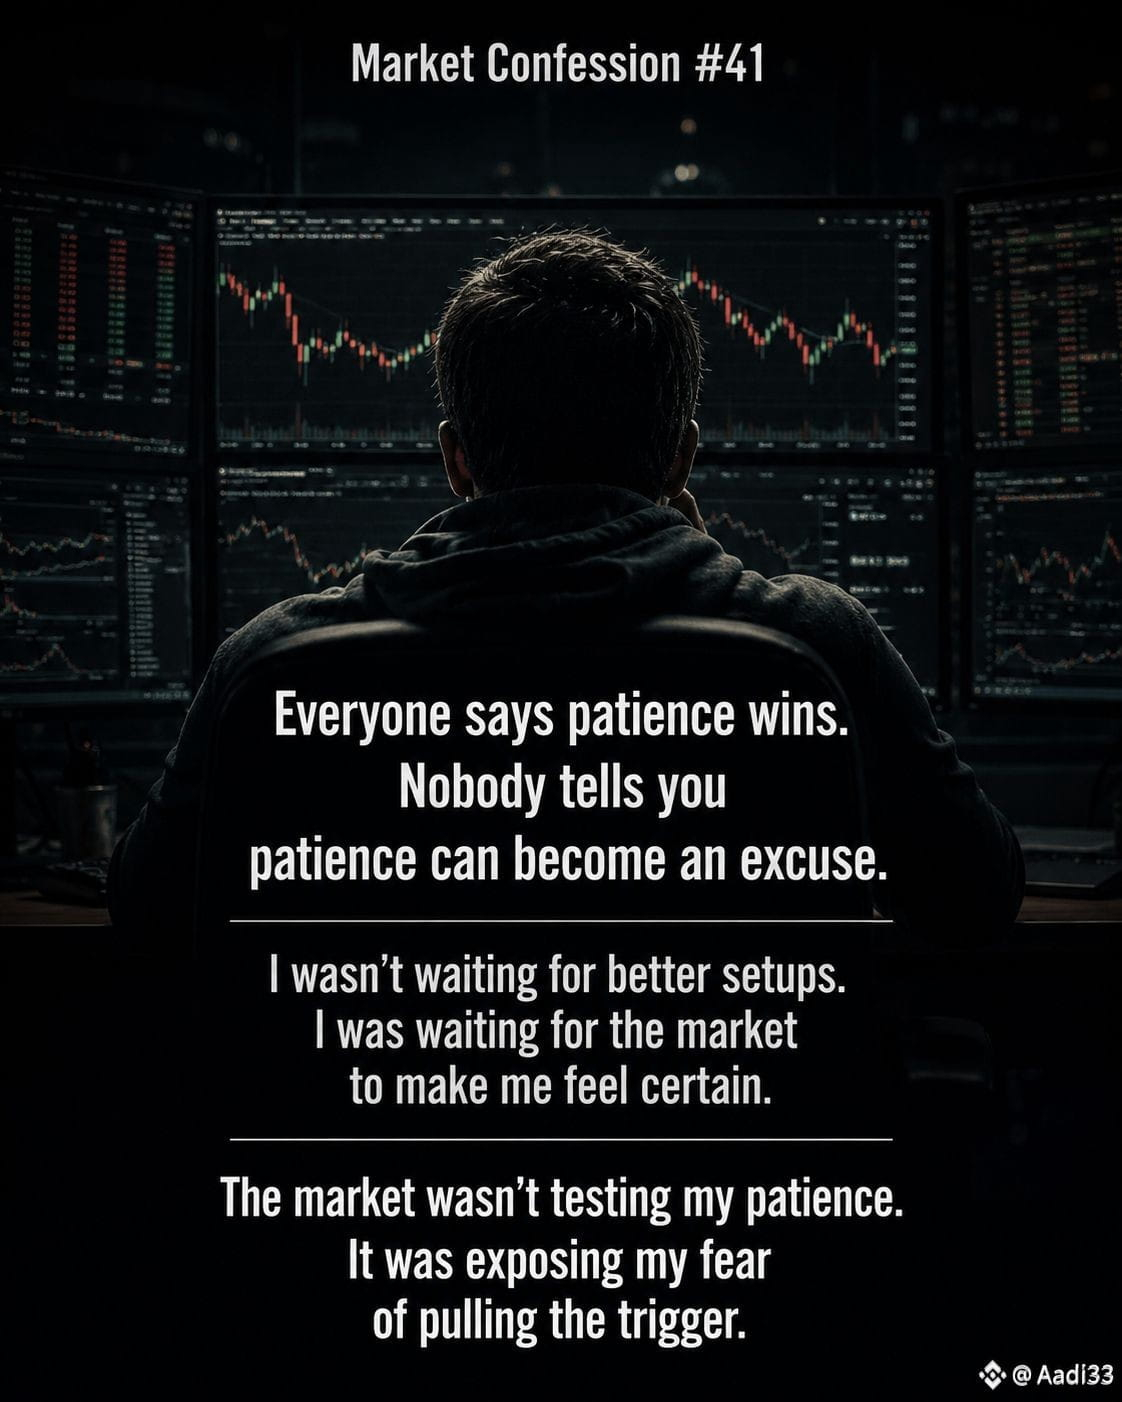
Market Confession #41
Everyone says patience wins.
Nobody tells you that patience can quietly turn into an excuse.
I kept telling myself I was waiting for the perfect setup.
The truth was...
I was waiting for the market to make me feel certain.
Every chart looked almost right.
Every entry felt like it needed one more confirmation.
So I waited.
And while I waited...
The best opportunities came and went without me.
The only trades I seemed confident enough to take...
Were the ones I shouldn't have touched.
That's when I realized,
I wasn't protecting my capital.
I was protecting myself from the feeling of being wrong.
The market wasn't testing my patience.
It was exposing how badly I needed certainty before taking action.
And in trading...
Certainty usually arrives after the move is over.
👇 Tell me honestly...
What's cost you more...
Impatience or hesitation?
#CryptoPsychology #TraderMindset
$BTC $ETH $BNB
Market Confession #41
Everyone says patience wins.
Nobody tells you that patience can quietly turn into an excuse.
I kept telling myself I was waiting for the perfect setup.
The truth was...
I was waiting for the market to make me feel certain.
Every chart looked almost right.
Every entry felt like it needed one more confirmation.
So I waited.
And while I waited...
The best opportunities came and went without me.
The only trades I seemed confident enough to take...
Were the ones I shouldn't have touched.
That's when I realized,
I wasn't protecting my capital.
I was protecting myself from the feeling of being wrong.
The market wasn't testing my patience.
It was exposing how badly I needed certainty before taking action.
And in trading...
Certainty usually arrives after the move is over.
👇 Tell me honestly...
What's cost you more...
Impatience or hesitation?
#CryptoPsychology #TraderMindset
$BTC $ETH $BNB
Everyone says patience wins.
Nobody tells you that patience can quietly turn into an excuse.
I kept telling myself I was waiting for the perfect setup.
The truth was...
I was waiting for the market to make me feel certain.
Every chart looked almost right.
Every entry felt like it needed one more confirmation.
So I waited.
And while I waited...
The best opportunities came and went without me.
The only trades I seemed confident enough to take...
Were the ones I shouldn't have touched.
That's when I realized,
I wasn't protecting my capital.
I was protecting myself from the feeling of being wrong.
The market wasn't testing my patience.
It was exposing how badly I needed certainty before taking action.
And in trading...
Certainty usually arrives after the move is over.
👇 Tell me honestly...
What's cost you more...
Impatience or hesitation?
#CryptoPsychology #TraderMindset
$BTC $ETH $BNB
5
461

·
--
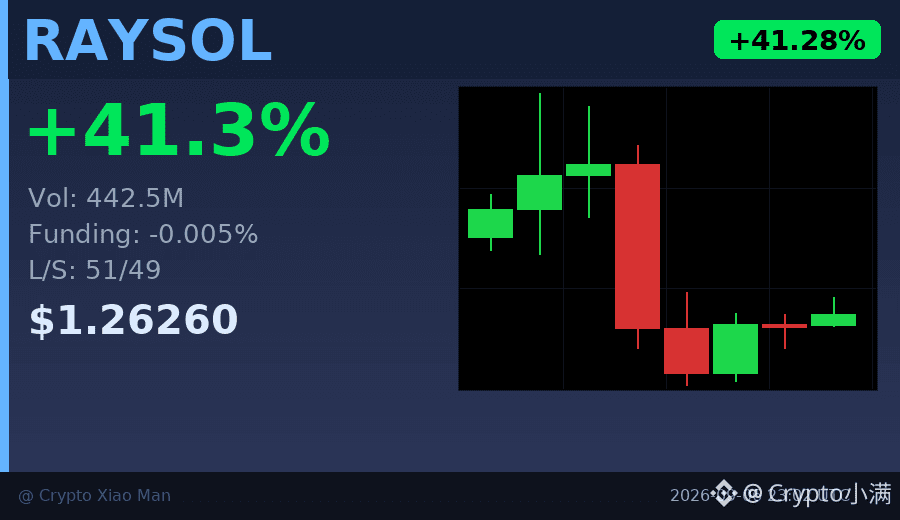
41% gain, but the funding rate is negative — that’s unusual.
RAYSOL’s trading volume today surged to $440 million, with the price rising from 0.89 to 1.44 before pulling back to 1.26.
Most people would chase a move like this, but in practice, nearly half of the open positions are short.
I think this suggests two things: first, this rally is mainly driven by spot buying, not leveraged positioning;
second, the 8-hour trend is already weakening, and those buying at the top are starting to hesitate.
In a market like this, I usually wouldn’t rush in. I’d wait for it to stabilize before taking a look.
$RAYSOL #资金费率背离 #41%
Click the card below to quickly view the market👇
41% gain, but the funding rate is negative — that’s unusual.
RAYSOL’s trading volume today surged to $440 million, with the price rising from 0.89 to 1.44 before pulling back to 1.26.
Most people would chase a move like this, but in practice, nearly half of the open positions are short.
I think this suggests two things: first, this rally is mainly driven by spot buying, not leveraged positioning;
second, the 8-hour trend is already weakening, and those buying at the top are starting to hesitate.
In a market like this, I usually wouldn’t rush in. I’d wait for it to stabilize before taking a look.
$RAYSOL #资金费率背离 #41%
Click the card below to quickly view the market👇
RAYSOL’s trading volume today surged to $440 million, with the price rising from 0.89 to 1.44 before pulling back to 1.26.
Most people would chase a move like this, but in practice, nearly half of the open positions are short.
I think this suggests two things: first, this rally is mainly driven by spot buying, not leveraged positioning;
second, the 8-hour trend is already weakening, and those buying at the top are starting to hesitate.
In a market like this, I usually wouldn’t rush in. I’d wait for it to stabilize before taking a look.
$RAYSOL #资金费率背离 #41%
Click the card below to quickly view the market👇
18

This is a move that could signal something bigger: a Bitcoin treasury firm just sold nearly half its holdings. What does that mean for the market?
The sale was reported by Decrypt, and it involved Empery Digital, a Bitcoin treasury firm, unloading a significant portion of its holdings for $87 million. Analysts are still projecting long-term price ranges for Bitcoin by 2029, though opinions vary widely on whether those targets are realistic.
—
For educational purposes only. Not financial advice.
📌 Crypto 101 · #41 · #CryptoEducation #CryptoSighted $BTC
This is a move that could signal something bigger: a Bitcoin treasury firm just sold nearly half its holdings. What does that mean for the market?
The sale was reported by Decrypt, and it involved Empery Digital, a Bitcoin treasury firm, unloading a significant portion of its holdings for $87 million. Analysts are still projecting long-term price ranges for Bitcoin by 2029, though opinions vary widely on whether those targets are realistic.
—
For educational purposes only. Not financial advice.
📌 Crypto 101 · #41 · #CryptoEducation #CryptoSighted $BTC
The sale was reported by Decrypt, and it involved Empery Digital, a Bitcoin treasury firm, unloading a significant portion of its holdings for $87 million. Analysts are still projecting long-term price ranges for Bitcoin by 2029, though opinions vary widely on whether those targets are realistic.
—
For educational purposes only. Not financial advice.
📌 Crypto 101 · #41 · #CryptoEducation #CryptoSighted $BTC
22

·
--
ONDO SURGES WITH BULLISH MOMENTUM 🚀📈
The 27% rally in $ONDO is anchored in a break of the 4‑hour order block that held the $0.408‑$0.426 range, thrusting the token past $0.525 with a volume surge to $747 M 🔥. CoinGecko’s #41 ranking adds a social‑bias catalyst, while market liquidity is re‑routing capital into altcoins.
Price action now rides a steep upward channel, testing the $0.52665 resistance that aligns with the prior swing high. A retest of the $0.468 mid‑range would likely solidify the bullish bias, and order‑flow imbalance suggests further upside pressure as institutional takers chase the breakout. The next hurdle sits near $0.540, where a confluence of volume nodes and a supply dip could fuel a second wave 📈.
Momentum acceleration is evident in the tightening of the 1‑hour ATR and a rising imbalance on the buy side, hinting that the thrust may extend beyond today’s session. Should the token hold above $0.525, structural momentum points toward a multi‑day rally rather than a flash spike 🚀.
Levels to monitor:
Watching support around $0.408
Structure suggests resistance near $0.540
Mid range area: $0.468
DYOR
Follow for Updates
#ONDO #GENERAL_ALTCOIN #CryptoTrending #BinanceSquare
ONDO SURGES WITH BULLISH MOMENTUM 🚀📈
The 27% rally in $ONDO is anchored in a break of the 4‑hour order block that held the $0.408‑$0.426 range, thrusting the token past $0.525 with a volume surge to $747 M 🔥. CoinGecko’s #41 ranking adds a social‑bias catalyst, while market liquidity is re‑routing capital into altcoins.
Price action now rides a steep upward channel, testing the $0.52665 resistance that aligns with the prior swing high. A retest of the $0.468 mid‑range would likely solidify the bullish bias, and order‑flow imbalance suggests further upside pressure as institutional takers chase the breakout. The next hurdle sits near $0.540, where a confluence of volume nodes and a supply dip could fuel a second wave 📈.
Momentum acceleration is evident in the tightening of the 1‑hour ATR and a rising imbalance on the buy side, hinting that the thrust may extend beyond today’s session. Should the token hold above $0.525, structural momentum points toward a multi‑day rally rather than a flash spike 🚀.
Levels to monitor:
Watching support around $0.408
Structure suggests resistance near $0.540
Mid range area: $0.468
DYOR
Follow for Updates
#ONDO #GENERAL_ALTCOIN #CryptoTrending #BinanceSquare
The 27% rally in $ONDO is anchored in a break of the 4‑hour order block that held the $0.408‑$0.426 range, thrusting the token past $0.525 with a volume surge to $747 M 🔥. CoinGecko’s #41 ranking adds a social‑bias catalyst, while market liquidity is re‑routing capital into altcoins.
Price action now rides a steep upward channel, testing the $0.52665 resistance that aligns with the prior swing high. A retest of the $0.468 mid‑range would likely solidify the bullish bias, and order‑flow imbalance suggests further upside pressure as institutional takers chase the breakout. The next hurdle sits near $0.540, where a confluence of volume nodes and a supply dip could fuel a second wave 📈.
Momentum acceleration is evident in the tightening of the 1‑hour ATR and a rising imbalance on the buy side, hinting that the thrust may extend beyond today’s session. Should the token hold above $0.525, structural momentum points toward a multi‑day rally rather than a flash spike 🚀.
Levels to monitor:
Watching support around $0.408
Structure suggests resistance near $0.540
Mid range area: $0.468
DYOR
Follow for Updates
#ONDO #GENERAL_ALTCOIN #CryptoTrending #BinanceSquare
26

·
--
Growing 2.5%—But Why Should You Sell 'Now?Aave (AAVEUSDT) is trending right now!
Rank: #41
Shocking truth: While it rose 2.49% yesterday, the price is still “winking.” On the morning of 2026‑09‑29, it reached the $2,732.22 level; the 24-hour volume is $805.75M—this is the biggest liquidity inflow of the week! 🚀 So, does this mean Bitcoin is “turning its back”? My counterview is clear: Most traders say they’re in the “down,” but instead of “a drop,” I see an “unusual consolidation.” The price stays below the 30-day average on one hand, while at the same time the support level’s 7,000‑8,000 band still holds a strong pool of buyers. So, instead of expecting a “pump,” it might be smart to observe with a “re-buy” strategy rather than a “short.” On the other hand, there’s a real “alpha” opportunity in the altcoin space. AVAX (AVAXUSDT) jumped to the $11.957 level with +14.148% in 24 hours; volume is $91.96M and the number of trades is 797k. This doesn’t look like a “pump-and-dump” scheme—the price is moving in a tight channel between $10.145 and $11.964. Low volatility, high volume, and a clear “buy-the-dip” signal: Personally, I’m considering opening a 10-15% DCA (Dollar-Cost-Average) plan on AVAX. Another move to consider is LINK (LINKUSDT), up +9.027% to $15.339; daily volume is $148.56M, providing solid liquidity inflow. Chainlink’s data oracles are still the backbone of the DeFi ecosystem, creating an attractive foundation for a long-term “hold-and-earn” strategy. Counterview: Some analysts are looking at the “muted” performance of NEAR and LTC and are avoiding risk
Growing 2.5%—But Why Should You Sell 'Now?
Aave (AAVEUSDT) is trending right now!
Rank: #41
Shocking truth: While it rose 2.49% yesterday, the price is still “winking.” On the morning of 2026‑09‑29, it reached the $2,732.22 level; the 24-hour volume is $805.75M—this is the biggest liquidity inflow of the week! 🚀 So, does this mean Bitcoin is “turning its back”? My counterview is clear: Most traders say they’re in the “down,” but instead of “a drop,” I see an “unusual consolidation.” The price stays below the 30-day average on one hand, while at the same time the support level’s 7,000‑8,000 band still holds a strong pool of buyers. So, instead of expecting a “pump,” it might be smart to observe with a “re-buy” strategy rather than a “short.” On the other hand, there’s a real “alpha” opportunity in the altcoin space. AVAX (AVAXUSDT) jumped to the $11.957 level with +14.148% in 24 hours; volume is $91.96M and the number of trades is 797k. This doesn’t look like a “pump-and-dump” scheme—the price is moving in a tight channel between $10.145 and $11.964. Low volatility, high volume, and a clear “buy-the-dip” signal: Personally, I’m considering opening a 10-15% DCA (Dollar-Cost-Average) plan on AVAX. Another move to consider is LINK (LINKUSDT), up +9.027% to $15.339; daily volume is $148.56M, providing solid liquidity inflow. Chainlink’s data oracles are still the backbone of the DeFi ecosystem, creating an attractive foundation for a long-term “hold-and-earn” strategy. Counterview: Some analysts are looking at the “muted” performance of NEAR and LTC and are avoiding risk
Rank: #41
Shocking truth: While it rose 2.49% yesterday, the price is still “winking.” On the morning of 2026‑09‑29, it reached the $2,732.22 level; the 24-hour volume is $805.75M—this is the biggest liquidity inflow of the week! 🚀 So, does this mean Bitcoin is “turning its back”? My counterview is clear: Most traders say they’re in the “down,” but instead of “a drop,” I see an “unusual consolidation.” The price stays below the 30-day average on one hand, while at the same time the support level’s 7,000‑8,000 band still holds a strong pool of buyers. So, instead of expecting a “pump,” it might be smart to observe with a “re-buy” strategy rather than a “short.” On the other hand, there’s a real “alpha” opportunity in the altcoin space. AVAX (AVAXUSDT) jumped to the $11.957 level with +14.148% in 24 hours; volume is $91.96M and the number of trades is 797k. This doesn’t look like a “pump-and-dump” scheme—the price is moving in a tight channel between $10.145 and $11.964. Low volatility, high volume, and a clear “buy-the-dip” signal: Personally, I’m considering opening a 10-15% DCA (Dollar-Cost-Average) plan on AVAX. Another move to consider is LINK (LINKUSDT), up +9.027% to $15.339; daily volume is $148.56M, providing solid liquidity inflow. Chainlink’s data oracles are still the backbone of the DeFi ecosystem, creating an attractive foundation for a long-term “hold-and-earn” strategy. Counterview: Some analysts are looking at the “muted” performance of NEAR and LTC and are avoiding risk
18
·
--
Over the past 24 hours the Binance Square radar spotted a fresh wave of movers on CoinGecko. Here’s what caught our eye: Lighter (LIT) +12.4 %, Pudgy Penguins (PENGU) +9.8 %, Quant (QNT) +7.1 %, Backpack (BP) +5.6 % 🚀. These tokens are climbing fast and could shape the next market swing.
Meanwhile NEAR Protocol (NEAR) surged +14.2 % to sit at rank 21, while Pump.fun (PUMP) rallied +11.0 % holding the #41 spot. Grass (GRASS) added +8.3 % despite a #110 ranking, showing depth beyond the top‑50. We’re seeing a blend of established projects and newer community‑driven gems gaining traction, a pattern that often precedes broader rallies. Our community’s sentiment metrics also turned bullish, with social mentions up 22 % across Discord and Twitter.
With these moves, we recommend keeping an eye on the upside potential while managing risk. Diversify across the highlighted assets, set realistic stop‑losses, and stay tuned to on‑chain signals. As always, our tools and alerts are here to help you navigate the volatility and capture opportunities 🚦. Happy trading, and let’s ride the next wave together!
$MOVR, $QNT, $SOON
Over the past 24 hours the Binance Square radar spotted a fresh wave of movers on CoinGecko. Here’s what caught our eye: Lighter (LIT) +12.4 %, Pudgy Penguins (PENGU) +9.8 %, Quant (QNT) +7.1 %, Backpack (BP) +5.6 % 🚀. These tokens are climbing fast and could shape the next market swing.
Meanwhile NEAR Protocol (NEAR) surged +14.2 % to sit at rank 21, while Pump.fun (PUMP) rallied +11.0 % holding the #41 spot. Grass (GRASS) added +8.3 % despite a #110 ranking, showing depth beyond the top‑50. We’re seeing a blend of established projects and newer community‑driven gems gaining traction, a pattern that often precedes broader rallies. Our community’s sentiment metrics also turned bullish, with social mentions up 22 % across Discord and Twitter.
With these moves, we recommend keeping an eye on the upside potential while managing risk. Diversify across the highlighted assets, set realistic stop‑losses, and stay tuned to on‑chain signals. As always, our tools and alerts are here to help you navigate the volatility and capture opportunities 🚦. Happy trading, and let’s ride the next wave together!
$MOVR , $QNT , $SOON
Meanwhile NEAR Protocol (NEAR) surged +14.2 % to sit at rank 21, while Pump.fun (PUMP) rallied +11.0 % holding the #41 spot. Grass (GRASS) added +8.3 % despite a #110 ranking, showing depth beyond the top‑50. We’re seeing a blend of established projects and newer community‑driven gems gaining traction, a pattern that often precedes broader rallies. Our community’s sentiment metrics also turned bullish, with social mentions up 22 % across Discord and Twitter.
With these moves, we recommend keeping an eye on the upside potential while managing risk. Diversify across the highlighted assets, set realistic stop‑losses, and stay tuned to on‑chain signals. As always, our tools and alerts are here to help you navigate the volatility and capture opportunities 🚦. Happy trading, and let’s ride the next wave together!
$MOVR , $QNT , $SOON
474

·
--
Watch out! CT surges 3.4% at a key time—where to buy on a pullback?At 22:52 (8 minutes ago), CT surged 3.4% at a key time (5-minute window: 22:47→22:52). As of 23:00:57, the current price is 0.3103, down 11.7% over 24h. M and LYN also made notable moves around the same time.
📅 Data as of 23:00:57 (event trigger times are shown in each item; prices are real-time snapshots taken when this was written)
📌 In a nutshell: Moves around key periods (candle closes / U.S. market open and close) often involve institutional players, making them more credible signals.
Market overview: BTC 82,987.60 (+0.40%) · ETH 2,489.55 (-1.62%); across the market, 121 gainers / 371 losers over 24h; top 24h gainer: US +116.40%; top loser: SENT -15.47%.
Watch out! CT surges 3.4% at a key time—where to buy on a pullback?
At 22:52 (8 minutes ago), CT surged 3.4% at a key time (5-minute window: 22:47→22:52). As of 23:00:57, the current price is 0.3103, down 11.7% over 24h. M and LYN also made notable moves around the same time.
📅 Data as of 23:00:57 (event trigger times are shown in each item; prices are real-time snapshots taken when this was written)
📌 In a nutshell: Moves around key periods (candle closes / U.S. market open and close) often involve institutional players, making them more credible signals.
Market overview: BTC 82,987.60 (+0.40%) · ETH 2,489.55 (-1.62%); across the market, 121 gainers / 371 losers over 24h; top 24h gainer: US +116.40%; top loser: SENT -15.47%.
📅 Data as of 23:00:57 (event trigger times are shown in each item; prices are real-time snapshots taken when this was written)
📌 In a nutshell: Moves around key periods (candle closes / U.S. market open and close) often involve institutional players, making them more credible signals.
Market overview: BTC 82,987.60 (+0.40%) · ETH 2,489.55 (-1.62%); across the market, 121 gainers / 371 losers over 24h; top 24h gainer: US +116.40%; top loser: SENT -15.47%.
106

·
--
A token still about 80% away from its ATH, yet its trading volume over the past 7 days is larger than that of many coins with sizable market caps in the top 20—this alone is worth stopping and thinking about.
Over the past 30 days, $ONDO’s average daily trading volume has been around $60 million. But starting July 16, it climbed above 190 million for three straight days; on July 22, it even approached 270 million. The price jumped from 0.31 to 0.42, and the market cap rocketed to #41. However, the most inconsistent part from the data is this: the volume burst is concentrated, yet it does not break through the key long-term downtrend resistance level (such as the 20% area below the ATH). This suggests that capital is indeed moving—but all within a short-term range.
Now the most crucial question: is this accumulation, or distribution? Two explanations are on the table—
**Explanation A: Institutional capital is re-entering by riding the RWA narrative, collecting liquidity in lower price zones where the available “lot” quality is poorer.**
Confirmation signals: Price consolidates with decreasing volume in the 0.40–0.43 range, does not break 0.38, and then follows with a genuine daily breakout accompanied by natural volume expansion (e.g., average daily volume stays above 150 million).
**Explanation B: Retail/speculative traders use the oversold bounce as a battlefield for sentiment, manufacturing a volume illusion to complete distribution at higher levels.**
Confirmation signals: Trading volume drops back below 100 million within the next 3 days; the price quickly falls back to the 0.35–0.36 range; or a bearish long-upper-wick candlestick appears on heavy volume.
Which side do you lean toward—A or B? My own judgment comes with conditions, but I’d really like to see the chart signals you’re noticing in your own eyes.
A token still about 80% away from its ATH, yet its trading volume over the past 7 days is larger than that of many coins with sizable market caps in the top 20—this alone is worth stopping and thinking about.
Over the past 30 days, $ONDO ’s average daily trading volume has been around $60 million. But starting July 16, it climbed above 190 million for three straight days; on July 22, it even approached 270 million. The price jumped from 0.31 to 0.42, and the market cap rocketed to #41. However, the most inconsistent part from the data is this: the volume burst is concentrated, yet it does not break through the key long-term downtrend resistance level (such as the 20% area below the ATH). This suggests that capital is indeed moving—but all within a short-term range.
Now the most crucial question: is this accumulation, or distribution? Two explanations are on the table—
**Explanation A: Institutional capital is re-entering by riding the RWA narrative, collecting liquidity in lower price zones where the available “lot” quality is poorer.**
Confirmation signals: Price consolidates with decreasing volume in the 0.40–0.43 range, does not break 0.38, and then follows with a genuine daily breakout accompanied by natural volume expansion (e.g., average daily volume stays above 150 million).
**Explanation B: Retail/speculative traders use the oversold bounce as a battlefield for sentiment, manufacturing a volume illusion to complete distribution at higher levels.**
Confirmation signals: Trading volume drops back below 100 million within the next 3 days; the price quickly falls back to the 0.35–0.36 range; or a bearish long-upper-wick candlestick appears on heavy volume.
Which side do you lean toward—A or B? My own judgment comes with conditions, but I’d really like to see the chart signals you’re noticing in your own eyes.
Over the past 30 days, $ONDO ’s average daily trading volume has been around $60 million. But starting July 16, it climbed above 190 million for three straight days; on July 22, it even approached 270 million. The price jumped from 0.31 to 0.42, and the market cap rocketed to #41. However, the most inconsistent part from the data is this: the volume burst is concentrated, yet it does not break through the key long-term downtrend resistance level (such as the 20% area below the ATH). This suggests that capital is indeed moving—but all within a short-term range.
Now the most crucial question: is this accumulation, or distribution? Two explanations are on the table—
**Explanation A: Institutional capital is re-entering by riding the RWA narrative, collecting liquidity in lower price zones where the available “lot” quality is poorer.**
Confirmation signals: Price consolidates with decreasing volume in the 0.40–0.43 range, does not break 0.38, and then follows with a genuine daily breakout accompanied by natural volume expansion (e.g., average daily volume stays above 150 million).
**Explanation B: Retail/speculative traders use the oversold bounce as a battlefield for sentiment, manufacturing a volume illusion to complete distribution at higher levels.**
Confirmation signals: Trading volume drops back below 100 million within the next 3 days; the price quickly falls back to the 0.35–0.36 range; or a bearish long-upper-wick candlestick appears on heavy volume.
Which side do you lean toward—A or B? My own judgment comes with conditions, but I’d really like to see the chart signals you’re noticing in your own eyes.
28
Log in to explore more content
Join global crypto users on Binance Square
⚡️ Get latest and useful information about crypto.
💬 Trusted by the world’s largest crypto exchange.
👍 Discover real insights from verified creators.
Email / Phone number
Trending Topics
1
#CanBTCReboundAfterFallingBelow60K?
0 views
115 Discussing
2
#GlobalStocksFaceLongestLosingStreakSince2023
0 views
268 Discussing
3
#AnthropicPlungesTowardIPOPriceonDay2
0 views
43 Discussing
4
#GaoTengBitcoinETFListsOnHKEX
0 views
264 Discussing
5
#TradFiForBeginners
946,825 views
5,525 Discussing
6
#NvidiaBoardReportedlySplitOverHuang’sReturn
258,674 views
2,405 Discussing
7
#TetherBurns8BillionUSDTInPast20Days
0 views
101 Discussing
8
#BitcoinWalletSignatureFlawExploitableWithinSeconds
0 views
44 Discussing
9
#CanGTA6'sLaunchLiftTTWOShares?
207,868 views
1,711 Discussing
10
#HongKongProposesSFCLicensingForFourVirtualAssetServices
404 views
32 Discussing