
#46
46
7,479 views
58 Discussing
Hot
Latest

·
--
46% single-day increase, while the funding rate spikes to 0.095%—what does that mean?
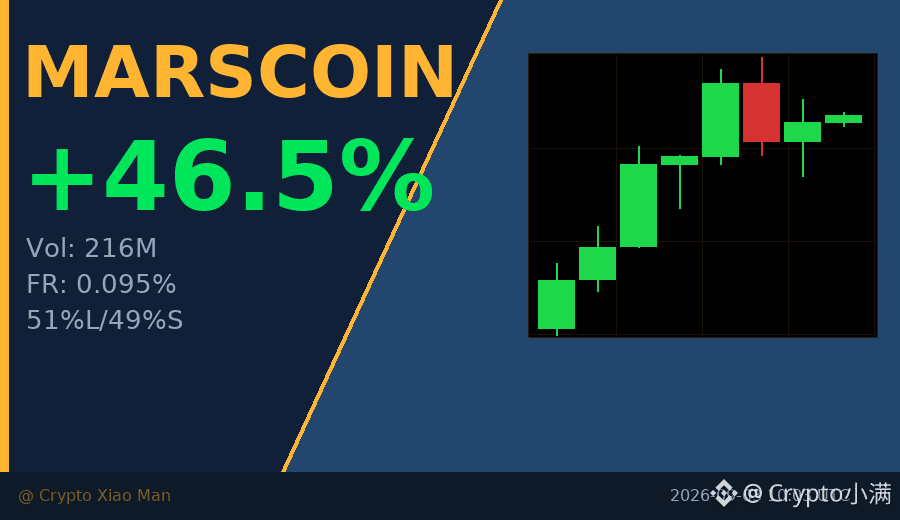
Today, MARSCOIN’s trading volume surged to 216 million USDT. The long-to-short ratio is 51% to 49%, nearly evenly matched. But the hourly chart has already closed three straight bullish candles, with the price stabilizing around 0.103. The low is 0.052, and the high has reached 0.113.
This combination of rising volume and price plus a higher funding rate usually indicates that short-term funds are scrambling for positions. However, the sell pressure above 0.11 still needs to be worked through, so chasing longs involves considerable risk.
I’d rather wait for a pullback to the 0.095–0.098 range before considering a long, with a stop-loss set below 0.09.
$MARSCOIN #资金费率异动 #46%
Click the small card below to quickly check the market trend 👇
46% single-day increase, while the funding rate spikes to 0.095%—what does that mean?
Today, MARSCOIN’s trading volume surged to 216 million USDT. The long-to-short ratio is 51% to 49%, nearly evenly matched. But the hourly chart has already closed three straight bullish candles, with the price stabilizing around 0.103. The low is 0.052, and the high has reached 0.113.
This combination of rising volume and price plus a higher funding rate usually indicates that short-term funds are scrambling for positions. However, the sell pressure above 0.11 still needs to be worked through, so chasing longs involves considerable risk.
I’d rather wait for a pullback to the 0.095–0.098 range before considering a long, with a stop-loss set below 0.09.
$MARSCOIN #资金费率异动 #46%
Click the small card below to quickly check the market trend 👇
Today, MARSCOIN’s trading volume surged to 216 million USDT. The long-to-short ratio is 51% to 49%, nearly evenly matched. But the hourly chart has already closed three straight bullish candles, with the price stabilizing around 0.103. The low is 0.052, and the high has reached 0.113.
This combination of rising volume and price plus a higher funding rate usually indicates that short-term funds are scrambling for positions. However, the sell pressure above 0.11 still needs to be worked through, so chasing longs involves considerable risk.
I’d rather wait for a pullback to the 0.095–0.098 range before considering a long, with a stop-loss set below 0.09.
$MARSCOIN #资金费率异动 #46%
Click the small card below to quickly check the market trend 👇
252
·
--
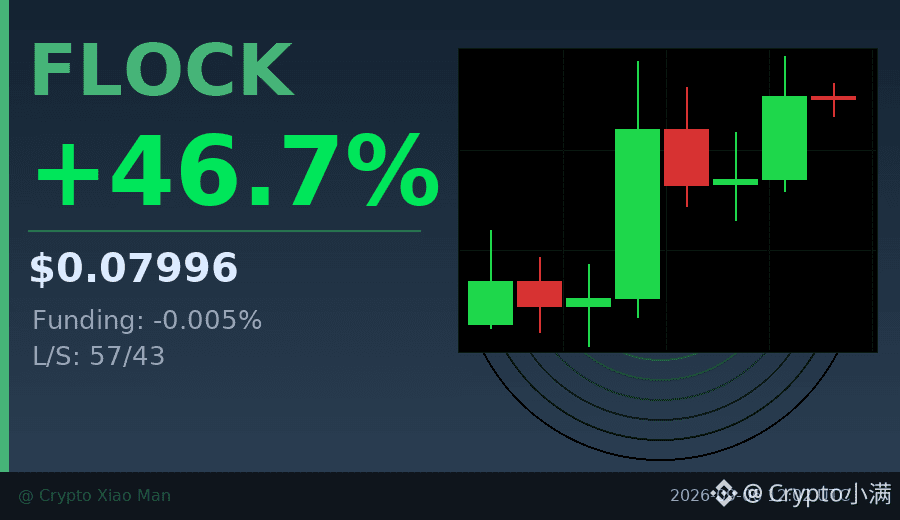
Behind the 46% gain, there’s an unusual signal: FLOCK’s trading volume today surged to 187 million USDT, but the funding rate is negative (-0.005%).
What does this mean? Most people are bullish and buying, pushing the price up, but traders holding short positions are willing to pay interest to long positions — this suggests the rally hasn’t attracted much leveraged chasing, and instead looks like spot buying is leading.
The long-term/short-term ratio is 57% to 43%, with bulls ahead but not extremely so. Over the past 8 hours, the candlesticks have shown overall strength, climbing from the 0.05 range to around 0.08, with almost no meaningful pullback in between.
Risk point: if the negative funding rate persists, it may indicate shorts are building strength; if it turns into a high positive funding rate, that would be the dangerous zone of crowded leverage.
$FLOCK #资金费率背离 #46%
Click the card below to quickly check the market👇
Behind the 46% gain, there’s an unusual signal: FLOCK’s trading volume today surged to 187 million USDT, but the funding rate is negative (-0.005%).
What does this mean? Most people are bullish and buying, pushing the price up, but traders holding short positions are willing to pay interest to long positions — this suggests the rally hasn’t attracted much leveraged chasing, and instead looks like spot buying is leading.
The long-term/short-term ratio is 57% to 43%, with bulls ahead but not extremely so. Over the past 8 hours, the candlesticks have shown overall strength, climbing from the 0.05 range to around 0.08, with almost no meaningful pullback in between.
Risk point: if the negative funding rate persists, it may indicate shorts are building strength; if it turns into a high positive funding rate, that would be the dangerous zone of crowded leverage.
$FLOCK #资金费率背离 #46%
Click the card below to quickly check the market👇
What does this mean? Most people are bullish and buying, pushing the price up, but traders holding short positions are willing to pay interest to long positions — this suggests the rally hasn’t attracted much leveraged chasing, and instead looks like spot buying is leading.
The long-term/short-term ratio is 57% to 43%, with bulls ahead but not extremely so. Over the past 8 hours, the candlesticks have shown overall strength, climbing from the 0.05 range to around 0.08, with almost no meaningful pullback in between.
Risk point: if the negative funding rate persists, it may indicate shorts are building strength; if it turns into a high positive funding rate, that would be the dangerous zone of crowded leverage.
$FLOCK #资金费率背离 #46%
Click the card below to quickly check the market👇
20

See translation
En vez de mirar teoría, probalo.
Fecha #46: ¿sube o baja en las próximas 10 ruedas? Dura hasta la medianoche.
tradinglogica.com/?src=bsq&p=f46-a-apr-auto
En vez de mirar teoría, probalo.
Fecha #46: ¿sube o baja en las próximas 10 ruedas? Dura hasta la medianoche.
tradinglogica.com/?src=bsq&p=f46-a-apr-auto
Fecha #46: ¿sube o baja en las próximas 10 ruedas? Dura hasta la medianoche.
tradinglogica.com/?src=bsq&p=f46-a-apr-auto
91

·
--
U.S. PPI comes out tonight—the last inflation test of the week. First, the numbers; then, how I’m waiting tonight.
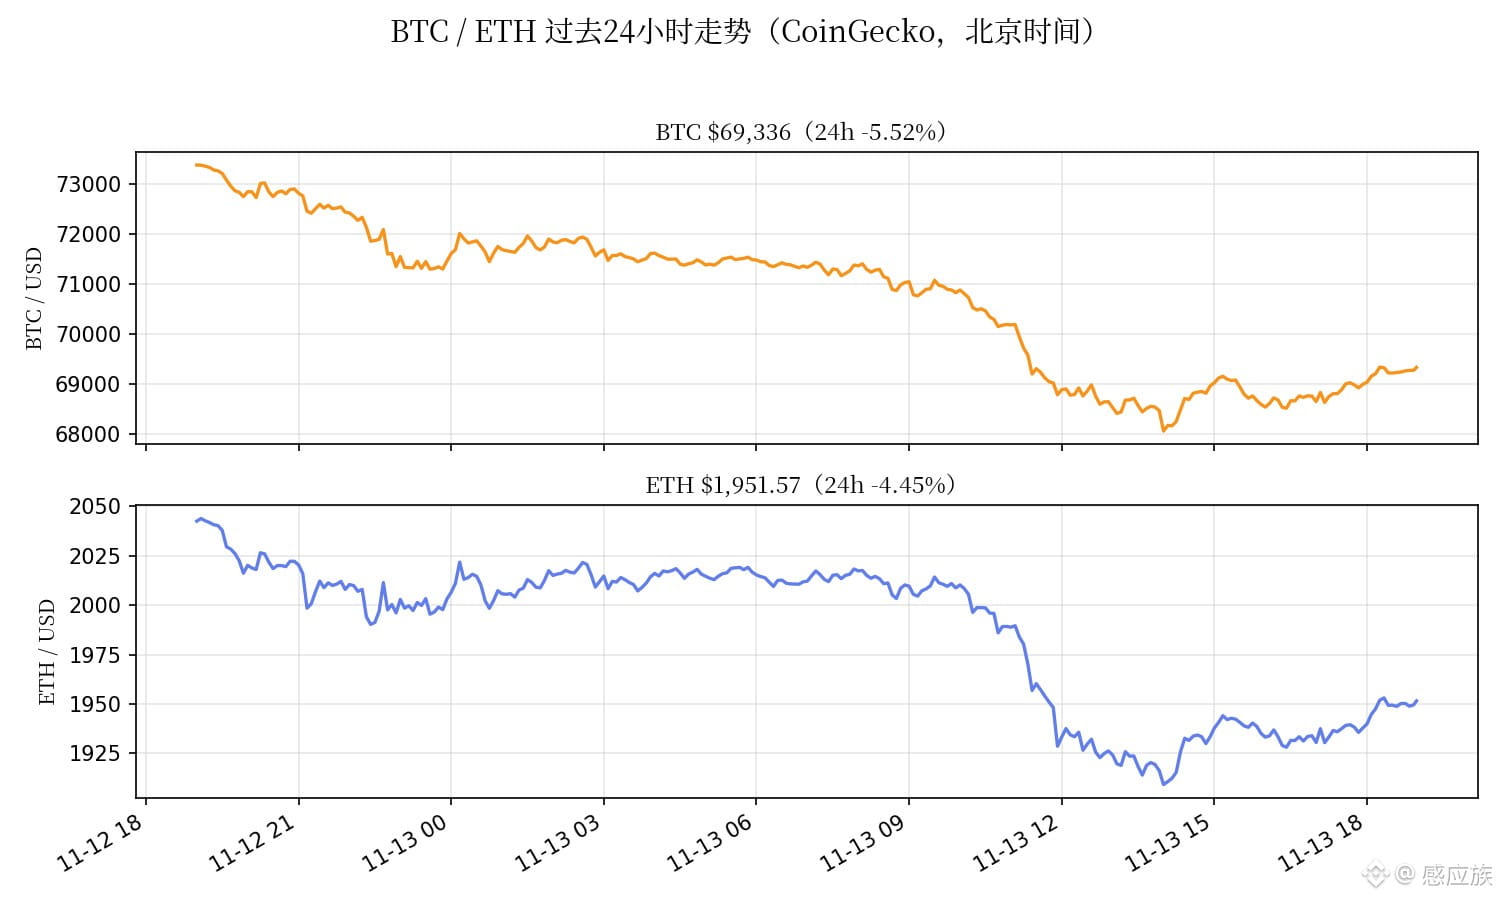
19:00: $BTC , approximately $69,342, down 5.5% in 24 hours; $ETH , approximately $1,951, down 4.5% in 24 hours (CoinGecko, prices checked at 19:00 Beijing time). BTC has bounced from today’s low of $68,062, and ETH is back above $1,950. But don’t mistake that for a bullish reversal—the 24-hour ranges were BTC $68,062–$73,390 and ETH as low as $1,909. Bears still had the upper hand all day.
Short trade update #46: The short opened on November 7 at 13:00 between $75,800 and $76,100, with a $75,950 midpoint entry. At the current price of $69,342, the price is down 8.70%; on 100x margin, the remaining half has an unrealized gain of about +870%. It was +949% at 17:00, but the price bounced $600 from $68,741 and the unrealized gain shrank—that’s the honest picture. The added short tranche (added November 9 at 13:00 between $74,700 and $75,000, with a $74,850 midpoint entry) is up about +736% (it was +816% at 17:00). The first target at $73,200 was hit, and that half was closed for profit in the early hours of November 11 (original position +362%, added short +220%). The second target at $68,000 is still $1,342 away. It hasn’t hit yet, so I’m not reducing the position.
U.S. October PPI is released tonight at 21:30 Beijing time: expected year-over-year +6.6%, month-over-month +0.4%, and core month-over-month +0.3% (source: ForexR economic calendar). Tuesday’s CPI already came in hot (core month-over-month +0.3%, for the third month in a row), and the probability of a 50-basis-point rate hike in December rose from 1.1% to 15.3% (CME FedWatch, market pricing). After the last two hotter-than-expected CPI/PPI releases, BTC moved lower (Ambcrypto review). There’s also a longer-term headwind: MSCI will remove Strategy from its indices starting December 1, and JPMorgan estimates that this alone could trigger about $2.8 billion in selling. The macro winds are still at the bears’ backs.
If the 20:00 four-hour candle still closes below $75,000, it will be the 28th consecutive one. The plan is unchanged: keep holding the remaining half, with $68,000 as the second target; close as planned if it gets there, and don’t get greedy. I won’t trade during the hour before or after tonight’s PPI release (20:30–22:30). Hot reading → $68,000 is very likely to break tonight; cool reading → first watch for a rebound to $70,000–$71,500, which is still an area to add to the short, not to go long. A rebound to $75,300–$75,500 is still an area to add to the short. If the daily candle closes back above the 200-day moving average at $73,125, or a four-hour candle closes above $76,250, I’ll admit I’m wrong and exit. The stop-loss above $77,500 remains unchanged. With 100x leverage, I’m putting only a very small portion of my total capital at risk.
AKEDO is newly trending after gaining +149% in a day, and Seppuku is up +7.4%. Both are small caps—just sentiment thermometers, not touching them. ZEC is down 4.3%, still below $1,000.
Are you betting on a hot or cool PPI tonight? Let’s discuss in the comments. (Prices: CoinGecko, checked at 19:00 Beijing time on November 13; chart shows the past 24 hours.)
U.S. PPI comes out tonight—the last inflation test of the week. First, the numbers; then, how I’m waiting tonight.
19:00: $BTC , approximately $69,342, down 5.5% in 24 hours; $ETH , approximately $1,951, down 4.5% in 24 hours (CoinGecko, prices checked at 19:00 Beijing time). BTC has bounced from today’s low of $68,062, and ETH is back above $1,950. But don’t mistake that for a bullish reversal—the 24-hour ranges were BTC $68,062–$73,390 and ETH as low as $1,909. Bears still had the upper hand all day.
Short trade update #46: The short opened on November 7 at 13:00 between $75,800 and $76,100, with a $75,950 midpoint entry. At the current price of $69,342, the price is down 8.70%; on 100x margin, the remaining half has an unrealized gain of about +870%. It was +949% at 17:00, but the price bounced $600 from $68,741 and the unrealized gain shrank—that’s the honest picture. The added short tranche (added November 9 at 13:00 between $74,700 and $75,000, with a $74,850 midpoint entry) is up about +736% (it was +816% at 17:00). The first target at $73,200 was hit, and that half was closed for profit in the early hours of November 11 (original position +362%, added short +220%). The second target at $68,000 is still $1,342 away. It hasn’t hit yet, so I’m not reducing the position.
U.S. October PPI is released tonight at 21:30 Beijing time: expected year-over-year +6.6%, month-over-month +0.4%, and core month-over-month +0.3% (source: ForexR economic calendar). Tuesday’s CPI already came in hot (core month-over-month +0.3%, for the third month in a row), and the probability of a 50-basis-point rate hike in December rose from 1.1% to 15.3% (CME FedWatch, market pricing). After the last two hotter-than-expected CPI/PPI releases, BTC moved lower (Ambcrypto review). There’s also a longer-term headwind: MSCI will remove Strategy from its indices starting December 1, and JPMorgan estimates that this alone could trigger about $2.8 billion in selling. The macro winds are still at the bears’ backs.
If the 20:00 four-hour candle still closes below $75,000, it will be the 28th consecutive one. The plan is unchanged: keep holding the remaining half, with $68,000 as the second target; close as planned if it gets there, and don’t get greedy. I won’t trade during the hour before or after tonight’s PPI release (20:30–22:30). Hot reading → $68,000 is very likely to break tonight; cool reading → first watch for a rebound to $70,000–$71,500, which is still an area to add to the short, not to go long. A rebound to $75,300–$75,500 is still an area to add to the short. If the daily candle closes back above the 200-day moving average at $73,125, or a four-hour candle closes above $76,250, I’ll admit I’m wrong and exit. The stop-loss above $77,500 remains unchanged. With 100x leverage, I’m putting only a very small portion of my total capital at risk.
AKEDO is newly trending after gaining +149% in a day, and Seppuku is up +7.4%. Both are small caps—just sentiment thermometers, not touching them. ZEC is down 4.3%, still below $1,000.
Are you betting on a hot or cool PPI tonight? Let’s discuss in the comments. (Prices: CoinGecko, checked at 19:00 Beijing time on November 13; chart shows the past 24 hours.)
19:00: $BTC , approximately $69,342, down 5.5% in 24 hours; $ETH , approximately $1,951, down 4.5% in 24 hours (CoinGecko, prices checked at 19:00 Beijing time). BTC has bounced from today’s low of $68,062, and ETH is back above $1,950. But don’t mistake that for a bullish reversal—the 24-hour ranges were BTC $68,062–$73,390 and ETH as low as $1,909. Bears still had the upper hand all day.
Short trade update #46: The short opened on November 7 at 13:00 between $75,800 and $76,100, with a $75,950 midpoint entry. At the current price of $69,342, the price is down 8.70%; on 100x margin, the remaining half has an unrealized gain of about +870%. It was +949% at 17:00, but the price bounced $600 from $68,741 and the unrealized gain shrank—that’s the honest picture. The added short tranche (added November 9 at 13:00 between $74,700 and $75,000, with a $74,850 midpoint entry) is up about +736% (it was +816% at 17:00). The first target at $73,200 was hit, and that half was closed for profit in the early hours of November 11 (original position +362%, added short +220%). The second target at $68,000 is still $1,342 away. It hasn’t hit yet, so I’m not reducing the position.
U.S. October PPI is released tonight at 21:30 Beijing time: expected year-over-year +6.6%, month-over-month +0.4%, and core month-over-month +0.3% (source: ForexR economic calendar). Tuesday’s CPI already came in hot (core month-over-month +0.3%, for the third month in a row), and the probability of a 50-basis-point rate hike in December rose from 1.1% to 15.3% (CME FedWatch, market pricing). After the last two hotter-than-expected CPI/PPI releases, BTC moved lower (Ambcrypto review). There’s also a longer-term headwind: MSCI will remove Strategy from its indices starting December 1, and JPMorgan estimates that this alone could trigger about $2.8 billion in selling. The macro winds are still at the bears’ backs.
If the 20:00 four-hour candle still closes below $75,000, it will be the 28th consecutive one. The plan is unchanged: keep holding the remaining half, with $68,000 as the second target; close as planned if it gets there, and don’t get greedy. I won’t trade during the hour before or after tonight’s PPI release (20:30–22:30). Hot reading → $68,000 is very likely to break tonight; cool reading → first watch for a rebound to $70,000–$71,500, which is still an area to add to the short, not to go long. A rebound to $75,300–$75,500 is still an area to add to the short. If the daily candle closes back above the 200-day moving average at $73,125, or a four-hour candle closes above $76,250, I’ll admit I’m wrong and exit. The stop-loss above $77,500 remains unchanged. With 100x leverage, I’m putting only a very small portion of my total capital at risk.
AKEDO is newly trending after gaining +149% in a day, and Seppuku is up +7.4%. Both are small caps—just sentiment thermometers, not touching them. ZEC is down 4.3%, still below $1,000.
Are you betting on a hot or cool PPI tonight? Let’s discuss in the comments. (Prices: CoinGecko, checked at 19:00 Beijing time on November 13; chart shows the past 24 hours.)
118

·
--
👀 $PEPE CoinGecko Trending Pepe (PEPE), ranked #46 by market capitalization
$ETH
This article does not constitute investment advice. Trading involves risks; exercise caution before entering.
👀 $PEPE CoinGecko Trending Pepe (PEPE), ranked #46 by market capitalization
$ETH
This article does not constitute investment advice. Trading involves risks; exercise caution before entering.
$ETH
This article does not constitute investment advice. Trading involves risks; exercise caution before entering.
208

·
--
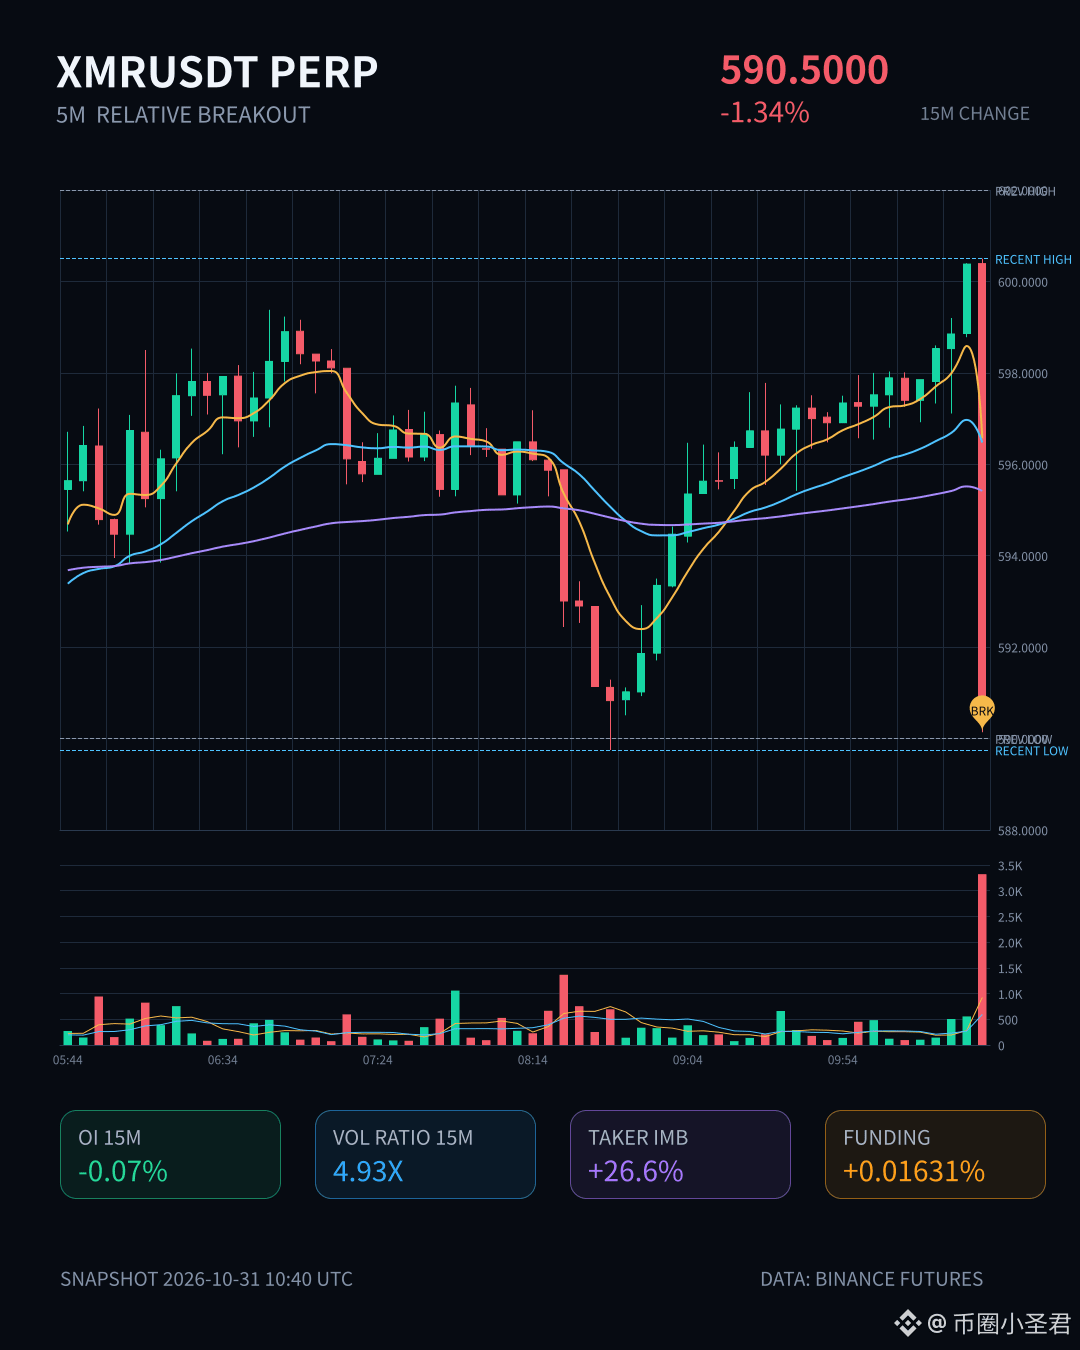
$XMR This move broke below the lower bound of the range formed by the last 20 or so 5m candles on the 15m chart, with volume surging to 4.93x and volatility Z at 3.83—a classic high-volume breakdown. But OI is actually falling: -0.07% on 15m and -0.06% on 1h. Notional change is also small, which looks more like longs deleveraging and stop-loss orders getting swept than fresh shorts entering and driving the price down. The aggressive trade imbalance is 26.6%, and the buy/sell ratio is 1.72, suggesting aggressive buying is actually holding up well during this sell-off—someone is absorbing the selling. It ranks #46 for anomalies across the whole pool and #21 for notional change. Activity isn’t off the charts, but the depth signal has been confirmed. This structure looks more like a washout caused by position reduction. First, watch whether price can reclaim the lower bound of the range; if it can’t, then we can reassess.
$XMR This move broke below the lower bound of the range formed by the last 20 or so 5m candles on the 15m chart, with volume surging to 4.93x and volatility Z at 3.83—a classic high-volume breakdown. But OI is actually falling: -0.07% on 15m and -0.06% on 1h. Notional change is also small, which looks more like longs deleveraging and stop-loss orders getting swept than fresh shorts entering and driving the price down. The aggressive trade imbalance is 26.6%, and the buy/sell ratio is 1.72, suggesting aggressive buying is actually holding up well during this sell-off—someone is absorbing the selling. It ranks #46 for anomalies across the whole pool and #21 for notional change. Activity isn’t off the charts, but the depth signal has been confirmed. This structure looks more like a washout caused by position reduction. First, watch whether price can reclaim the lower bound of the range; if it can’t, then we can reassess.
1

·
--
DeFi's flagship lender just dropped 9.5% in a day — and the protocol didn't do anything wrong.
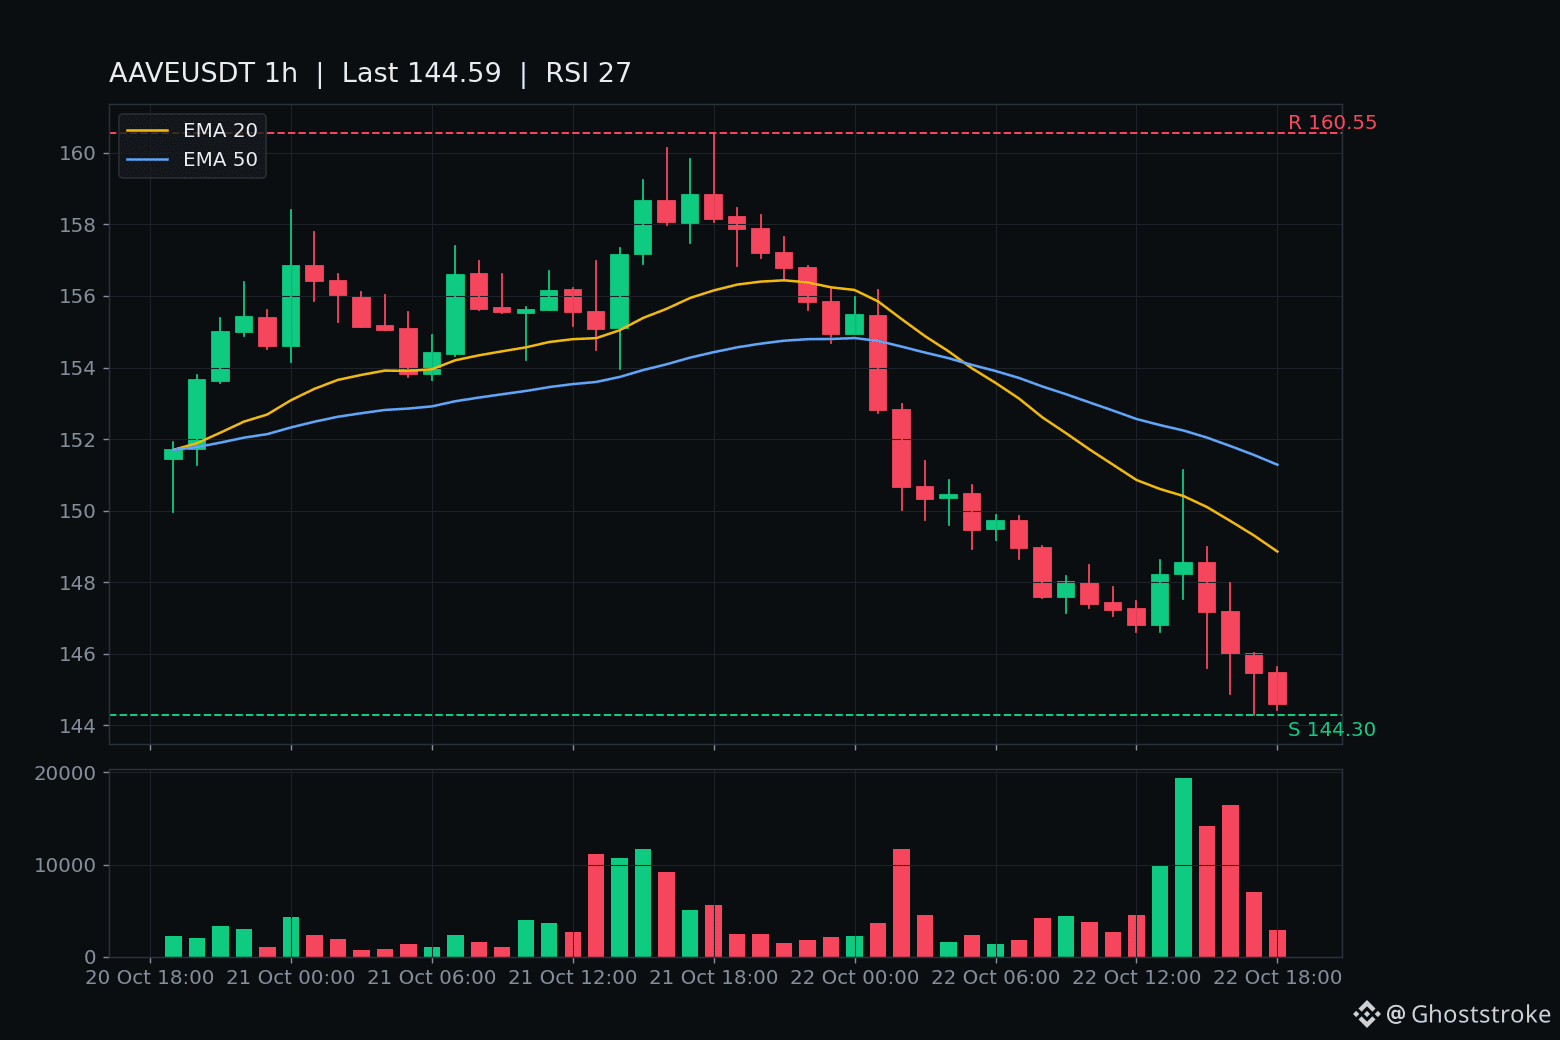
$AAVE: $160.55 → $144.30 today (-10.1% top to low), -9.5% 24h on $19.9M Binance volume (~130k trades). The tape is a clean breakdown of a 9-day chop zone ($146–166 held since Oct 13 — gone in one session).
One dead bounce: 14:00 UTC wicked to $151.13 on the day's biggest volume bar ($2.89M) and closed $148.55. Then three dump bars to a fresh low $144.30 at 17:00 UTC. Now under the 1h EMA20 ($148.86) and EMA50 ($151.28), RSI at 26.8 — washed out.
Why did it fall? No AAVE-specific news — two news sweeps came up empty. This is ~2.3x BTC beta on the market-wide selloff (BTC -4.1% to $81.1k, ~$70B erased in a day). The protocol is fine; the price got repriced by the market.
Honest both sides: RSI 26.8 is bounce territory, and a lender with $2.2B mcap, rank #46, 96.5% circulating and zero exploit headline doesn't usually stay dumped on air alone. But chop-zone breakdowns rarely bottom on day one.
Levels: ceiling $160.55 (today's high), then the EMA zone $148–151. Floor $144.30 (today's low) — lose that and the 30d low at $134.90 is the next marker.
Does the blue chip of DeFi bounce off $144, or does the market walk it down to the 30d low?
DeFi's flagship lender just dropped 9.5% in a day — and the protocol didn't do anything wrong.
$AAVE : $160.55 → $144.30 today (-10.1% top to low), -9.5% 24h on $19.9M Binance volume (~130k trades). The tape is a clean breakdown of a 9-day chop zone ($146–166 held since Oct 13 — gone in one session).
One dead bounce: 14:00 UTC wicked to $151.13 on the day's biggest volume bar ($2.89M) and closed $148.55. Then three dump bars to a fresh low $144.30 at 17:00 UTC. Now under the 1h EMA20 ($148.86) and EMA50 ($151.28), RSI at 26.8 — washed out.
Why did it fall? No AAVE-specific news — two news sweeps came up empty. This is ~2.3x BTC beta on the market-wide selloff (BTC -4.1% to $81.1k, ~$70B erased in a day). The protocol is fine; the price got repriced by the market.
Honest both sides: RSI 26.8 is bounce territory, and a lender with $2.2B mcap, rank #46, 96.5% circulating and zero exploit headline doesn't usually stay dumped on air alone. But chop-zone breakdowns rarely bottom on day one.
Levels: ceiling $160.55 (today's high), then the EMA zone $148–151. Floor $144.30 (today's low) — lose that and the 30d low at $134.90 is the next marker.
Does the blue chip of DeFi bounce off $144, or does the market walk it down to the 30d low?
$AAVE : $160.55 → $144.30 today (-10.1% top to low), -9.5% 24h on $19.9M Binance volume (~130k trades). The tape is a clean breakdown of a 9-day chop zone ($146–166 held since Oct 13 — gone in one session).
One dead bounce: 14:00 UTC wicked to $151.13 on the day's biggest volume bar ($2.89M) and closed $148.55. Then three dump bars to a fresh low $144.30 at 17:00 UTC. Now under the 1h EMA20 ($148.86) and EMA50 ($151.28), RSI at 26.8 — washed out.
Why did it fall? No AAVE-specific news — two news sweeps came up empty. This is ~2.3x BTC beta on the market-wide selloff (BTC -4.1% to $81.1k, ~$70B erased in a day). The protocol is fine; the price got repriced by the market.
Honest both sides: RSI 26.8 is bounce territory, and a lender with $2.2B mcap, rank #46, 96.5% circulating and zero exploit headline doesn't usually stay dumped on air alone. But chop-zone breakdowns rarely bottom on day one.
Levels: ceiling $160.55 (today's high), then the EMA zone $148–151. Floor $144.30 (today's low) — lose that and the 30d low at $134.90 is the next marker.
Does the blue chip of DeFi bounce off $144, or does the market walk it down to the 30d low?

ONDO is climbing fast, but the RWA narrative isn't a free pass.
$ONDO currently at $0.42, up +8.73872%/24h, trading range $0.38–$0.43. Volume at $316.88M, market cap at $2.04B, rank #46 → not a small scale, but the price nearing the daily ceiling can easily trigger FOMO.
The story to watch: Ondo Finance is in the tokenized real-world assets space that the market is keeping an eye on; Ondo Global Markets has utilized Chainlink as the official data oracle. The catalysts are clearer, but they don't replace the discipline of observation.
Are you leaning towards a scenario where $ONDO maintains an accumulation pace, or do we need to cool off first? #ONDO $ONDO #Crypto #BinanceSquare #DYOR
ONDO is climbing fast, but the RWA narrative isn't a free pass.
$ONDO currently at $0.42, up +8.73872%/24h, trading range $0.38–$0.43. Volume at $316.88M, market cap at $2.04B, rank #46 → not a small scale, but the price nearing the daily ceiling can easily trigger FOMO.
The story to watch: Ondo Finance is in the tokenized real-world assets space that the market is keeping an eye on; Ondo Global Markets has utilized Chainlink as the official data oracle. The catalysts are clearer, but they don't replace the discipline of observation.
Are you leaning towards a scenario where $ONDO maintains an accumulation pace, or do we need to cool off first? #ONDO $ONDO #Crypto #BinanceSquare #DYOR
$ONDO currently at $0.42, up +8.73872%/24h, trading range $0.38–$0.43. Volume at $316.88M, market cap at $2.04B, rank #46 → not a small scale, but the price nearing the daily ceiling can easily trigger FOMO.
The story to watch: Ondo Finance is in the tokenized real-world assets space that the market is keeping an eye on; Ondo Global Markets has utilized Chainlink as the official data oracle. The catalysts are clearer, but they don't replace the discipline of observation.
Are you leaning towards a scenario where $ONDO maintains an accumulation pace, or do we need to cool off first? #ONDO $ONDO #Crypto #BinanceSquare #DYOR
300
·
--
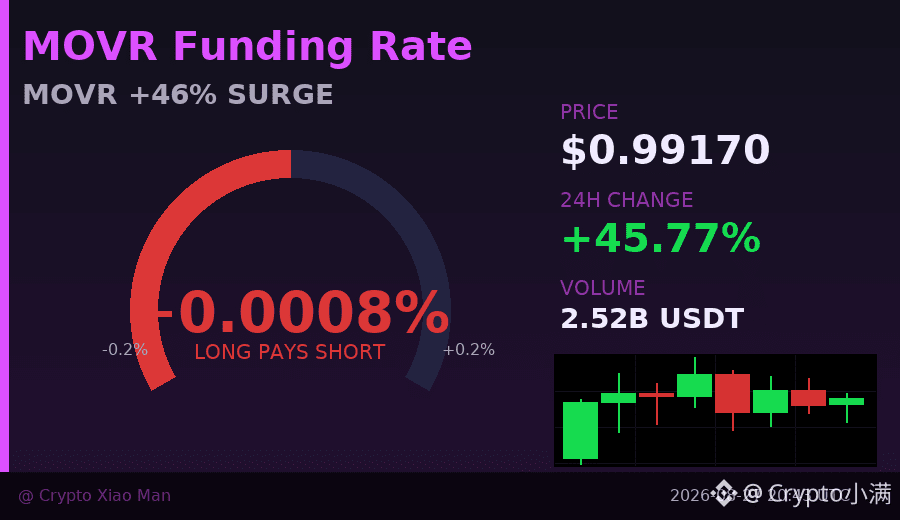
Today I was watching the MOVR candlesticks, and there was a detail that made me look again and again:
The high hit 1.1698, while the low was only 0.62—almost a 90% swing in a single day. This isn’t a simple rise; it’s a roller coaster.
Even stranger is the funding rate: just 0.000008—almost zero. Usually, when a coin climbs 46%, longs should pile into futures contracts, pushing the funding rate much higher. But this number tells me that not many leveraged players are chasing in—more of the move is being driven by spot demand.
The long/short ratio is 54:46, which is also unusually balanced. One side thinks the uptrend can continue, while the other side is preparing to short this wave.
Trading volume is $250 million, which is already abnormally high for MOVR. Money is coming in, but the direction hasn’t been decided yet.
Now it’s closing at 0.99, just one step away from the $1 psychological level. This kind of position is often a fork in the road: if it holds above, it may attract more attention; if it can’t hold, today’s gains may be viewed as an opportunity to sell into.
I don’t know which way it will go, but this abnormal funding rate of essentially zero is worth remembering.
$MOVR #资金费率异常 #46% 폭涨背后
Click the small card below to quickly check the market 👇
Today I was watching the MOVR candlesticks, and there was a detail that made me look again and again:
The high hit 1.1698, while the low was only 0.62—almost a 90% swing in a single day. This isn’t a simple rise; it’s a roller coaster.
Even stranger is the funding rate: just 0.000008—almost zero. Usually, when a coin climbs 46%, longs should pile into futures contracts, pushing the funding rate much higher. But this number tells me that not many leveraged players are chasing in—more of the move is being driven by spot demand.
The long/short ratio is 54:46, which is also unusually balanced. One side thinks the uptrend can continue, while the other side is preparing to short this wave.
Trading volume is $250 million, which is already abnormally high for MOVR. Money is coming in, but the direction hasn’t been decided yet.
Now it’s closing at 0.99, just one step away from the $1 psychological level. This kind of position is often a fork in the road: if it holds above, it may attract more attention; if it can’t hold, today’s gains may be viewed as an opportunity to sell into.
I don’t know which way it will go, but this abnormal funding rate of essentially zero is worth remembering.
$MOVR #资金费率异常 #46% 폭涨背后
Click the small card below to quickly check the market 👇
The high hit 1.1698, while the low was only 0.62—almost a 90% swing in a single day. This isn’t a simple rise; it’s a roller coaster.
Even stranger is the funding rate: just 0.000008—almost zero. Usually, when a coin climbs 46%, longs should pile into futures contracts, pushing the funding rate much higher. But this number tells me that not many leveraged players are chasing in—more of the move is being driven by spot demand.
The long/short ratio is 54:46, which is also unusually balanced. One side thinks the uptrend can continue, while the other side is preparing to short this wave.
Trading volume is $250 million, which is already abnormally high for MOVR. Money is coming in, but the direction hasn’t been decided yet.
Now it’s closing at 0.99, just one step away from the $1 psychological level. This kind of position is often a fork in the road: if it holds above, it may attract more attention; if it can’t hold, today’s gains may be viewed as an opportunity to sell into.
I don’t know which way it will go, but this abnormal funding rate of essentially zero is worth remembering.
$MOVR #资金费率异常 #46% 폭涨背后
Click the small card below to quickly check the market 👇
65
·
--
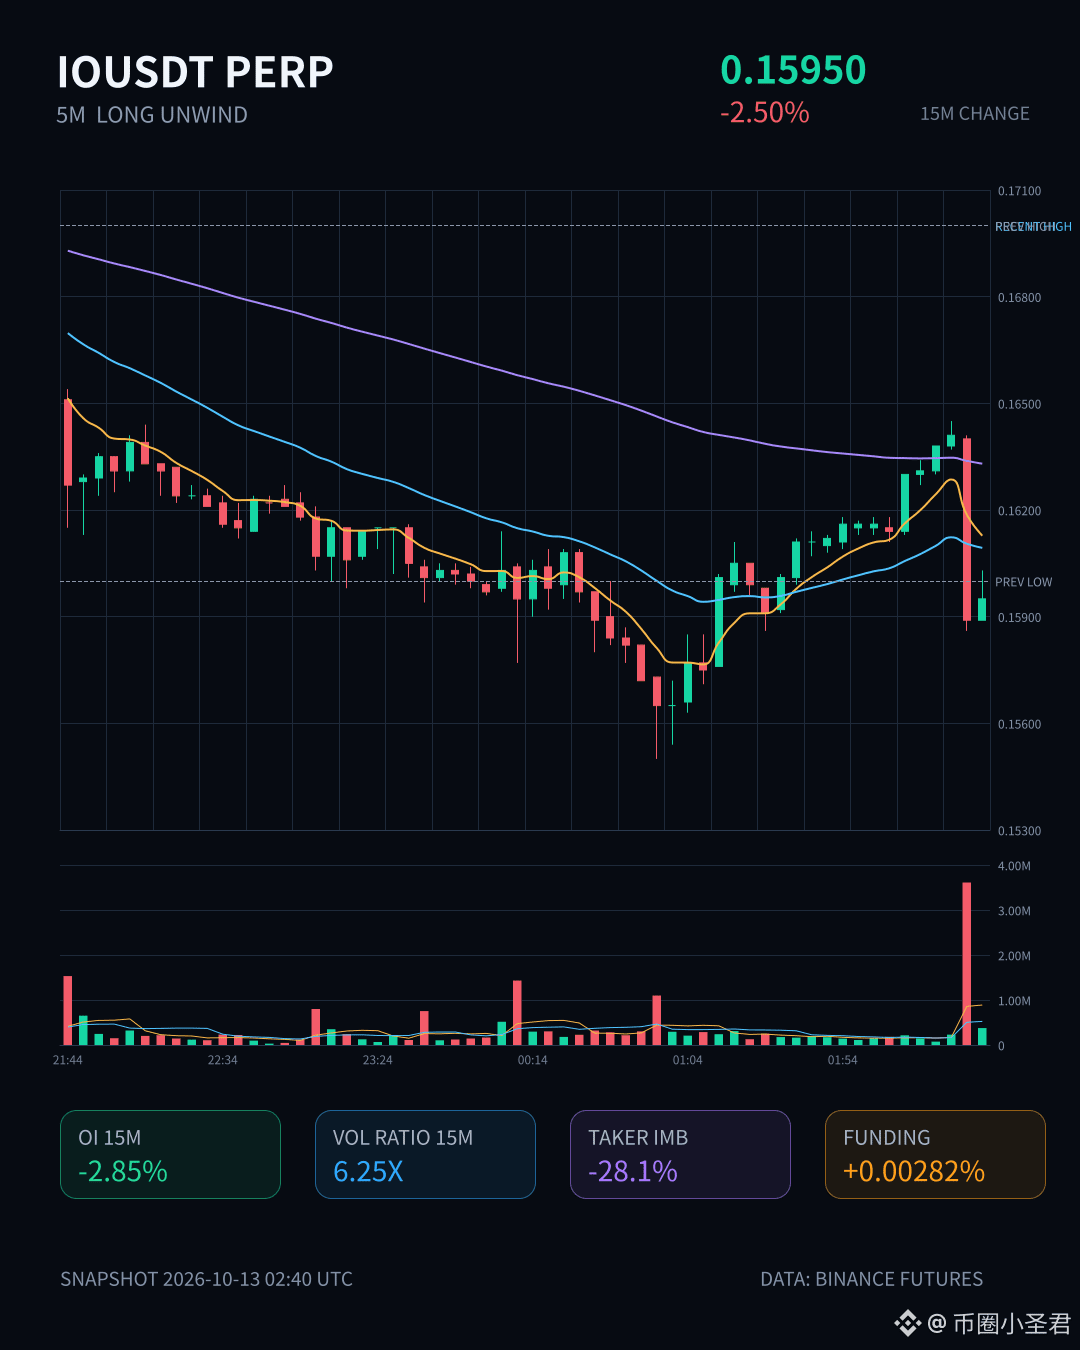
$IO 15-minute candle looks rather ugly: down 2.5%. But what really stands out is the volume—6.25 times normal, aggressive trade delta at -28.1%, and a buy/sell ratio of 0.56. It’s clear that some traders are rushing for the exits.
OI is down 2.85% over 15m and 3.44% over 1h. Price down + OI down: classic long-side deleveraging. This wasn’t driven by new shorts piling in; it was existing longs getting stopped out or reducing positions. The anomaly percentile is 93.5%, ranking #17 across the pool, while nominal change ranks #46. That puts this signal near the top of the pool—it’s not just a minor blip.
24h trading volume is 39M, so liquidity isn’t particularly deep. When a volume spike like this coincides with shrinking OI, it suggests that a wave of overhead supply has just been cleared in the short term. Next, watch two things: whether OI can stop falling and stabilize, and whether the aggressive buy/sell ratio gets back above 0.8. Until then, don’t rush to buy the dip.
$IO 15-minute candle looks rather ugly: down 2.5%. But what really stands out is the volume—6.25 times normal, aggressive trade delta at -28.1%, and a buy/sell ratio of 0.56. It’s clear that some traders are rushing for the exits.
OI is down 2.85% over 15m and 3.44% over 1h. Price down + OI down: classic long-side deleveraging. This wasn’t driven by new shorts piling in; it was existing longs getting stopped out or reducing positions. The anomaly percentile is 93.5%, ranking #17 across the pool, while nominal change ranks #46. That puts this signal near the top of the pool—it’s not just a minor blip.
24h trading volume is 39M, so liquidity isn’t particularly deep. When a volume spike like this coincides with shrinking OI, it suggests that a wave of overhead supply has just been cleared in the short term. Next, watch two things: whether OI can stop falling and stabilize, and whether the aggressive buy/sell ratio gets back above 0.8. Until then, don’t rush to buy the dip.
OI is down 2.85% over 15m and 3.44% over 1h. Price down + OI down: classic long-side deleveraging. This wasn’t driven by new shorts piling in; it was existing longs getting stopped out or reducing positions. The anomaly percentile is 93.5%, ranking #17 across the pool, while nominal change ranks #46. That puts this signal near the top of the pool—it’s not just a minor blip.
24h trading volume is 39M, so liquidity isn’t particularly deep. When a volume spike like this coincides with shrinking OI, it suggests that a wave of overhead supply has just been cleared in the short term. Next, watch two things: whether OI can stop falling and stabilize, and whether the aggressive buy/sell ratio gets back above 0.8. Until then, don’t rush to buy the dip.
2

·
--
🔥 ASTER/USDT Trading Strategy
Current Price: $0.748 (+12%)
Binance Spot | CoinGecko Rank #46
Short-Term (1-3 days):
- Currently Holding: Set a trailing stop to lock in profits
- Not Entered: Wait for a pullback to $0.68-$0.70 before jumping in, don't chase the highs
- Target Levels: $0.77 / $0.80
- Stop Loss: $0.64
Mid-Term (1-2 weeks):
- Hold core position, neither adding nor reducing
- If this week's close is above $0.72, trend is confirmed
- If it breaks below $0.65, the trend weakens
💥 Core Judgment: This is a genuine breakout with volume. Weekly candles have been bullish for 5 days straight, and today’s volume is accelerating. The long position is clearly defined, but chasing the highs carries significant risk. Waiting for a pullback to enter is safer.
In a nutshell: Don't rush after the rise, and don't panic during a pullback.
🔥 ASTER/USDT Trading Strategy
Current Price: $0.748 (+12%)
Binance Spot | CoinGecko Rank #46
Short-Term (1-3 days):
- Currently Holding: Set a trailing stop to lock in profits
- Not Entered: Wait for a pullback to $0.68-$0.70 before jumping in, don't chase the highs
- Target Levels: $0.77 / $0.80
- Stop Loss: $0.64
Mid-Term (1-2 weeks):
- Hold core position, neither adding nor reducing
- If this week's close is above $0.72, trend is confirmed
- If it breaks below $0.65, the trend weakens
💥 Core Judgment: This is a genuine breakout with volume. Weekly candles have been bullish for 5 days straight, and today’s volume is accelerating. The long position is clearly defined, but chasing the highs carries significant risk. Waiting for a pullback to enter is safer.
In a nutshell: Don't rush after the rise, and don't panic during a pullback.
Current Price: $0.748 (+12%)
Binance Spot | CoinGecko Rank #46
Short-Term (1-3 days):
- Currently Holding: Set a trailing stop to lock in profits
- Not Entered: Wait for a pullback to $0.68-$0.70 before jumping in, don't chase the highs
- Target Levels: $0.77 / $0.80
- Stop Loss: $0.64
Mid-Term (1-2 weeks):
- Hold core position, neither adding nor reducing
- If this week's close is above $0.72, trend is confirmed
- If it breaks below $0.65, the trend weakens
💥 Core Judgment: This is a genuine breakout with volume. Weekly candles have been bullish for 5 days straight, and today’s volume is accelerating. The long position is clearly defined, but chasing the highs carries significant risk. Waiting for a pullback to enter is safer.
In a nutshell: Don't rush after the rise, and don't panic during a pullback.
135


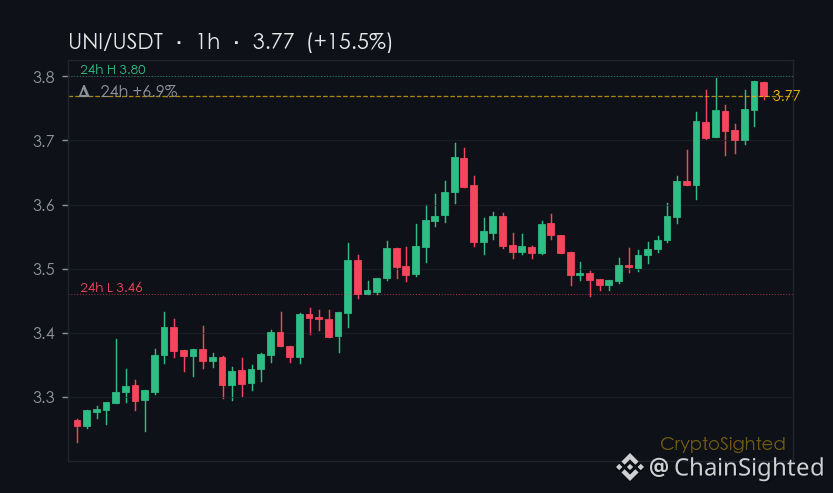
$UNI is up 6.9% in the last 24 hours — and that’s not the kind of move that comes out of nowhere.
The question is: what’s driving it?
The answer isn’t in the news. No major event has been tied to the move, and the price action doesn’t scream volatility or panic.
But here’s what’s interesting: the funding rate on UNI’s perpetual contracts is sitting at ↑0.0100%, a near-perfect balance between longs and shorts.
That’s a sign of something else entirely — a move that’s not being crowded by leverage.
Checkpoint: UNI’s funding rate is ↑0.0100% now — if it holds above that baseline tomorrow, it suggests the rally is still being driven by fundamental buyers, not just leverage. If it flips negative, that could be a sign of short-term pressure building.
Is this move being driven by on-chain activity or just price momentum?
📊 12 directional calls in the last 30d, every one auto-settled against price. Direction only — no buy/sell calls.
—
Not financial advice. DYOR.
📌 Funding Pulse · #46 · #FundingRate #CryptoSighted $UNI
$UNI is up 6.9% in the last 24 hours — and that’s not the kind of move that comes out of nowhere.
The question is: what’s driving it?
The answer isn’t in the news. No major event has been tied to the move, and the price action doesn’t scream volatility or panic.
But here’s what’s interesting: the funding rate on UNI’s perpetual contracts is sitting at ↑0.0100%, a near-perfect balance between longs and shorts.
That’s a sign of something else entirely — a move that’s not being crowded by leverage.
Checkpoint: UNI’s funding rate is ↑0.0100% now — if it holds above that baseline tomorrow, it suggests the rally is still being driven by fundamental buyers, not just leverage. If it flips negative, that could be a sign of short-term pressure building.
Is this move being driven by on-chain activity or just price momentum?
📊 12 directional calls in the last 30d, every one auto-settled against price. Direction only — no buy/sell calls.
—
Not financial advice. DYOR.
📌 Funding Pulse · #46 · #FundingRate #CryptoSighted $UNI
The question is: what’s driving it?
The answer isn’t in the news. No major event has been tied to the move, and the price action doesn’t scream volatility or panic.
But here’s what’s interesting: the funding rate on UNI’s perpetual contracts is sitting at ↑0.0100%, a near-perfect balance between longs and shorts.
That’s a sign of something else entirely — a move that’s not being crowded by leverage.
Checkpoint: UNI’s funding rate is ↑0.0100% now — if it holds above that baseline tomorrow, it suggests the rally is still being driven by fundamental buyers, not just leverage. If it flips negative, that could be a sign of short-term pressure building.
Is this move being driven by on-chain activity or just price momentum?
📊 12 directional calls in the last 30d, every one auto-settled against price. Direction only — no buy/sell calls.
—
Not financial advice. DYOR.
📌 Funding Pulse · #46 · #FundingRate #CryptoSighted $UNI
25
That was confusing.
Take a look at $TRX. Its price has moved, but not in a way that feels aligned with the rest of the market - or even with its own on-chain behavior.
Think of it like this: imagine you're at a restaurant. The waiter brings you a plate of food, but the menu says something else. It's not a disaster - just a mismatch between what you expected and what you received. That’s what’s happening with TRX now. The price isn’t quite matching up with the underlying fundamentals or the activity on-chain.
Is it spot bid or leverage push - which do you see?
—
For educational purposes only. Not financial advice.
📌 Crypto 101 · #46 · #CryptoEducation #CryptoSighted $TRX
That was confusing.
Take a look at $TRX . Its price has moved, but not in a way that feels aligned with the rest of the market - or even with its own on-chain behavior.
Think of it like this: imagine you're at a restaurant. The waiter brings you a plate of food, but the menu says something else. It's not a disaster - just a mismatch between what you expected and what you received. That’s what’s happening with TRX now. The price isn’t quite matching up with the underlying fundamentals or the activity on-chain.
Is it spot bid or leverage push - which do you see?
—
For educational purposes only. Not financial advice.
📌 Crypto 101 · #46 · #CryptoEducation #CryptoSighted $TRX
Take a look at $TRX . Its price has moved, but not in a way that feels aligned with the rest of the market - or even with its own on-chain behavior.
Think of it like this: imagine you're at a restaurant. The waiter brings you a plate of food, but the menu says something else. It's not a disaster - just a mismatch between what you expected and what you received. That’s what’s happening with TRX now. The price isn’t quite matching up with the underlying fundamentals or the activity on-chain.
Is it spot bid or leverage push - which do you see?
—
For educational purposes only. Not financial advice.
📌 Crypto 101 · #46 · #CryptoEducation #CryptoSighted $TRX
182
·
--
Behind the 500 million trade volume, there is one detail worth noting.
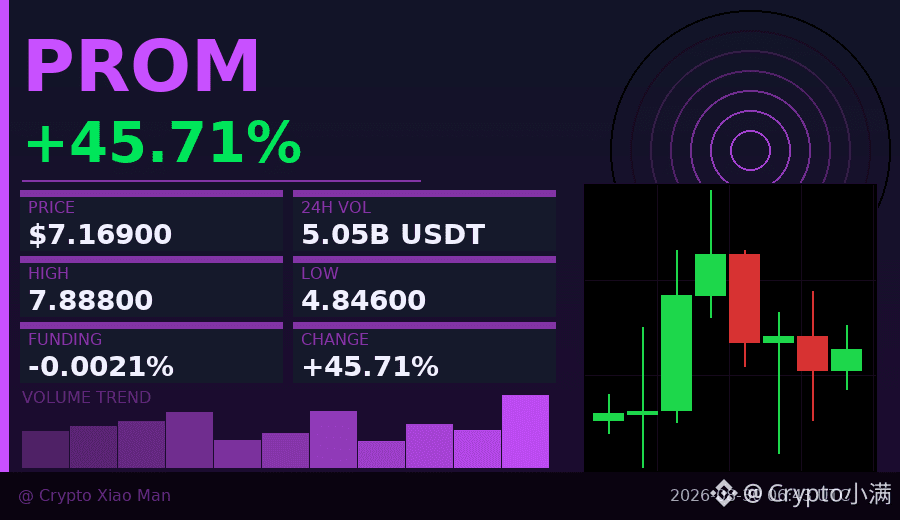
Today, PROM is up 46%, topping at 7.88 after rallying straight from a low of 4.84.
But looking at the long/short data, the surprising part is that the shorts are actually more—shorts account for 59%, while longs are only 40%.
This structure of “it’s up, yet shorts are still more” suggests that the people chasing shorts keep getting forced into stop-losses and adding to their positions.
Every pullback becomes an excuse for new late entrants who missed the move, and instead it keeps providing fuel for the bulls.
The funding rate is negative (-0.002%), meaning shorts are paying longs.
That negative funding rate by itself is a signal that there are still a large number of short positions sitting on the sidelines.
From the candlestick chart: over the past 8 hours the trend overall is stronger, but the last few candles show a bit of hesitation.
Volume at the highs is also shrinking—from 526 million down to 213 million—momentum is fading.
Where things stand now: the bulls are enjoying the shorts’ “funding subsidy,”
but once the shorts gradually give up and close their positions, this pushing force will disappear.
What to watch next is whether, during the pullback, there are truly buyers stepping in to absorb it.
$PROM #空头资金补贴 #46% surge—what’s behind it
Click the small card below to quickly check the行情👇
Behind the 500 million trade volume, there is one detail worth noting.
Today, PROM is up 46%, topping at 7.88 after rallying straight from a low of 4.84.
But looking at the long/short data, the surprising part is that the shorts are actually more—shorts account for 59%, while longs are only 40%.
This structure of “it’s up, yet shorts are still more” suggests that the people chasing shorts keep getting forced into stop-losses and adding to their positions.
Every pullback becomes an excuse for new late entrants who missed the move, and instead it keeps providing fuel for the bulls.
The funding rate is negative (-0.002%), meaning shorts are paying longs.
That negative funding rate by itself is a signal that there are still a large number of short positions sitting on the sidelines.
From the candlestick chart: over the past 8 hours the trend overall is stronger, but the last few candles show a bit of hesitation.
Volume at the highs is also shrinking—from 526 million down to 213 million—momentum is fading.
Where things stand now: the bulls are enjoying the shorts’ “funding subsidy,”
but once the shorts gradually give up and close their positions, this pushing force will disappear.
What to watch next is whether, during the pullback, there are truly buyers stepping in to absorb it.
$PROM #空头资金补贴 #46% surge—what’s behind it
Click the small card below to quickly check the行情👇
Today, PROM is up 46%, topping at 7.88 after rallying straight from a low of 4.84.
But looking at the long/short data, the surprising part is that the shorts are actually more—shorts account for 59%, while longs are only 40%.
This structure of “it’s up, yet shorts are still more” suggests that the people chasing shorts keep getting forced into stop-losses and adding to their positions.
Every pullback becomes an excuse for new late entrants who missed the move, and instead it keeps providing fuel for the bulls.
The funding rate is negative (-0.002%), meaning shorts are paying longs.
That negative funding rate by itself is a signal that there are still a large number of short positions sitting on the sidelines.
From the candlestick chart: over the past 8 hours the trend overall is stronger, but the last few candles show a bit of hesitation.
Volume at the highs is also shrinking—from 526 million down to 213 million—momentum is fading.
Where things stand now: the bulls are enjoying the shorts’ “funding subsidy,”
but once the shorts gradually give up and close their positions, this pushing force will disappear.
What to watch next is whether, during the pullback, there are truly buyers stepping in to absorb it.
$PROM #空头资金补贴 #46% surge—what’s behind it
Click the small card below to quickly check the行情👇
114

·
--
🔍 Today’s Project: $ASTER — Aster
Aster (Aster) is a blockchain project focused on providing solutions for decentralized data and services. It aims to build a system that enables developers to efficiently build distributed applications. The project stands out by offering the infrastructure that lets you use data and services securely and transparently on the blockchain—helping it target the rapidly growing decentralized data and services market. Its strongest point is that it focuses on connecting the digital world with real-world services in a decentralized way, giving it a distinct position in a market full of competing projects working in the same field.
📊 Today’s Numbers:
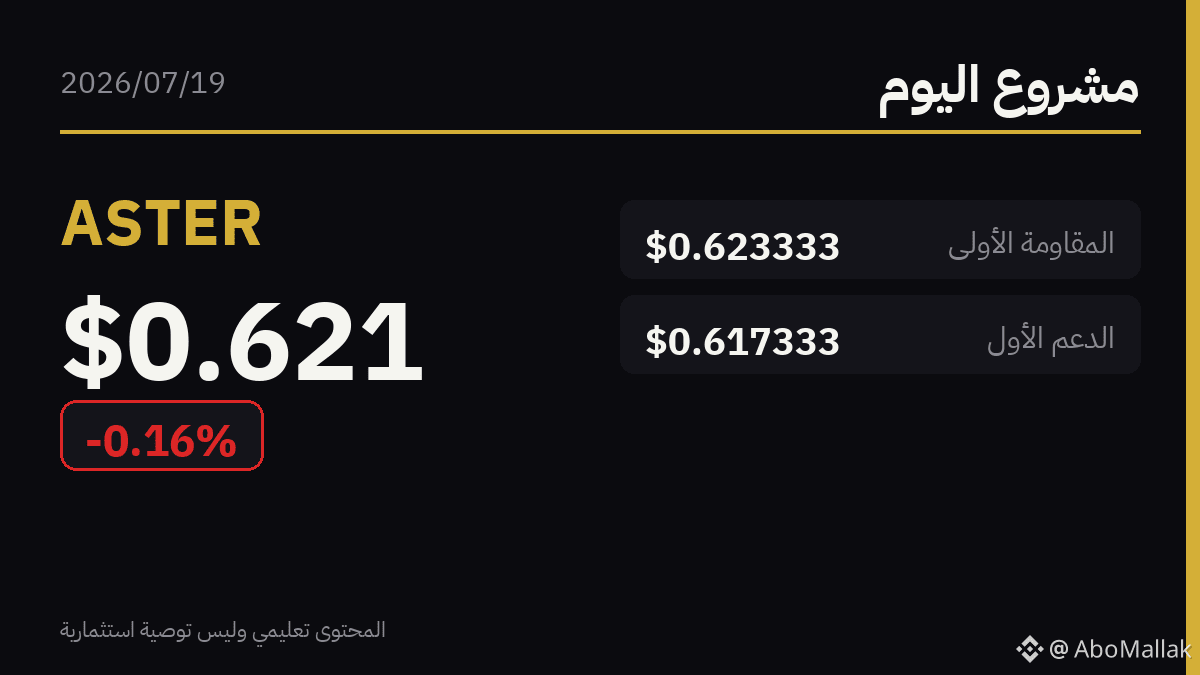
▪️ Price: $0.620773 (-0.0% in 24 hours)
▪️ Weekly Performance: -0.6%
▪️ Rank: #46 with a market value of $1.7B
⏳ The information at the time of writing this post may change—do your own research (DYOR)
The content is educational and not investment advice
🔍 Today’s Project: $ASTER — Aster
Aster (Aster) is a blockchain project focused on providing solutions for decentralized data and services. It aims to build a system that enables developers to efficiently build distributed applications. The project stands out by offering the infrastructure that lets you use data and services securely and transparently on the blockchain—helping it target the rapidly growing decentralized data and services market. Its strongest point is that it focuses on connecting the digital world with real-world services in a decentralized way, giving it a distinct position in a market full of competing projects working in the same field.
📊 Today’s Numbers:
▪️ Price: $0.620773 (-0.0% in 24 hours)
▪️ Weekly Performance: -0.6%
▪️ Rank: #46 with a market value of $1.7B
⏳ The information at the time of writing this post may change—do your own research (DYOR)
The content is educational and not investment advice
Aster (Aster) is a blockchain project focused on providing solutions for decentralized data and services. It aims to build a system that enables developers to efficiently build distributed applications. The project stands out by offering the infrastructure that lets you use data and services securely and transparently on the blockchain—helping it target the rapidly growing decentralized data and services market. Its strongest point is that it focuses on connecting the digital world with real-world services in a decentralized way, giving it a distinct position in a market full of competing projects working in the same field.
📊 Today’s Numbers:
▪️ Price: $0.620773 (-0.0% in 24 hours)
▪️ Weekly Performance: -0.6%
▪️ Rank: #46 with a market value of $1.7B
⏳ The information at the time of writing this post may change—do your own research (DYOR)
The content is educational and not investment advice
1
307

·
--
🔥 ASTER: Why the Top 50 Projects Deserve Your Attention?
CoinGecko rank #46, with a market cap in the top 50, but the chatter around ASTER is still way too low.
【Fundamental Logic】
Tokens that make it into the top 50 either have a strong community consensus or solid tech and use cases. ASTER's ability to hold this position is definitely backed by some solid fundamentals.
【Narrative Catalyst】
Looking at the recent 7-day trend from $0.62 to $0.748, the rise in both volume and price isn’t a coincidence. With an average daily volume hitting around 46 million, it indicates that big money is making systematic moves. What’s driving this? It could be ecosystem developments or new applications rolling out.
【Market Cap Logic】
What does being in the top 50 mean? It means it has already passed the brutal market filter. Projects in this range either don’t die or thrive really well.
【My Take】
The $0.65 level has held firm after three tests, forming a solid bottom. We're currently in the rapid upswing phase after breaking out. $0.77 is the next critical level; if we hold that, we’re eyeing $0.85.
Keep an eye on the fundamentals and follow the big money.
🔥 ASTER: Why the Top 50 Projects Deserve Your Attention?
CoinGecko rank #46, with a market cap in the top 50, but the chatter around ASTER is still way too low.
【Fundamental Logic】
Tokens that make it into the top 50 either have a strong community consensus or solid tech and use cases. ASTER's ability to hold this position is definitely backed by some solid fundamentals.
【Narrative Catalyst】
Looking at the recent 7-day trend from $0.62 to $0.748, the rise in both volume and price isn’t a coincidence. With an average daily volume hitting around 46 million, it indicates that big money is making systematic moves. What’s driving this? It could be ecosystem developments or new applications rolling out.
【Market Cap Logic】
What does being in the top 50 mean? It means it has already passed the brutal market filter. Projects in this range either don’t die or thrive really well.
【My Take】
The $0.65 level has held firm after three tests, forming a solid bottom. We're currently in the rapid upswing phase after breaking out. $0.77 is the next critical level; if we hold that, we’re eyeing $0.85.
Keep an eye on the fundamentals and follow the big money.
CoinGecko rank #46, with a market cap in the top 50, but the chatter around ASTER is still way too low.
【Fundamental Logic】
Tokens that make it into the top 50 either have a strong community consensus or solid tech and use cases. ASTER's ability to hold this position is definitely backed by some solid fundamentals.
【Narrative Catalyst】
Looking at the recent 7-day trend from $0.62 to $0.748, the rise in both volume and price isn’t a coincidence. With an average daily volume hitting around 46 million, it indicates that big money is making systematic moves. What’s driving this? It could be ecosystem developments or new applications rolling out.
【Market Cap Logic】
What does being in the top 50 mean? It means it has already passed the brutal market filter. Projects in this range either don’t die or thrive really well.
【My Take】
The $0.65 level has held firm after three tests, forming a solid bottom. We're currently in the rapid upswing phase after breaking out. $0.77 is the next critical level; if we hold that, we’re eyeing $0.85.
Keep an eye on the fundamentals and follow the big money.
204
Wall Street is trading tokenized securities - and it’s not just a footnote.
Binance recently added 10 bStocks tokenized securities as collateral assets, and Securitize and Cantor are now working on blockchain-based IPOs.
This isn’t just experimentation anymore - it’s infrastructure.
defense or offense - one word.
—
Not financial advice. DYOR.
📌 News Take · #46 · #CryptoNews #CryptoSighted
Wall Street is trading tokenized securities - and it’s not just a footnote.
Binance recently added 10 bStocks tokenized securities as collateral assets, and Securitize and Cantor are now working on blockchain-based IPOs.
This isn’t just experimentation anymore - it’s infrastructure.
defense or offense - one word.
—
Not financial advice. DYOR.
📌 News Take · #46 · #CryptoNews #CryptoSighted
Binance recently added 10 bStocks tokenized securities as collateral assets, and Securitize and Cantor are now working on blockchain-based IPOs.
This isn’t just experimentation anymore - it’s infrastructure.
defense or offense - one word.
—
Not financial advice. DYOR.
📌 News Take · #46 · #CryptoNews #CryptoSighted
195
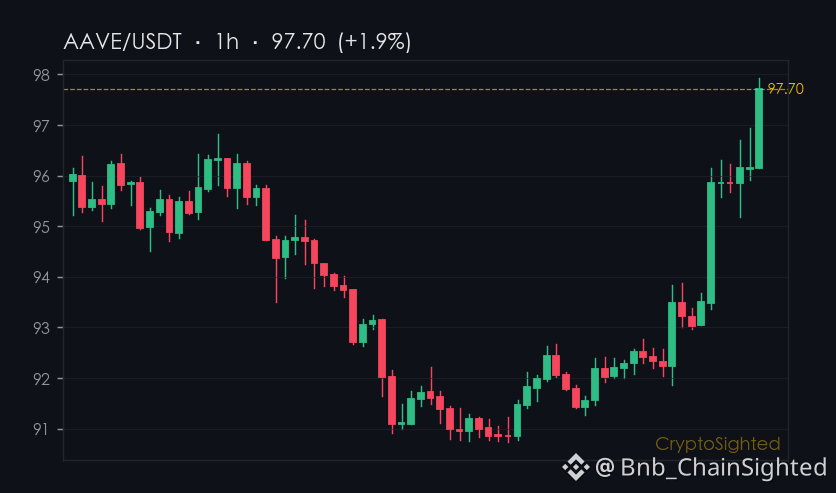
$AAVE’s derivatives market shows a 528,154 AAVE ($52M) in open interest with a ↑0.0045% funding rate - a microcosm of broader macro uncertainty.
The balance between longs and shorts in AAVE’s futures is delicate. At $97.75 per token, the open interest sits at $52M, and the funding rate is hovering just above zero, at ↑0.0045%. That’s not much, but it’s enough to suggest a quiet tug-of-war. Over the past 21 periods, the funding rate has accumulated to ↑0.058%, but in recent days, it’s settled into a near-zero average of ↑0.0028%. This isn’t a dramatic shift - but it is a signal. Leverage isn’t building quickly, nor is it bleeding out. It’s holding, like a breath held mid-sentence.
The broader market is moving, but AAVE’s derivatives market isn’t keeping pace. That’s not necessarily bad, but it’s not exactly a sign of confidence either. It’s a signal that the market is watching - but not yet committing.
—
Not financial advice. Crypto assets are high-risk; do your own research.
📌 Market Narrative · #46 · #CryptoMarket #CryptoSighted $AAVE
$AAVE ’s derivatives market shows a 528,154 AAVE ($52M) in open interest with a ↑0.0045% funding rate - a microcosm of broader macro uncertainty.
The balance between longs and shorts in AAVE’s futures is delicate. At $97.75 per token, the open interest sits at $52M, and the funding rate is hovering just above zero, at ↑0.0045%. That’s not much, but it’s enough to suggest a quiet tug-of-war. Over the past 21 periods, the funding rate has accumulated to ↑0.058%, but in recent days, it’s settled into a near-zero average of ↑0.0028%. This isn’t a dramatic shift - but it is a signal. Leverage isn’t building quickly, nor is it bleeding out. It’s holding, like a breath held mid-sentence.
The broader market is moving, but AAVE’s derivatives market isn’t keeping pace. That’s not necessarily bad, but it’s not exactly a sign of confidence either. It’s a signal that the market is watching - but not yet committing.
—
Not financial advice. Crypto assets are high-risk; do your own research.
📌 Market Narrative · #46 · #CryptoMarket #CryptoSighted $AAVE
The balance between longs and shorts in AAVE’s futures is delicate. At $97.75 per token, the open interest sits at $52M, and the funding rate is hovering just above zero, at ↑0.0045%. That’s not much, but it’s enough to suggest a quiet tug-of-war. Over the past 21 periods, the funding rate has accumulated to ↑0.058%, but in recent days, it’s settled into a near-zero average of ↑0.0028%. This isn’t a dramatic shift - but it is a signal. Leverage isn’t building quickly, nor is it bleeding out. It’s holding, like a breath held mid-sentence.
The broader market is moving, but AAVE’s derivatives market isn’t keeping pace. That’s not necessarily bad, but it’s not exactly a sign of confidence either. It’s a signal that the market is watching - but not yet committing.
—
Not financial advice. Crypto assets are high-risk; do your own research.
📌 Market Narrative · #46 · #CryptoMarket #CryptoSighted $AAVE
200

Article
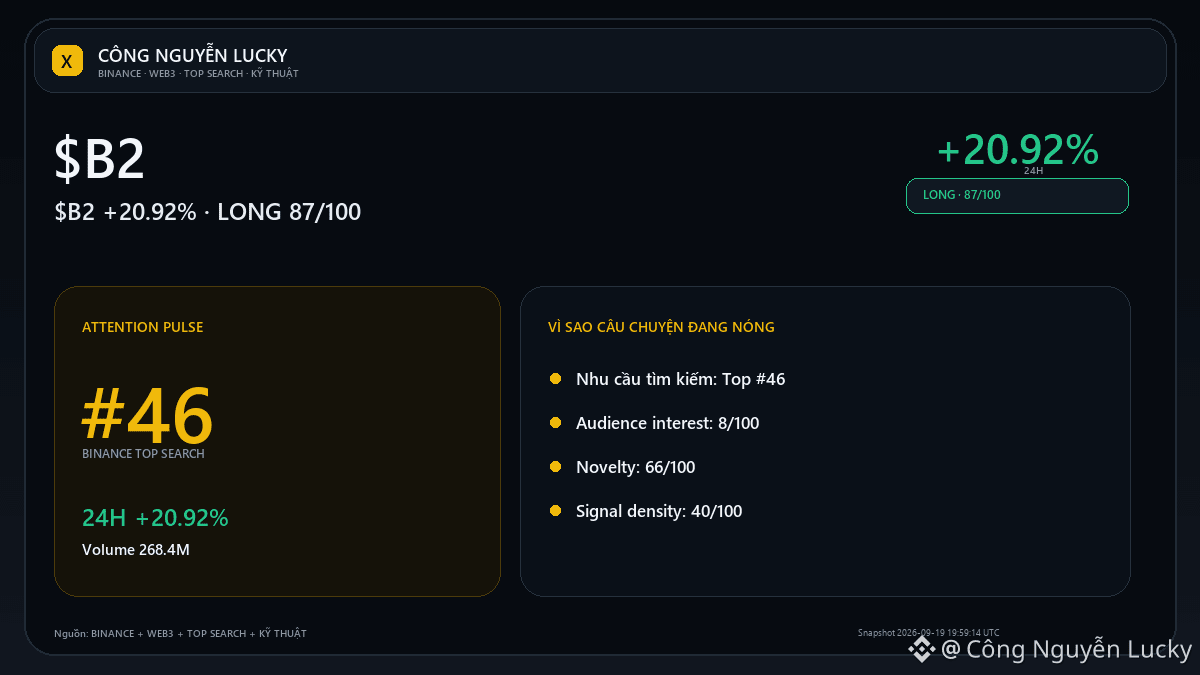
$B2: Fib 0.786 is the trend testing area$B2 is around 0.5248. If you only look at the current price, you’re still missing the most important part: what confirms or invalidates the thesis? Market: 0.5248 · 24h +20.92% · volume ~268.4M USDT · 3,973,713 trades.
Technical backdrop: MIXED · LONG bias 87/100.
Golden zone 0.50–0.618: 0.5988706–0.65885. Confirmation point: price reacts in the correct direction at the Fib zone and maintains the dominant structure/EMA.
Invalidation point: breaks 0.4073 along with momentum going against the bias. Technical layers being selected according to the current regime:
$B2: Fib 0.786 is the trend testing area
$B2 is around 0.5248. If you only look at the current price, you’re still missing the most important part: what confirms or invalidates the thesis? Market: 0.5248 · 24h +20.92% · volume ~268.4M USDT · 3,973,713 trades.
Technical backdrop: MIXED · LONG bias 87/100.
Golden zone 0.50–0.618: 0.5988706–0.65885. Confirmation point: price reacts in the correct direction at the Fib zone and maintains the dominant structure/EMA.
Invalidation point: breaks 0.4073 along with momentum going against the bias. Technical layers being selected according to the current regime:
Technical backdrop: MIXED · LONG bias 87/100.
Golden zone 0.50–0.618: 0.5988706–0.65885. Confirmation point: price reacts in the correct direction at the Fib zone and maintains the dominant structure/EMA.
Invalidation point: breaks 0.4073 along with momentum going against the bias. Technical layers being selected according to the current regime:
71
Article
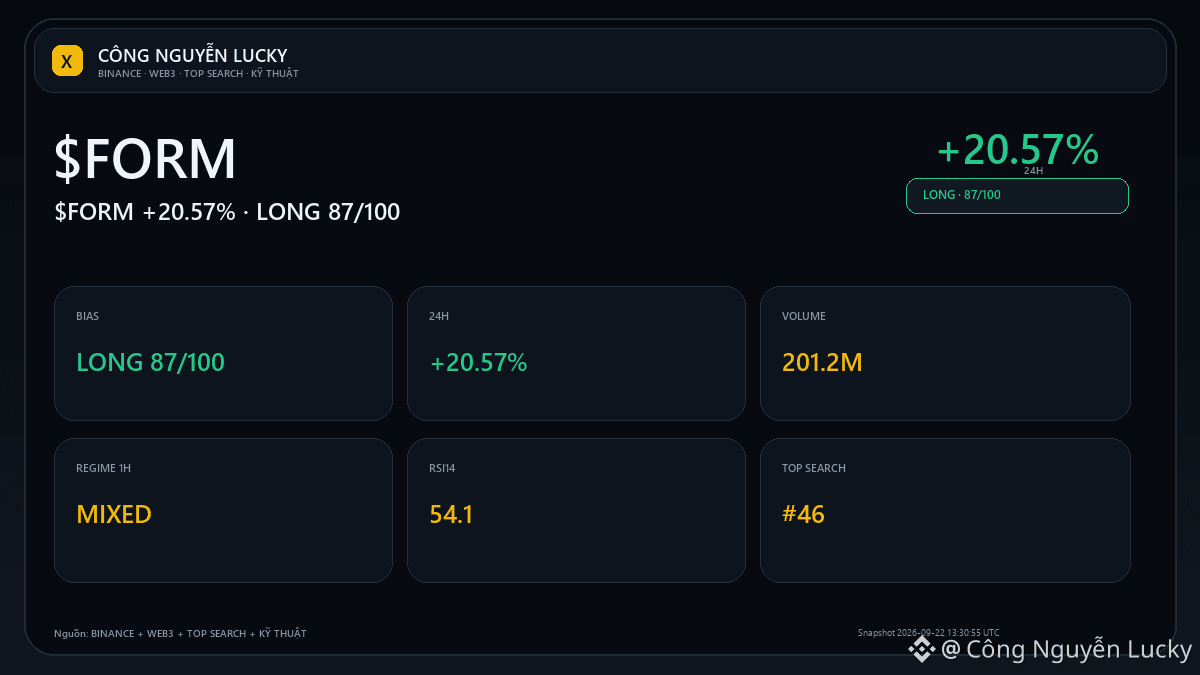
$FORM +20.57%: what other data still confirms this strong run?$FORM walking around 0.3212. If you only look at the current price, you still miss the most important part: what confirms or refutes the thesis? A coin running strong doesn’t mean you must chase the price, but it’s also not a reason to catch the top/bottom just because you see “it has gone too far.” Relating to the current market: 0.3212 · 24h +20.57% · volume ~201.2M USDT · 2,085,137 trades. Key takeaway: Follow the trend while the structure is still being confirmed; change your thesis when the data changes, not when your ego wants to win.
$FORM +20.57%: what other data still confirms this strong run?
$FORM walking around 0.3212. If you only look at the current price, you still miss the most important part: what confirms or refutes the thesis? A coin running strong doesn’t mean you must chase the price, but it’s also not a reason to catch the top/bottom just because you see “it has gone too far.” Relating to the current market: 0.3212 · 24h +20.57% · volume ~201.2M USDT · 2,085,137 trades. Key takeaway: Follow the trend while the structure is still being confirmed; change your thesis when the data changes, not when your ego wants to win.
267
Log in to explore more content
Join global crypto users on Binance Square
⚡️ Get latest and useful information about crypto.
💬 Trusted by the world’s largest crypto exchange.
👍 Discover real insights from verified creators.
Email / Phone number
Trending Topics
1
#CanBTCReboundAfterFallingBelow60K?
0 views
105 Discussing
2
#GlobalStocksFaceLongestLosingStreakSince2023
0 views
268 Discussing
3
#AnthropicPlungesTowardIPOPriceonDay2
0 views
40 Discussing
4
#GaoTengBitcoinETFListsOnHKEX
0 views
261 Discussing
5
#TradFiForBeginners
946,825 views
5,520 Discussing
6
#NvidiaBoardReportedlySplitOverHuang’sReturn
258,674 views
2,401 Discussing
7
#TetherBurns8BillionUSDTInPast20Days
0 views
99 Discussing
8
#BitcoinWalletSignatureFlawExploitableWithinSeconds
0 views
44 Discussing
9
#CanGTA6'sLaunchLiftTTWOShares?
207,868 views
1,709 Discussing
10
#HongKongProposesSFCLicensingForFourVirtualAssetServices
404 views
32 Discussing