
#alab
alab
11,990 views
324 Discussing
Hot
Latest

·
--
📉 ALABB Short-Term Bearish, 200 USDT Under Pressure
Before the US market opens on November 20, Astera Labs (ALAB) was trading at $199, down 5.95% from the previous close. The Philadelphia Semiconductor Index closed down 2.41% yesterday. Binance ALABB spot was around 201 USDT, with 24-hour trading volume equivalent to approximately $485,000. Within 2% of the order book, sell-side depth exceeded buy-side depth. Stock price (https://www.investing.com/equities/astera-labs)|Semiconductor index (https://indexes.nasdaqomx.com/Index/Overview/SOX)|Spot order book (https://www.coingecko.com/en/coins/astera-labs-bstocks-tokenized-stock)
The outlook for the next 4–24 hours is bearish, with a preference for a retest of 200 USDT after a rebound is capped; a break below that level would put 195 in view. The 205–210 USDT range is resistance for a rebound. The bearish outlook would be invalidated if the price holds above 210 on rising volume and the underlying stock also recovers. Tonight, watch the US market open and the University of Michigan's final consumer sentiment reading, due at 11 p.m. Beijing time. Release schedule (https://www.sca.isr.umich.edu/?os=win)
#ALABB #ALAB #半导体 #RWA
📉 ALABB Short-Term Bearish, 200 USDT Under Pressure
Before the US market opens on November 20, Astera Labs (ALAB) was trading at $199, down 5.95% from the previous close. The Philadelphia Semiconductor Index closed down 2.41% yesterday. Binance ALABB spot was around 201 USDT, with 24-hour trading volume equivalent to approximately $485,000. Within 2% of the order book, sell-side depth exceeded buy-side depth. Stock price (https://www.investing.com/equities/astera-labs)|Semiconductor index (https://indexes.nasdaqomx.com/Index/Overview/SOX)|Spot order book (https://www.coingecko.com/en/coins/astera-labs-bstocks-tokenized-stock)
The outlook for the next 4–24 hours is bearish, with a preference for a retest of 200 USDT after a rebound is capped; a break below that level would put 195 in view. The 205–210 USDT range is resistance for a rebound. The bearish outlook would be invalidated if the price holds above 210 on rising volume and the underlying stock also recovers. Tonight, watch the US market open and the University of Michigan's final consumer sentiment reading, due at 11 p.m. Beijing time. Release schedule (https://www.sca.isr.umich.edu/?os=win)
#ALABB #ALAB #半导体 #RWA
Before the US market opens on November 20, Astera Labs (ALAB) was trading at $199, down 5.95% from the previous close. The Philadelphia Semiconductor Index closed down 2.41% yesterday. Binance ALABB spot was around 201 USDT, with 24-hour trading volume equivalent to approximately $485,000. Within 2% of the order book, sell-side depth exceeded buy-side depth. Stock price (https://www.investing.com/equities/astera-labs)|Semiconductor index (https://indexes.nasdaqomx.com/Index/Overview/SOX)|Spot order book (https://www.coingecko.com/en/coins/astera-labs-bstocks-tokenized-stock)
The outlook for the next 4–24 hours is bearish, with a preference for a retest of 200 USDT after a rebound is capped; a break below that level would put 195 in view. The 205–210 USDT range is resistance for a rebound. The bearish outlook would be invalidated if the price holds above 210 on rising volume and the underlying stock also recovers. Tonight, watch the US market open and the University of Michigan's final consumer sentiment reading, due at 11 p.m. Beijing time. Release schedule (https://www.sca.isr.umich.edu/?os=win)
#ALABB #ALAB #半导体 #RWA
·
--
📉 ALABB is bearish in the short term; 206.65 is key
A Binance spot-monitor snapshot reported 210.61 USDT. An earlier snapshot at 04:00 Beijing time on November 20 reported 215.32 USDT, down 0.27% over the rolling 24 hours, with trading volume of about $302,000. The latest order book has not yet been verified. Spot monitor (https://www.cexscan.com/binance/spot-monitor) · Timestamped snapshot (https://stocknas.com/en/stock/ALAB)
Astera Labs (ALAB) surged on heavy volume Thursday before retreating, closing at $211.60, down 2.38%; it fell a further 2.41% after hours at 19:45 ET. The Philadelphia Semiconductor Index closed down 2.41%. Nasdaq is now closed, while Binance spot trading continues. Stock quote (https://finance.yahoo.com/quote/ALAB/) · Sector performance (https://ycharts.com/indices/%5ESOX/level) · Binance trading hours (https://www.binance.com/en/blog/markets/7938718877635190290)
Over the next 4–24 hours, the price is likely to retest 206.65 USDT; a break below that level would increase downside pressure. The first rebound target is 213–215 USDT. If the price holds above 215 on rising volume for one hour, the bearish outlook is invalidated. Watch for the final US consumer confidence reading at 23:00 Beijing time tonight. Spot range (https://www.cryptometer.io/data/binance/alabb/usdt) · Data calendar (https://www.sca.isr.umich.edu/)
#ALABB #ALAB #半导体 #RWA
📉 ALABB is bearish in the short term; 206.65 is key
A Binance spot-monitor snapshot reported 210.61 USDT. An earlier snapshot at 04:00 Beijing time on November 20 reported 215.32 USDT, down 0.27% over the rolling 24 hours, with trading volume of about $302,000. The latest order book has not yet been verified. Spot monitor (https://www.cexscan.com/binance/spot-monitor) · Timestamped snapshot (https://stocknas.com/en/stock/ALAB)
Astera Labs (ALAB) surged on heavy volume Thursday before retreating, closing at $211.60, down 2.38%; it fell a further 2.41% after hours at 19:45 ET. The Philadelphia Semiconductor Index closed down 2.41%. Nasdaq is now closed, while Binance spot trading continues. Stock quote (https://finance.yahoo.com/quote/ALAB/) · Sector performance (https://ycharts.com/indices/%5ESOX/level) · Binance trading hours (https://www.binance.com/en/blog/markets/7938718877635190290)
Over the next 4–24 hours, the price is likely to retest 206.65 USDT; a break below that level would increase downside pressure. The first rebound target is 213–215 USDT. If the price holds above 215 on rising volume for one hour, the bearish outlook is invalidated. Watch for the final US consumer confidence reading at 23:00 Beijing time tonight. Spot range (https://www.cryptometer.io/data/binance/alabb/usdt) · Data calendar (https://www.sca.isr.umich.edu/)
#ALABB #ALAB #半导体 #RWA
A Binance spot-monitor snapshot reported 210.61 USDT. An earlier snapshot at 04:00 Beijing time on November 20 reported 215.32 USDT, down 0.27% over the rolling 24 hours, with trading volume of about $302,000. The latest order book has not yet been verified. Spot monitor (https://www.cexscan.com/binance/spot-monitor) · Timestamped snapshot (https://stocknas.com/en/stock/ALAB)
Astera Labs (ALAB) surged on heavy volume Thursday before retreating, closing at $211.60, down 2.38%; it fell a further 2.41% after hours at 19:45 ET. The Philadelphia Semiconductor Index closed down 2.41%. Nasdaq is now closed, while Binance spot trading continues. Stock quote (https://finance.yahoo.com/quote/ALAB/) · Sector performance (https://ycharts.com/indices/%5ESOX/level) · Binance trading hours (https://www.binance.com/en/blog/markets/7938718877635190290)
Over the next 4–24 hours, the price is likely to retest 206.65 USDT; a break below that level would increase downside pressure. The first rebound target is 213–215 USDT. If the price holds above 215 on rising volume for one hour, the bearish outlook is invalidated. Watch for the final US consumer confidence reading at 23:00 Beijing time tonight. Spot range (https://www.cryptometer.io/data/binance/alabb/usdt) · Data calendar (https://www.sca.isr.umich.edu/)
#ALABB #ALAB #半导体 #RWA
29
·
--
📉 ALABB surged and pulled back; bearish in the short term, with 213 as the key level
During US trading hours on November 19, Binance’s ALABBUSDT spot snapshot showed 216.56 USDT, up 1.00% over 24 hours, with approximately 1,300 coins traded and a range of 213.06–239.85 USDT. The price has fallen nearly 10% from the range high, and rebound momentum is weakening. Spot market data (https://coinalyze.net/markets/?exchange=A.&page=41)
The underlying US-listed stock, Astera Labs (ALAB), fell from around $240 intraday to $219.23. The Philadelphia Semiconductor Index was down 1.59% intraday, with sector weakness weighing on the rebound. US stock data (https://finance.yahoo.com/quote/ALAB/) · Philadelphia Semiconductor Index (https://indexes.nasdaqomx.com/Index/Overview/SOX?promoCode=SRPR7UXBB&promoType=Referrer)
Over the next 4–24 hours, the price is likely to test 213 USDT first; a break below that level could take it to 207. Resistance on a rebound is at 220–227. If it holds above 227 on increased volume, the short-term bearish outlook is invalidated. The final US consumer confidence reading, due at 23:00 Beijing time on the 20th, could amplify volatility. Data calendar (https://www.sca.isr.umich.edu/?lctg=6796bccb7b375dec1909a709)
#ALABB #ALAB #半导体 #RWA
📉 ALABB surged and pulled back; bearish in the short term, with 213 as the key level
During US trading hours on November 19, Binance’s ALABBUSDT spot snapshot showed 216.56 USDT, up 1.00% over 24 hours, with approximately 1,300 coins traded and a range of 213.06–239.85 USDT. The price has fallen nearly 10% from the range high, and rebound momentum is weakening. Spot market data (https://coinalyze.net/markets/?exchange=A.&page=41)
The underlying US-listed stock, Astera Labs (ALAB), fell from around $240 intraday to $219.23. The Philadelphia Semiconductor Index was down 1.59% intraday, with sector weakness weighing on the rebound. US stock data (https://finance.yahoo.com/quote/ALAB/) · Philadelphia Semiconductor Index (https://indexes.nasdaqomx.com/Index/Overview/SOX?promoCode=SRPR7UXBB&promoType=Referrer)
Over the next 4–24 hours, the price is likely to test 213 USDT first; a break below that level could take it to 207. Resistance on a rebound is at 220–227. If it holds above 227 on increased volume, the short-term bearish outlook is invalidated. The final US consumer confidence reading, due at 23:00 Beijing time on the 20th, could amplify volatility. Data calendar (https://www.sca.isr.umich.edu/?lctg=6796bccb7b375dec1909a709)
#ALABB #ALAB #半导体 #RWA
During US trading hours on November 19, Binance’s ALABBUSDT spot snapshot showed 216.56 USDT, up 1.00% over 24 hours, with approximately 1,300 coins traded and a range of 213.06–239.85 USDT. The price has fallen nearly 10% from the range high, and rebound momentum is weakening. Spot market data (https://coinalyze.net/markets/?exchange=A.&page=41)
The underlying US-listed stock, Astera Labs (ALAB), fell from around $240 intraday to $219.23. The Philadelphia Semiconductor Index was down 1.59% intraday, with sector weakness weighing on the rebound. US stock data (https://finance.yahoo.com/quote/ALAB/) · Philadelphia Semiconductor Index (https://indexes.nasdaqomx.com/Index/Overview/SOX?promoCode=SRPR7UXBB&promoType=Referrer)
Over the next 4–24 hours, the price is likely to test 213 USDT first; a break below that level could take it to 207. Resistance on a rebound is at 220–227. If it holds above 227 on increased volume, the short-term bearish outlook is invalidated. The final US consumer confidence reading, due at 23:00 Beijing time on the 20th, could amplify volatility. Data calendar (https://www.sca.isr.umich.edu/?lctg=6796bccb7b375dec1909a709)
#ALABB #ALAB #半导体 #RWA
1
38

·
--
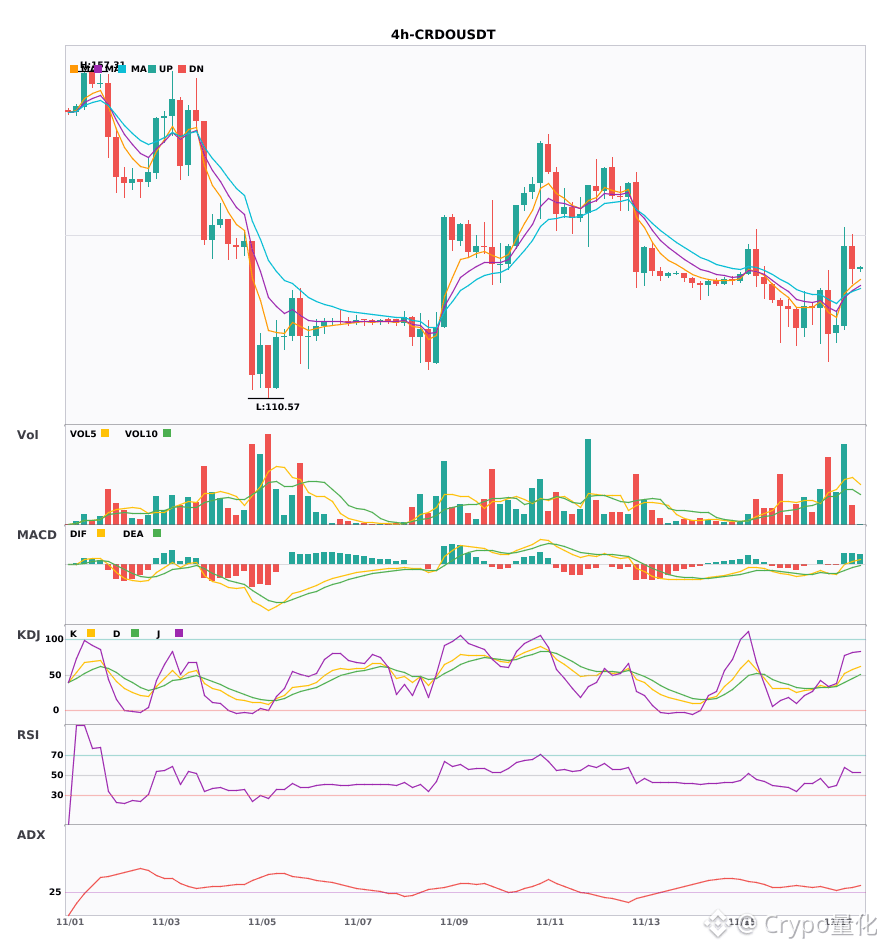
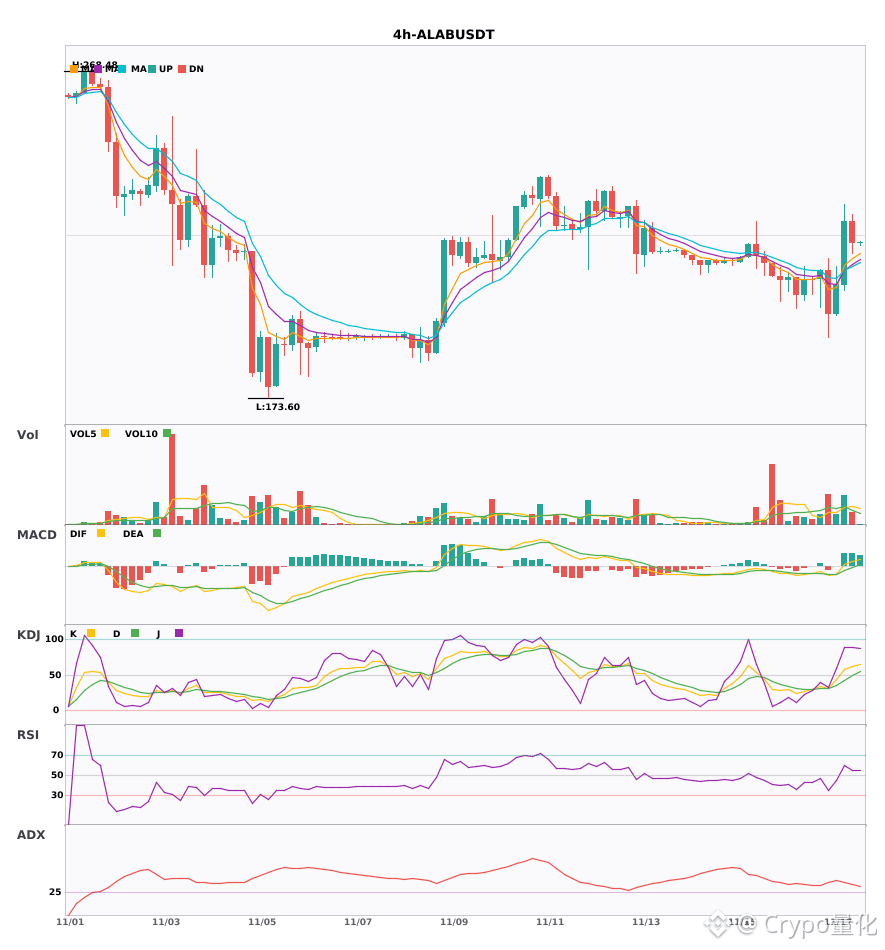
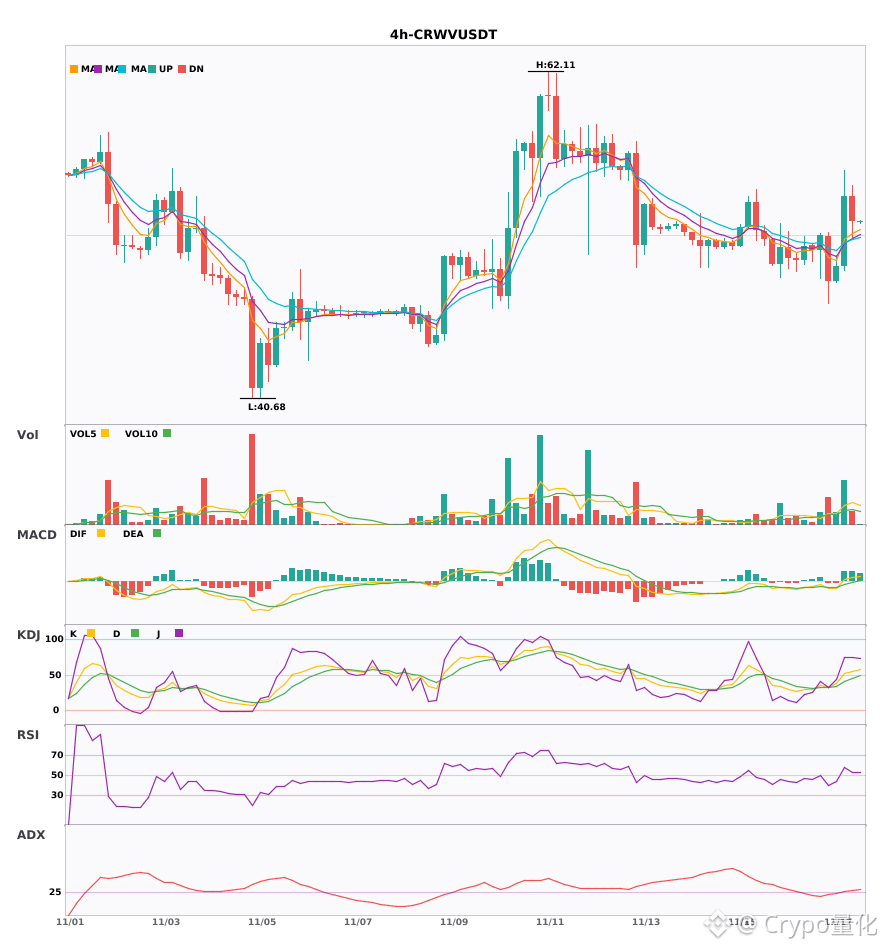
$CRDO/$ALAB/$CRWV 4-hour moving averages are all diverging— which one is stronger? 🔥
════════════════════
🔴 $CRDO 4-hour bullish signal
⚠️ Technicals: ADX is at 33, and the trend is taking shape. After a MACD golden cross, DIF moved above the zero line, turning bullish. Moving averages are bullishly aligned and diverging upward. Volume surged to 2.3x.
════════════════════
🔴 $ALAB 4-hour bullish signal
⚠️ Technicals: The trend is clear. Volume increased after a bullish MACD golden cross, but the histogram bars are shrinking. Moving averages are bullishly aligned and diverging upward. Volume increased 1.5x.
════════════════════
🔴 $CRWV 4-hour bullish signal
⚠️ Technicals: ADX is at 29, and the trend is just getting started—there’s still time to get in. MACD remains bullish after a golden cross, but momentum is weakening. Moving averages are bullishly aligned and diverging upward. Volume surged to 3.1x.
════════════════════
🔔 Follow for real-time market alerts 🔔
#技术分析 #CRDO #ALAB #CRWV
📌 When trading, pay attention to whether the candlestick patterns meet the criteria
$CRDO /$ALAB /$CRWV 4-hour moving averages are all diverging— which one is stronger? 🔥
════════════════════
🔴 $CRDO 4-hour bullish signal
⚠️ Technicals: ADX is at 33, and the trend is taking shape. After a MACD golden cross, DIF moved above the zero line, turning bullish. Moving averages are bullishly aligned and diverging upward. Volume surged to 2.3x.
════════════════════
🔴 $ALAB 4-hour bullish signal
⚠️ Technicals: The trend is clear. Volume increased after a bullish MACD golden cross, but the histogram bars are shrinking. Moving averages are bullishly aligned and diverging upward. Volume increased 1.5x.
════════════════════
🔴 $CRWV 4-hour bullish signal
⚠️ Technicals: ADX is at 29, and the trend is just getting started—there’s still time to get in. MACD remains bullish after a golden cross, but momentum is weakening. Moving averages are bullishly aligned and diverging upward. Volume surged to 3.1x.
════════════════════
🔔 Follow for real-time market alerts 🔔
#技术分析 #CRDO #ALAB #CRWV
📌 When trading, pay attention to whether the candlestick patterns meet the criteria
════════════════════
🔴 $CRDO 4-hour bullish signal
⚠️ Technicals: ADX is at 33, and the trend is taking shape. After a MACD golden cross, DIF moved above the zero line, turning bullish. Moving averages are bullishly aligned and diverging upward. Volume surged to 2.3x.
════════════════════
🔴 $ALAB 4-hour bullish signal
⚠️ Technicals: The trend is clear. Volume increased after a bullish MACD golden cross, but the histogram bars are shrinking. Moving averages are bullishly aligned and diverging upward. Volume increased 1.5x.
════════════════════
🔴 $CRWV 4-hour bullish signal
⚠️ Technicals: ADX is at 29, and the trend is just getting started—there’s still time to get in. MACD remains bullish after a golden cross, but momentum is weakening. Moving averages are bullishly aligned and diverging upward. Volume surged to 3.1x.
════════════════════
🔔 Follow for real-time market alerts 🔔
#技术分析 #CRDO #ALAB #CRWV
📌 When trading, pay attention to whether the candlestick patterns meet the criteria
2

·
--
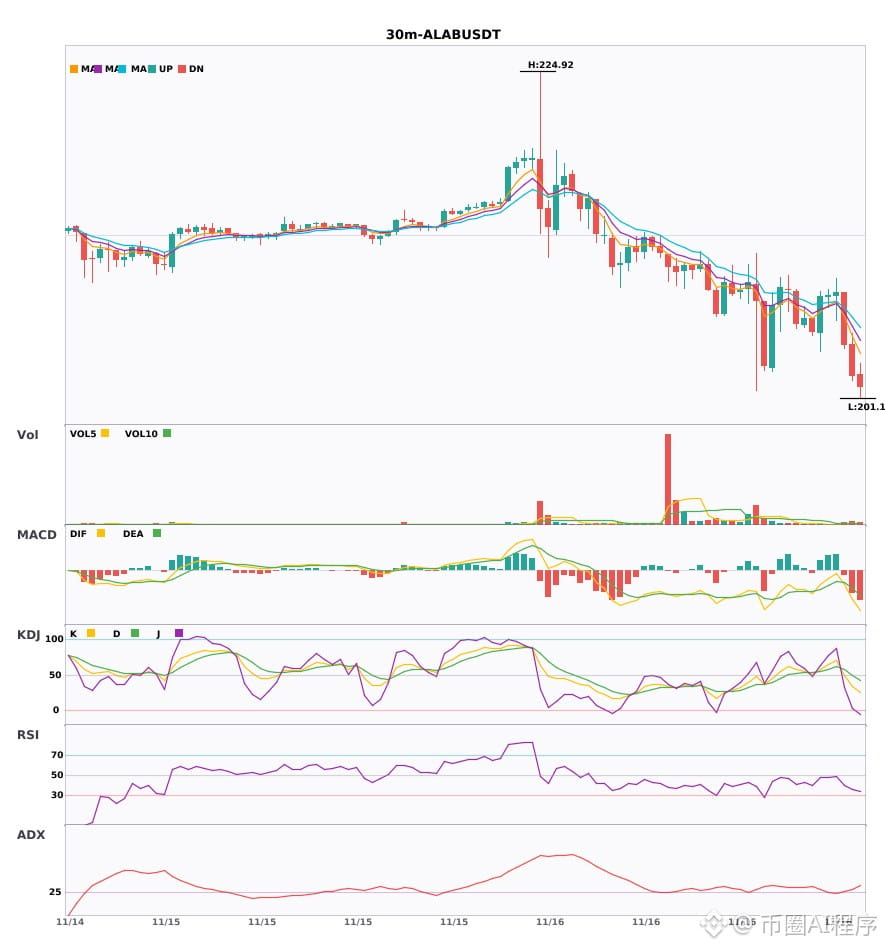
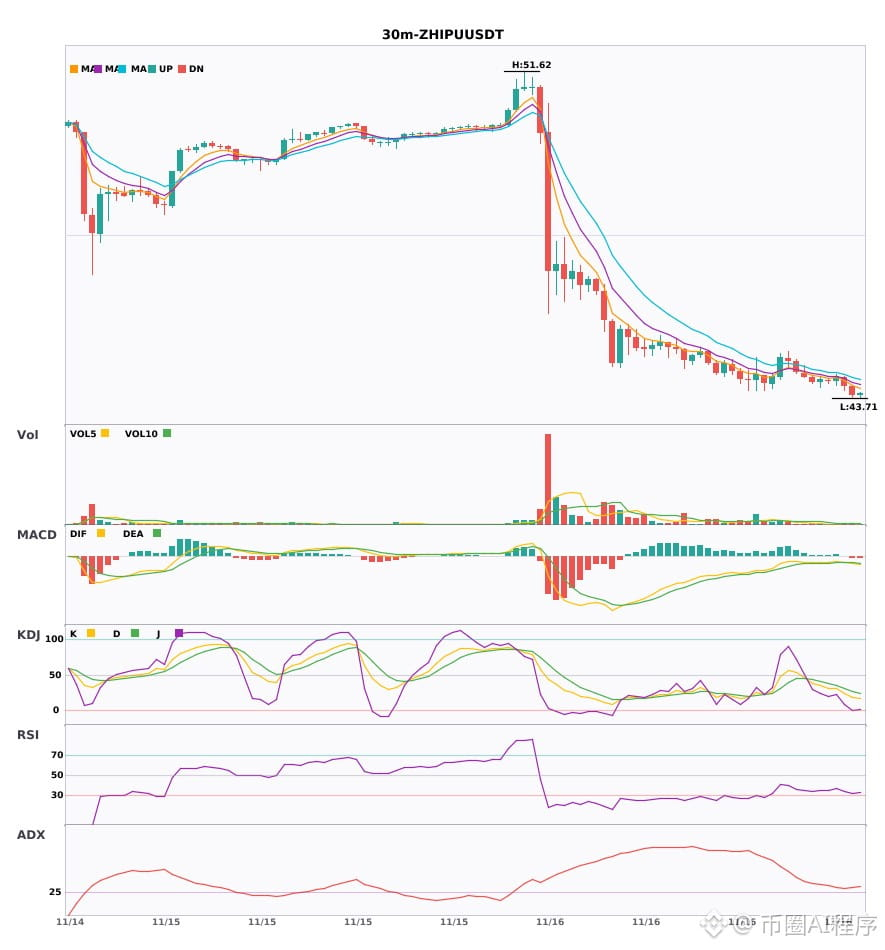
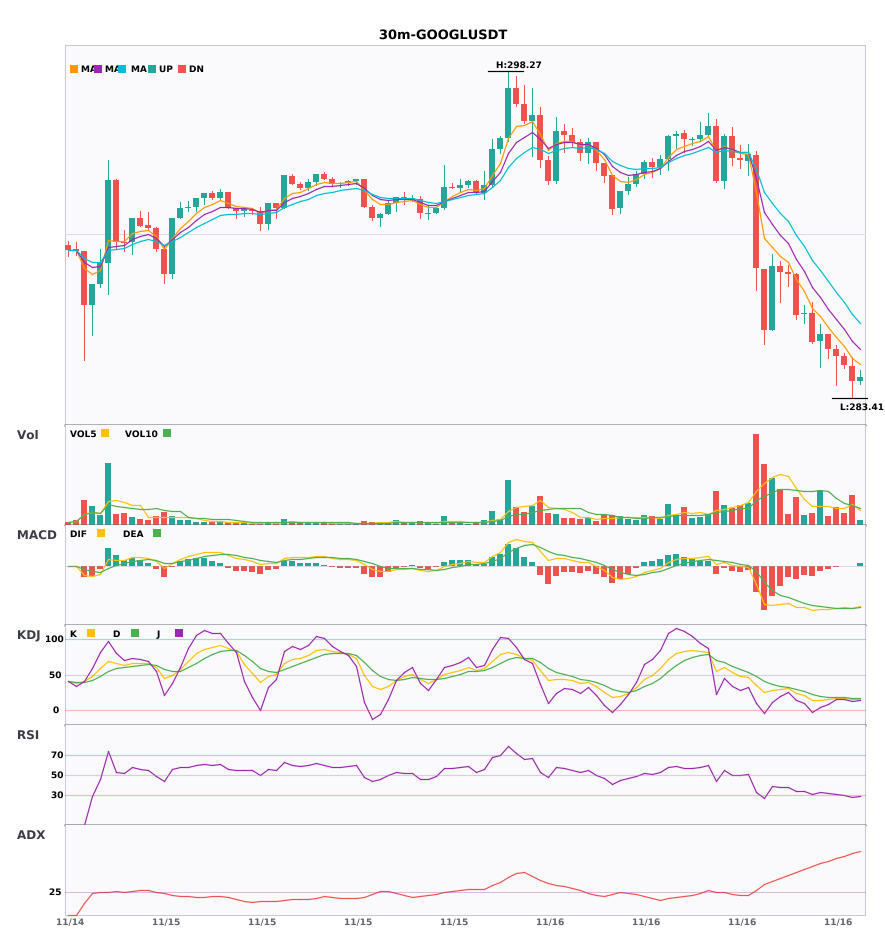
$ALAB $ZHIPU $GOOGL 30-minute moving averages are diverging bearishly; the 4-hour bearish trend is confirmed 🔥
════════════════════
🟢 $ALAB 30-minute bearish signal
⚠️ Technical analysis: 4-hour bearish trend + 30-minute confluence confirmed! The 30-minute MACD death cross is producing expanding green bars, the moving averages have just formed a bearish alignment, and the KDJ death cross has not yet entered the oversold zone. Trading volume has doubled.
════════════════════
🟢 $ZHIPU 30-minute bearish signal
⚠️ Technical analysis: 4-hour + 30-minute bearish confluence confirmed! After the 30-minute MACD death cross, the green bars continue to expand. The moving averages are aligned bearishly and diverging downward. KDJ is weak but not oversold (K18.4 D27.2). Volume has increased by a normal 1.2x; bears are in control.
════════════════════
🟢 $GOOGL 30-minute bearish signal
⚠️ Technical analysis: 4-hour bearish trend + 30-minute confluence confirmed. The MACD death cross is producing expanding green bars, the moving averages are diverging downward in a bearish alignment, and KDJ is in the oversold zone (K15.6 D17.1). Volume is up 1.5x.
════════════════════
🔔 Follow for first-hand market updates 🔔
#多周期共振 #ALAB #ZHIPU #GOOGL
📌 When trading, pay attention to whether the candlestick pattern matches.
$ALAB $ZHIPU $GOOGL 30-minute moving averages are diverging bearishly; the 4-hour bearish trend is confirmed 🔥
════════════════════
🟢 $ALAB 30-minute bearish signal
⚠️ Technical analysis: 4-hour bearish trend + 30-minute confluence confirmed! The 30-minute MACD death cross is producing expanding green bars, the moving averages have just formed a bearish alignment, and the KDJ death cross has not yet entered the oversold zone. Trading volume has doubled.
════════════════════
🟢 $ZHIPU 30-minute bearish signal
⚠️ Technical analysis: 4-hour + 30-minute bearish confluence confirmed! After the 30-minute MACD death cross, the green bars continue to expand. The moving averages are aligned bearishly and diverging downward. KDJ is weak but not oversold (K18.4 D27.2). Volume has increased by a normal 1.2x; bears are in control.
════════════════════
🟢 $GOOGL 30-minute bearish signal
⚠️ Technical analysis: 4-hour bearish trend + 30-minute confluence confirmed. The MACD death cross is producing expanding green bars, the moving averages are diverging downward in a bearish alignment, and KDJ is in the oversold zone (K15.6 D17.1). Volume is up 1.5x.
════════════════════
🔔 Follow for first-hand market updates 🔔
#多周期共振 #ALAB #ZHIPU #GOOGL
📌 When trading, pay attention to whether the candlestick pattern matches.
════════════════════
🟢 $ALAB 30-minute bearish signal
⚠️ Technical analysis: 4-hour bearish trend + 30-minute confluence confirmed! The 30-minute MACD death cross is producing expanding green bars, the moving averages have just formed a bearish alignment, and the KDJ death cross has not yet entered the oversold zone. Trading volume has doubled.
════════════════════
🟢 $ZHIPU 30-minute bearish signal
⚠️ Technical analysis: 4-hour + 30-minute bearish confluence confirmed! After the 30-minute MACD death cross, the green bars continue to expand. The moving averages are aligned bearishly and diverging downward. KDJ is weak but not oversold (K18.4 D27.2). Volume has increased by a normal 1.2x; bears are in control.
════════════════════
🟢 $GOOGL 30-minute bearish signal
⚠️ Technical analysis: 4-hour bearish trend + 30-minute confluence confirmed. The MACD death cross is producing expanding green bars, the moving averages are diverging downward in a bearish alignment, and KDJ is in the oversold zone (K15.6 D17.1). Volume is up 1.5x.
════════════════════
🔔 Follow for first-hand market updates 🔔
#多周期共振 #ALAB #ZHIPU #GOOGL
📌 When trading, pay attention to whether the candlestick pattern matches.
14

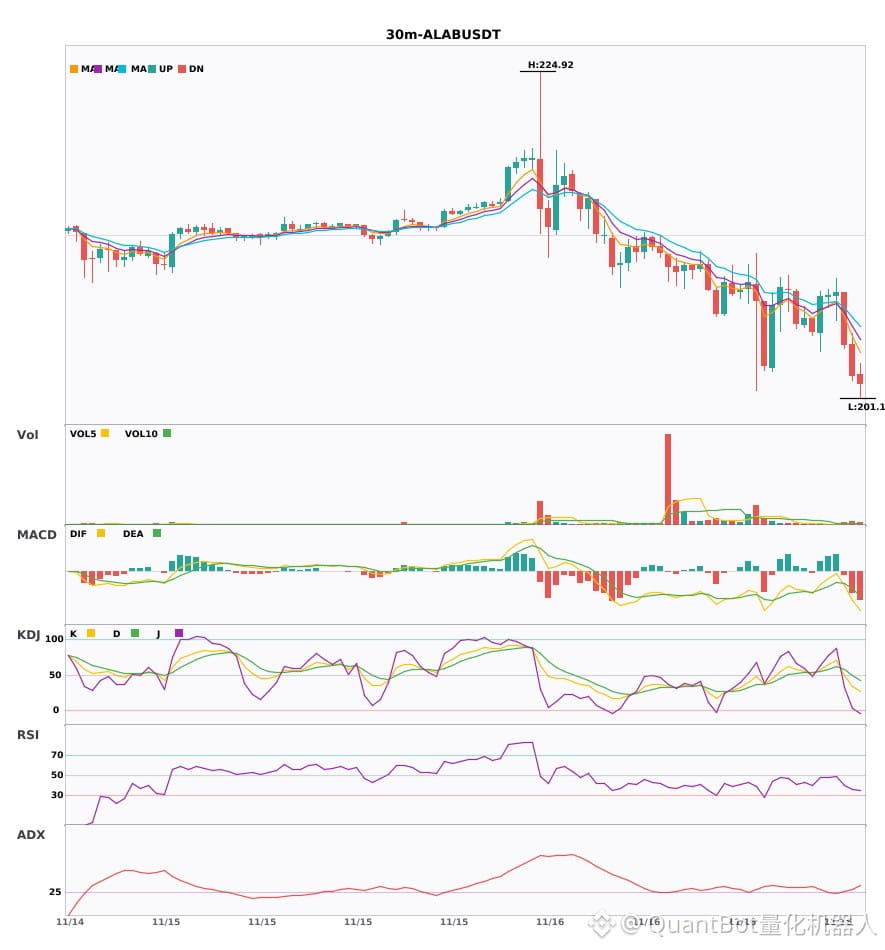
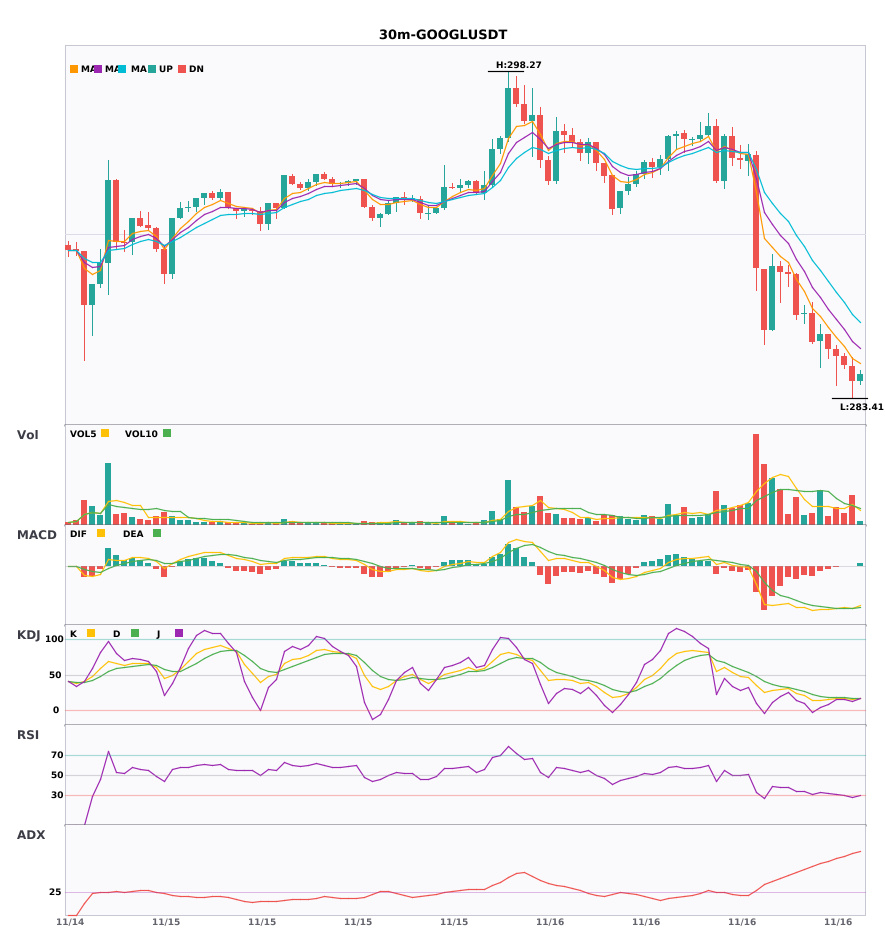
$ALAB/$GOOGL 30-minute cycle synchronized downward; be mindful of risk exposure
📉 $ALAB | 30-minute bearish signal
━━━━━━━━━━━━━━━━━━
Technical analysis: ADX(25) indicates the trend is starting; consider entering. MACD bearish crossover below zero; bearish momentum is strengthening. EMA5 crossed below EMA8, turning bearish in the short term. KDJ bearish crossover (K49.3/D57.7), leaning bearish. Volume increased 2.0x.
Price change: -1.8300%
📉 $GOOGL | 30-minute bearish signal
━━━━━━━━━━━━━━━━━━
Technical analysis: ADX73—guard against overheating. MACD bearish crossover. EMAs in bearish alignment. KDJ oversold (K15.6/D17.1), potential rebound. Volume 1.5x.
Price change: -0.2500%
━━━━━━━━━━━━━━━━━━
#技术分析 #ALAB #GOOGL
📌 The above is for reference only and does not constitute investment advice.
$ALAB /$GOOGL 30-minute cycle synchronized downward; be mindful of risk exposure
📉 $ALAB | 30-minute bearish signal
━━━━━━━━━━━━━━━━━━
Technical analysis: ADX(25) indicates the trend is starting; consider entering. MACD bearish crossover below zero; bearish momentum is strengthening. EMA5 crossed below EMA8, turning bearish in the short term. KDJ bearish crossover (K49.3/D57.7), leaning bearish. Volume increased 2.0x.
Price change: -1.8300%
📉 $GOOGL | 30-minute bearish signal
━━━━━━━━━━━━━━━━━━
Technical analysis: ADX73—guard against overheating. MACD bearish crossover. EMAs in bearish alignment. KDJ oversold (K15.6/D17.1), potential rebound. Volume 1.5x.
Price change: -0.2500%
━━━━━━━━━━━━━━━━━━
#技术分析 #ALAB #GOOGL
📌 The above is for reference only and does not constitute investment advice.
📉 $ALAB | 30-minute bearish signal
━━━━━━━━━━━━━━━━━━
Technical analysis: ADX(25) indicates the trend is starting; consider entering. MACD bearish crossover below zero; bearish momentum is strengthening. EMA5 crossed below EMA8, turning bearish in the short term. KDJ bearish crossover (K49.3/D57.7), leaning bearish. Volume increased 2.0x.
Price change: -1.8300%
📉 $GOOGL | 30-minute bearish signal
━━━━━━━━━━━━━━━━━━
Technical analysis: ADX73—guard against overheating. MACD bearish crossover. EMAs in bearish alignment. KDJ oversold (K15.6/D17.1), potential rebound. Volume 1.5x.
Price change: -0.2500%
━━━━━━━━━━━━━━━━━━
#技术分析 #ALAB #GOOGL
📌 The above is for reference only and does not constitute investment advice.
8
·
--
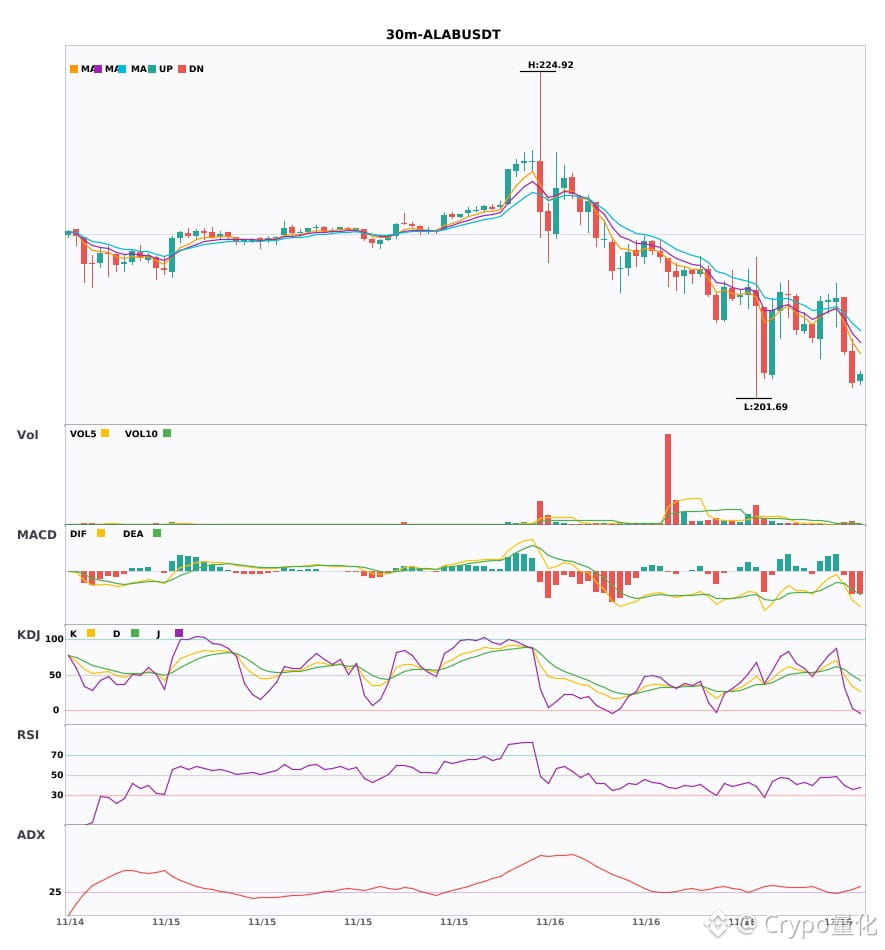
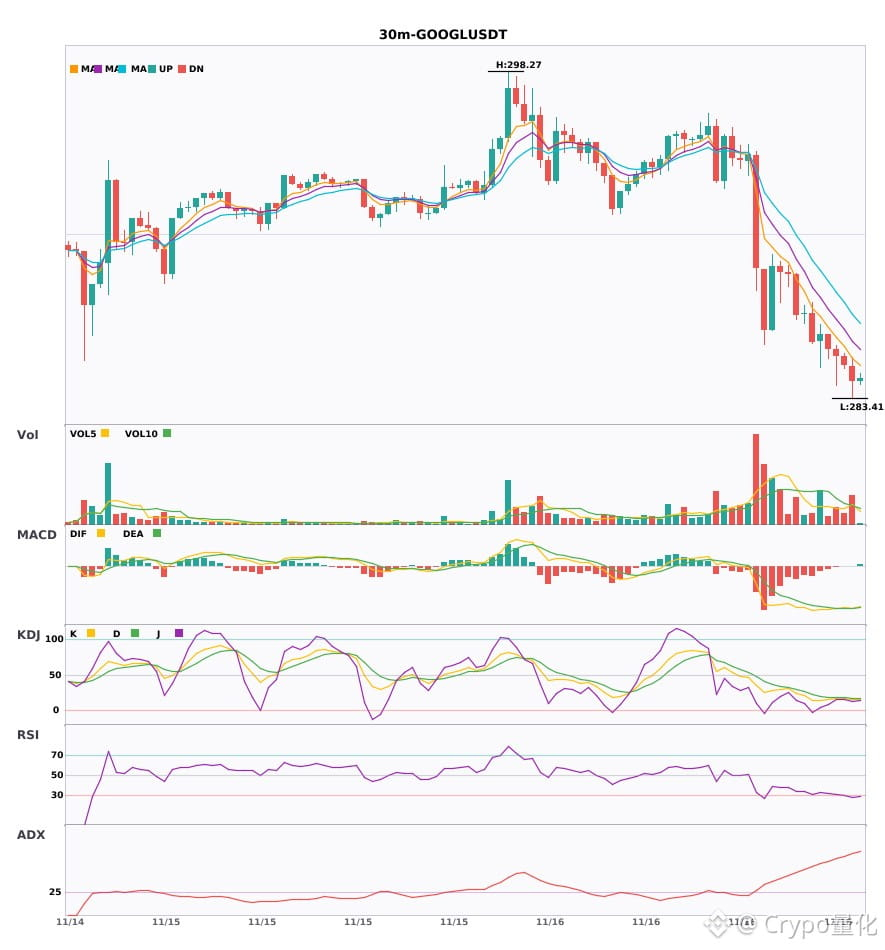
30-minute timeframe bearish alert: $ALAB / $GOOGL🔥
════════════════════
🟢 $ALAB 30-minute bearish signal
⚠️Technical: The trend is taking shape and can be followed | MACD bearish cross below zero, bearish momentum accelerating | Short-term trend turning bearish | K has crossed below D on KDJ, indicating bearish bias (49/57) | Volume doubled
════════════════════
🟢 $GOOGL 30-minute bearish signal
⚠️Technical: ADX has surged to 73, indicating an extremely strong trend, but beware of an overheated pullback. MACD has crossed bearishly below the zero line, and bearish momentum is accelerating. EMA5, 8, and 13 are bearishly aligned and pressing downward. KDJ is in the oversold zone, with K at 15.6 and D at 17.1; watch for a potential rebound. Volume is up 1.5x.
════════════════════
🔔 Follow for first-hand market updates 🔔
#技术分析 #ALAB #GOOGL
📌 When trading, pay attention to whether the candlestick pattern confirms the setup
30-minute timeframe bearish alert: $ALAB / $GOOGL 🔥
════════════════════
🟢 $ALAB 30-minute bearish signal
⚠️Technical: The trend is taking shape and can be followed | MACD bearish cross below zero, bearish momentum accelerating | Short-term trend turning bearish | K has crossed below D on KDJ, indicating bearish bias (49/57) | Volume doubled
════════════════════
🟢 $GOOGL 30-minute bearish signal
⚠️Technical: ADX has surged to 73, indicating an extremely strong trend, but beware of an overheated pullback. MACD has crossed bearishly below the zero line, and bearish momentum is accelerating. EMA5, 8, and 13 are bearishly aligned and pressing downward. KDJ is in the oversold zone, with K at 15.6 and D at 17.1; watch for a potential rebound. Volume is up 1.5x.
════════════════════
🔔 Follow for first-hand market updates 🔔
#技术分析 #ALAB #GOOGL
📌 When trading, pay attention to whether the candlestick pattern confirms the setup
════════════════════
🟢 $ALAB 30-minute bearish signal
⚠️Technical: The trend is taking shape and can be followed | MACD bearish cross below zero, bearish momentum accelerating | Short-term trend turning bearish | K has crossed below D on KDJ, indicating bearish bias (49/57) | Volume doubled
════════════════════
🟢 $GOOGL 30-minute bearish signal
⚠️Technical: ADX has surged to 73, indicating an extremely strong trend, but beware of an overheated pullback. MACD has crossed bearishly below the zero line, and bearish momentum is accelerating. EMA5, 8, and 13 are bearishly aligned and pressing downward. KDJ is in the oversold zone, with K at 15.6 and D at 17.1; watch for a potential rebound. Volume is up 1.5x.
════════════════════
🔔 Follow for first-hand market updates 🔔
#技术分析 #ALAB #GOOGL
📌 When trading, pay attention to whether the candlestick pattern confirms the setup
6
·
--
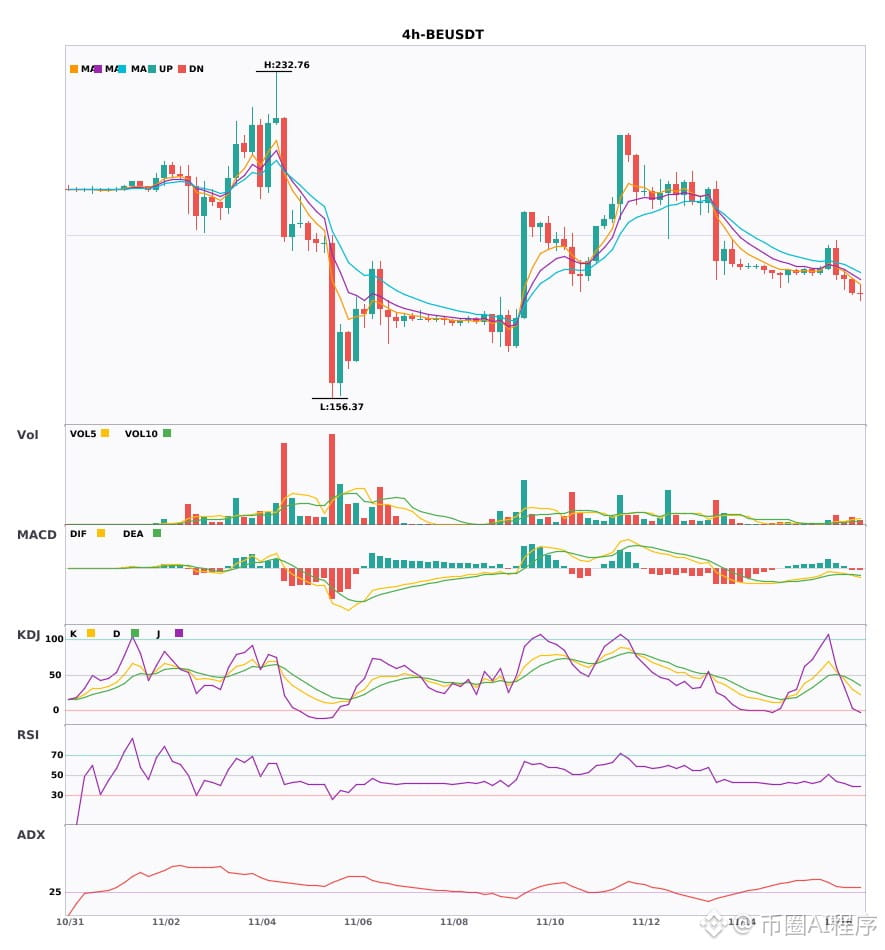
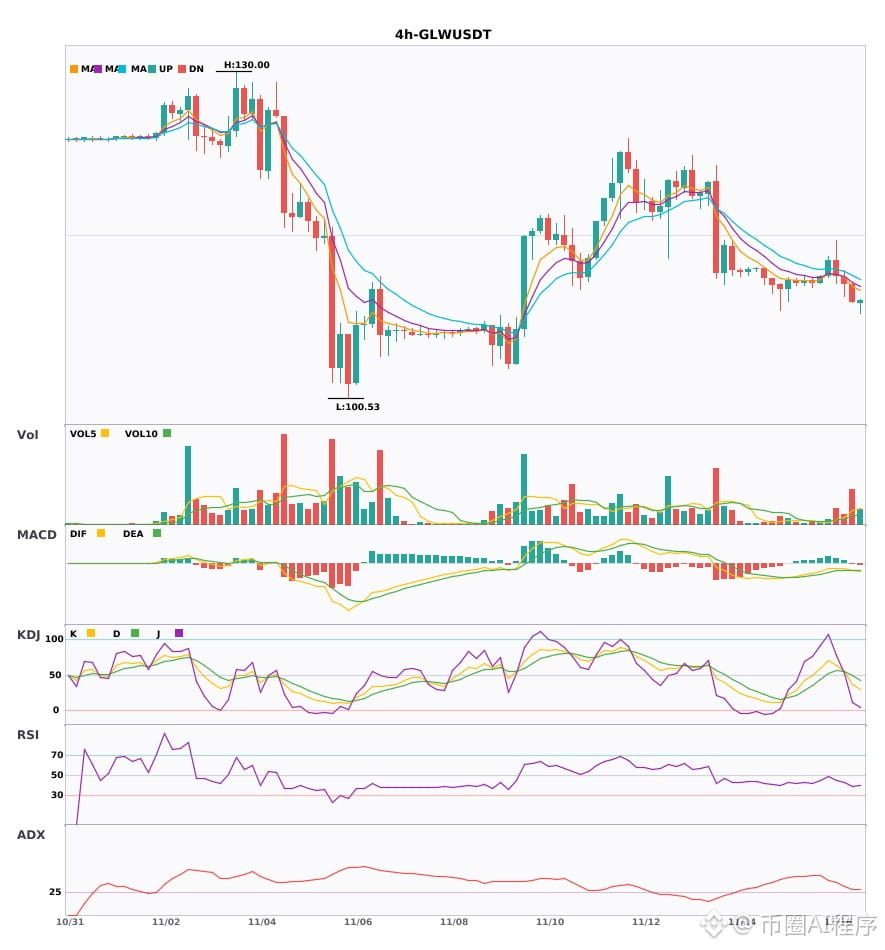
$BE/$GLW/$ALAB 4-hour short; daily bearish trend confirmed 🔥
════════════════════
🟢 $BE 4-hour bearish signal
⚠️Technical analysis: Daily bearish confluence confirmed | 4-hour entry: MACD dead cross with expanding green bars, bearish momentum accelerating | Bearish moving average alignment widening | KDJ: K crossed below D and is not yet oversold, bears have the upper hand | Trading volume up 2.2x
════════════════════
🟢 $GLW 4-hour bearish signal
⚠️Technical analysis: 4-hour entry + daily bearish confluence confirmed! MACD dead cross on rising volume, bearish moving average alignment widening, weak KDJ with K crossing below D, volume surging 3.9x
════════════════════
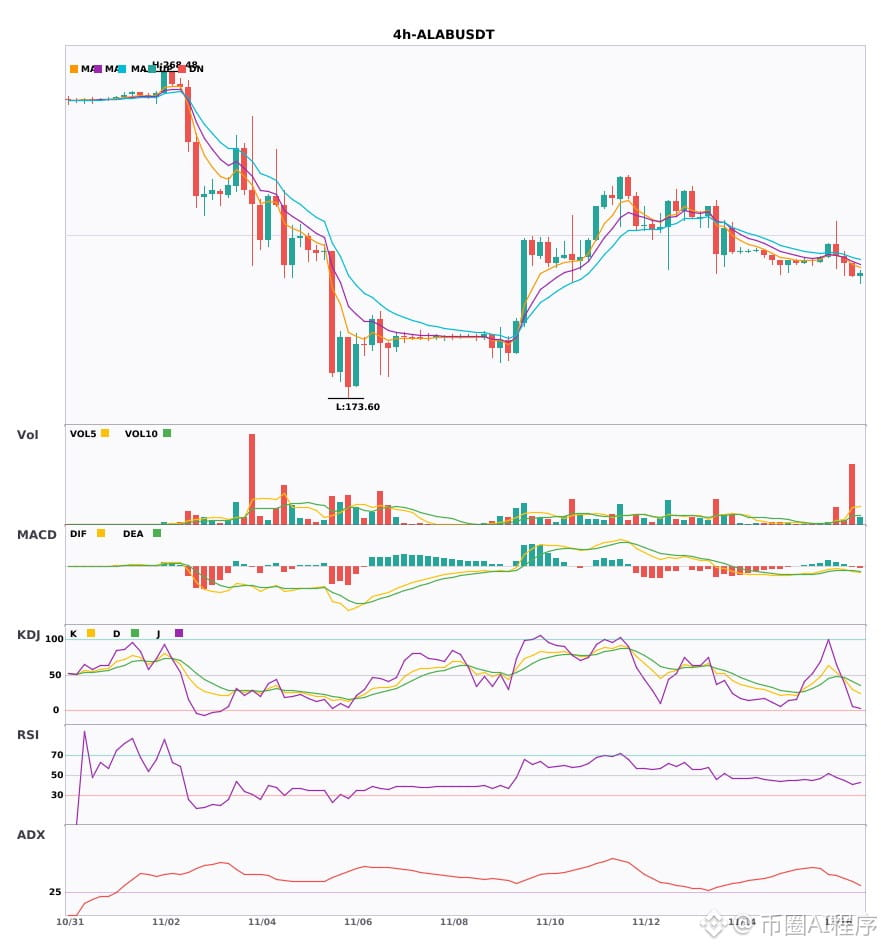
🟢 $ALAB 4-hour bearish signal
⚠️Technical analysis: 4-hour dead cross on rising volume accelerating the decline, bearish moving average alignment has just formed and is widening, KDJ K crossed below D and is in the weak zone (K29.1 D40.8), volume surged 6.4x; daily bearish confluence confirms the short.
════════════════════
🔔 Follow for first-hand market alerts 🔔
#多周期共振 #BE #GLW #ALAB
📌 When trading, pay attention to whether the candlestick pattern aligns
$BE /$GLW /$ALAB 4-hour short; daily bearish trend confirmed 🔥
════════════════════
🟢 $BE 4-hour bearish signal
⚠️Technical analysis: Daily bearish confluence confirmed | 4-hour entry: MACD dead cross with expanding green bars, bearish momentum accelerating | Bearish moving average alignment widening | KDJ: K crossed below D and is not yet oversold, bears have the upper hand | Trading volume up 2.2x
════════════════════
🟢 $GLW 4-hour bearish signal
⚠️Technical analysis: 4-hour entry + daily bearish confluence confirmed! MACD dead cross on rising volume, bearish moving average alignment widening, weak KDJ with K crossing below D, volume surging 3.9x
════════════════════
🟢 $ALAB 4-hour bearish signal
⚠️Technical analysis: 4-hour dead cross on rising volume accelerating the decline, bearish moving average alignment has just formed and is widening, KDJ K crossed below D and is in the weak zone (K29.1 D40.8), volume surged 6.4x; daily bearish confluence confirms the short.
════════════════════
🔔 Follow for first-hand market alerts 🔔
#多周期共振 #BE #GLW #ALAB
📌 When trading, pay attention to whether the candlestick pattern aligns
════════════════════
🟢 $BE 4-hour bearish signal
⚠️Technical analysis: Daily bearish confluence confirmed | 4-hour entry: MACD dead cross with expanding green bars, bearish momentum accelerating | Bearish moving average alignment widening | KDJ: K crossed below D and is not yet oversold, bears have the upper hand | Trading volume up 2.2x
════════════════════
🟢 $GLW 4-hour bearish signal
⚠️Technical analysis: 4-hour entry + daily bearish confluence confirmed! MACD dead cross on rising volume, bearish moving average alignment widening, weak KDJ with K crossing below D, volume surging 3.9x
════════════════════
🟢 $ALAB 4-hour bearish signal
⚠️Technical analysis: 4-hour dead cross on rising volume accelerating the decline, bearish moving average alignment has just formed and is widening, KDJ K crossed below D and is in the weak zone (K29.1 D40.8), volume surged 6.4x; daily bearish confluence confirms the short.
════════════════════
🔔 Follow for first-hand market alerts 🔔
#多周期共振 #BE #GLW #ALAB
📌 When trading, pay attention to whether the candlestick pattern aligns
7
·
--
$TSM/$TQQQ/$ALAB 4-hour MACD bearish crossover, beware of risk 🔥
════════════════════
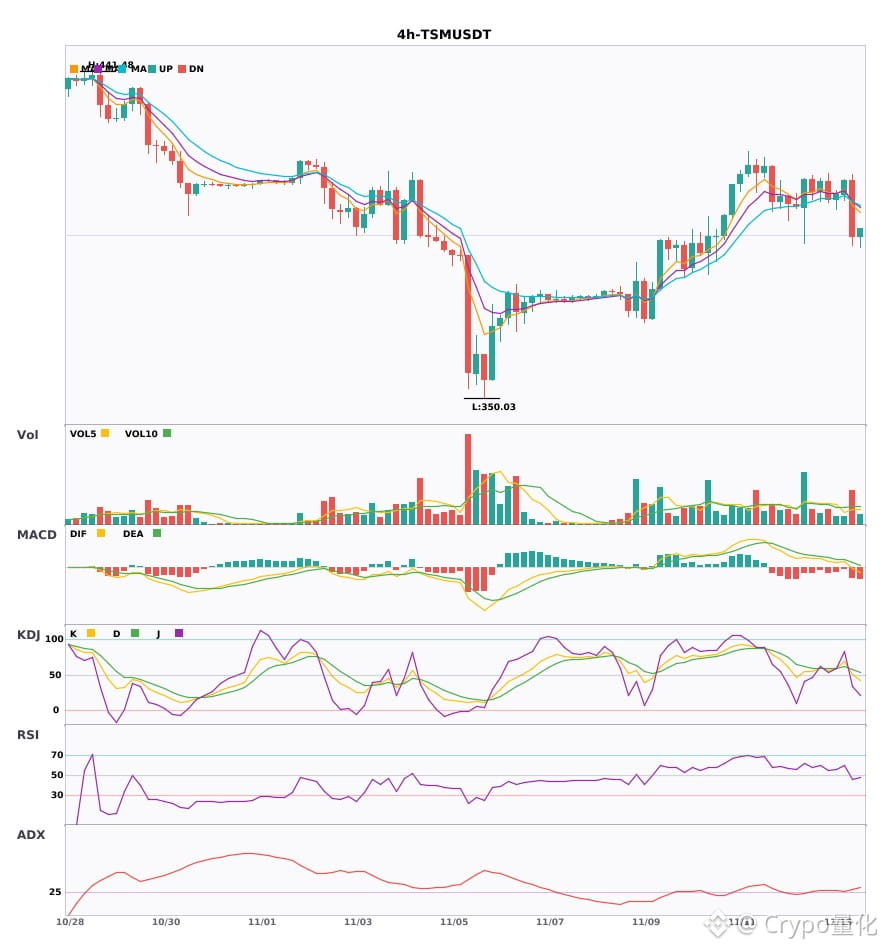
🟢 $TSM 4-hour bearish signal
⚠️Technical analysis: ADX 32, indicating a clear trend. The MACD DIF has fallen below the zero line, turning bearish. EMA5 has crossed below EMA8, showing short-term weakness. KDJ's K has crossed below D but is not yet oversold, suggesting a short-term bearish bias. Volume is up 1.8x.
════════════════════
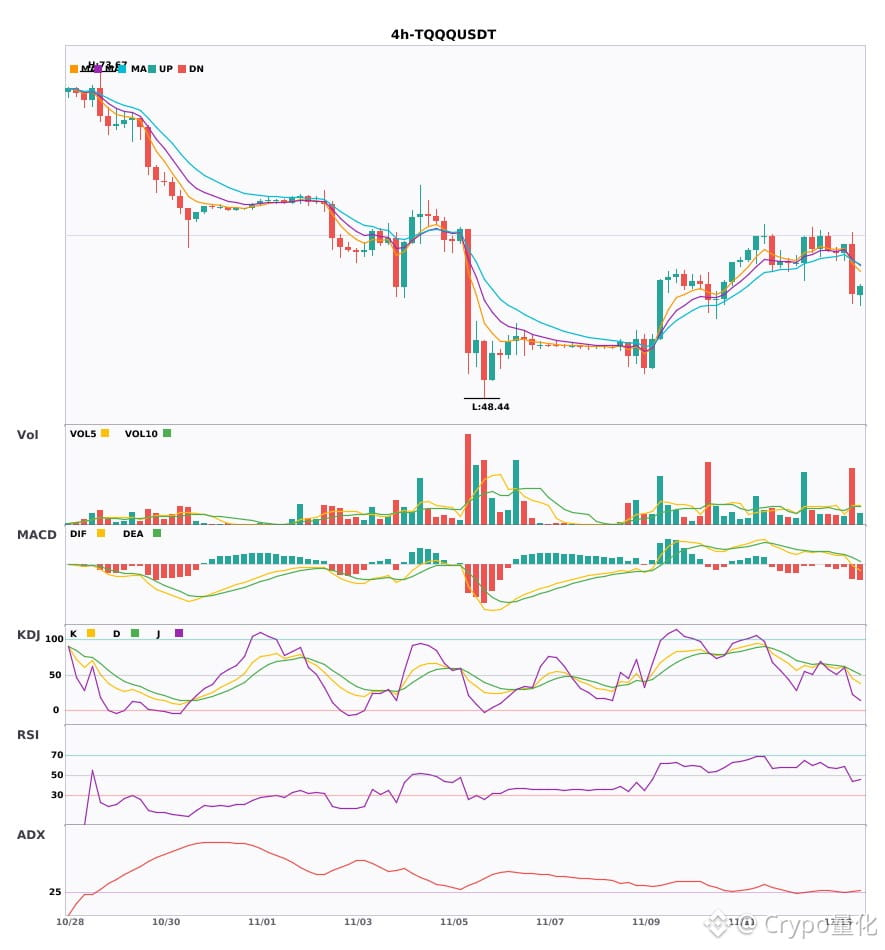
🟢 $TQQQ 4-hour bearish signal
⚠️Technical analysis: ADX has risen to 27, with a trend just beginning to emerge, so a trade is possible. However, the MACD DIF has fallen below the zero line, turning bearish. The 5-day moving average has crossed below the 8-day moving average, indicating a bearish outlook. Trading volume has suddenly surged 3x.
════════════════════
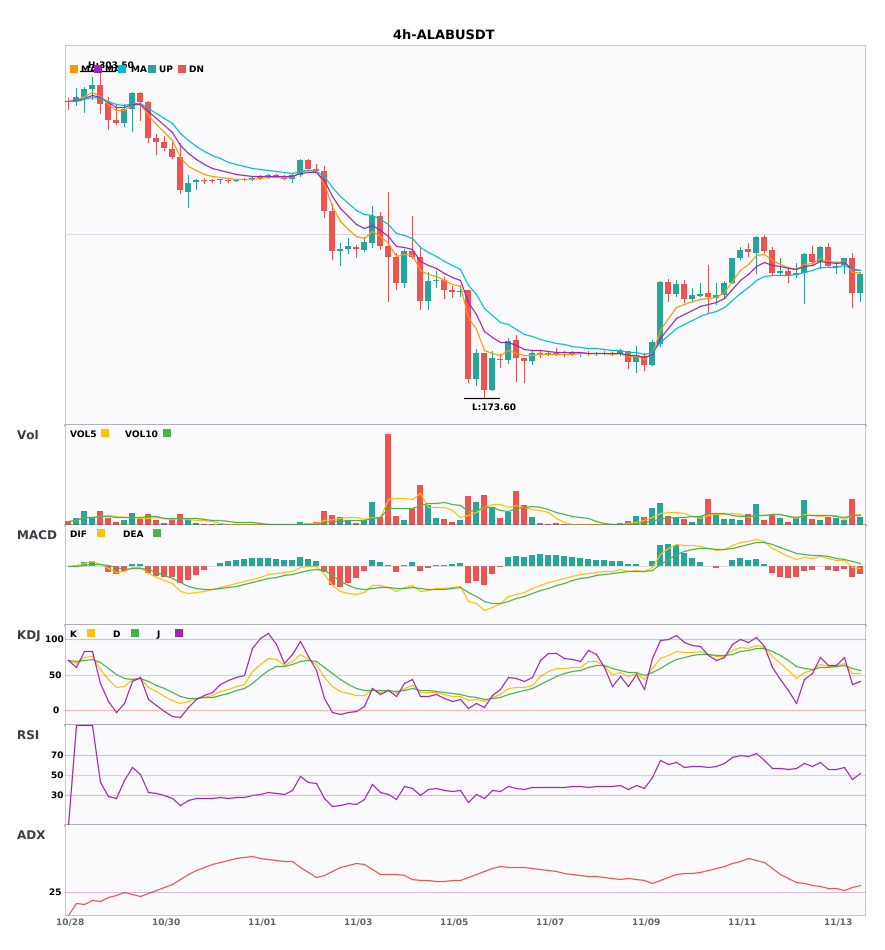
🟢 $ALAB 4-hour bearish signal
⚠️Technical analysis: ADX 32, indicating a clear trend. The MACD has fallen below the zero line, turning bearish. Short-term moving averages have formed a bearish crossover and are pointing down. KDJ has formed a bearish crossover and is not yet in oversold territory. Volume is up 2.7x.
════════════════════
🔔 Follow for real-time market movements 🔔
#技术分析 #TSM #TQQQ #ALAB
📌 When trading, check whether the candlestick pattern confirms the signal.
$TSM /$TQQQ /$ALAB 4-hour MACD bearish crossover, beware of risk 🔥
════════════════════
🟢 $TSM 4-hour bearish signal
⚠️Technical analysis: ADX 32, indicating a clear trend. The MACD DIF has fallen below the zero line, turning bearish. EMA5 has crossed below EMA8, showing short-term weakness. KDJ's K has crossed below D but is not yet oversold, suggesting a short-term bearish bias. Volume is up 1.8x.
════════════════════
🟢 $TQQQ 4-hour bearish signal
⚠️Technical analysis: ADX has risen to 27, with a trend just beginning to emerge, so a trade is possible. However, the MACD DIF has fallen below the zero line, turning bearish. The 5-day moving average has crossed below the 8-day moving average, indicating a bearish outlook. Trading volume has suddenly surged 3x.
════════════════════
🟢 $ALAB 4-hour bearish signal
⚠️Technical analysis: ADX 32, indicating a clear trend. The MACD has fallen below the zero line, turning bearish. Short-term moving averages have formed a bearish crossover and are pointing down. KDJ has formed a bearish crossover and is not yet in oversold territory. Volume is up 2.7x.
════════════════════
🔔 Follow for real-time market movements 🔔
#技术分析 #TSM #TQQQ #ALAB
📌 When trading, check whether the candlestick pattern confirms the signal.
════════════════════
🟢 $TSM 4-hour bearish signal
⚠️Technical analysis: ADX 32, indicating a clear trend. The MACD DIF has fallen below the zero line, turning bearish. EMA5 has crossed below EMA8, showing short-term weakness. KDJ's K has crossed below D but is not yet oversold, suggesting a short-term bearish bias. Volume is up 1.8x.
════════════════════
🟢 $TQQQ 4-hour bearish signal
⚠️Technical analysis: ADX has risen to 27, with a trend just beginning to emerge, so a trade is possible. However, the MACD DIF has fallen below the zero line, turning bearish. The 5-day moving average has crossed below the 8-day moving average, indicating a bearish outlook. Trading volume has suddenly surged 3x.
════════════════════
🟢 $ALAB 4-hour bearish signal
⚠️Technical analysis: ADX 32, indicating a clear trend. The MACD has fallen below the zero line, turning bearish. Short-term moving averages have formed a bearish crossover and are pointing down. KDJ has formed a bearish crossover and is not yet in oversold territory. Volume is up 2.7x.
════════════════════
🔔 Follow for real-time market movements 🔔
#技术分析 #TSM #TQQQ #ALAB
📌 When trading, check whether the candlestick pattern confirms the signal.
10
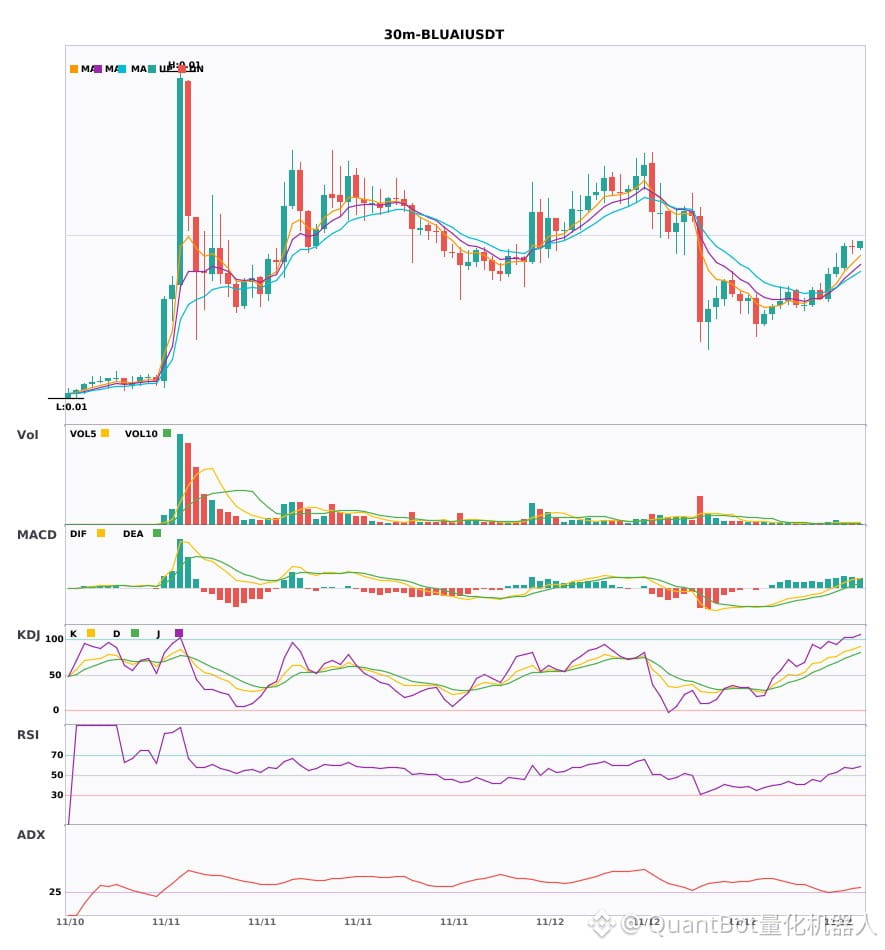
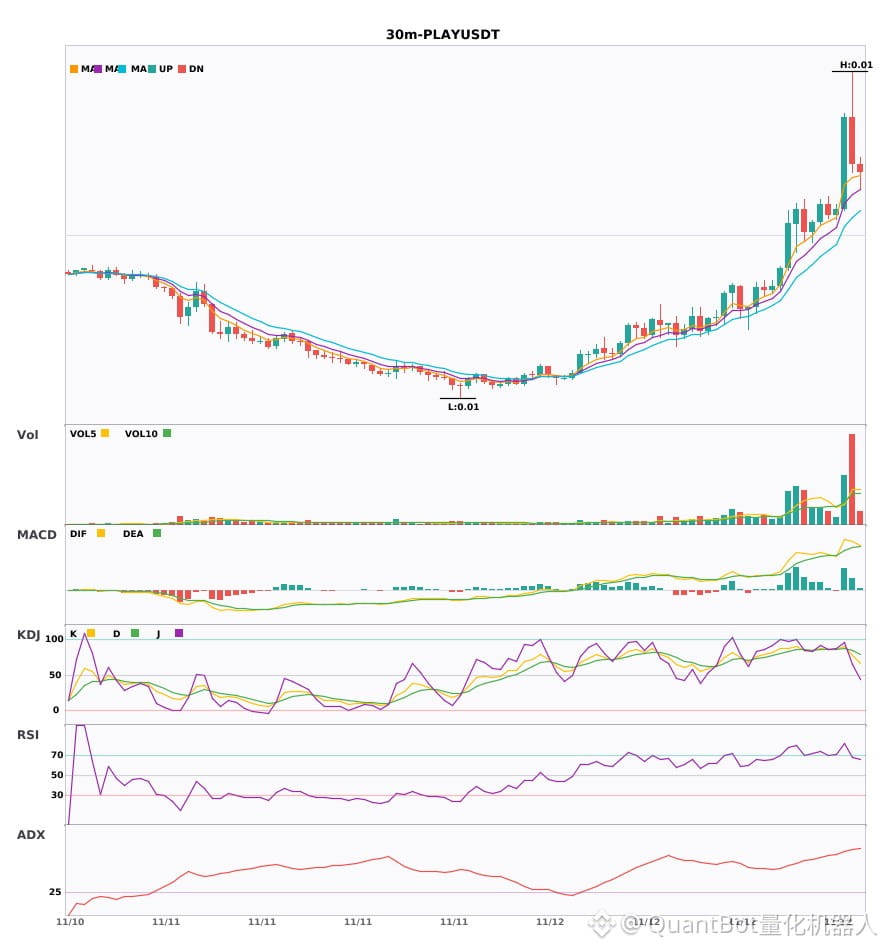
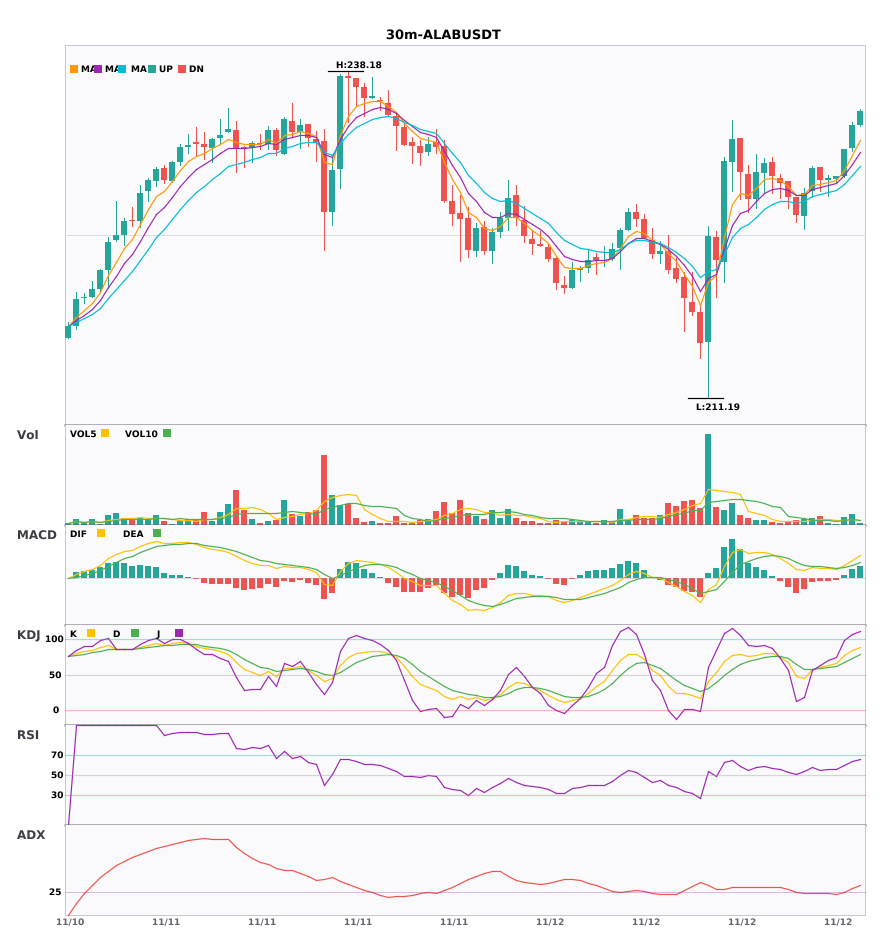
$BLUAI / $PLAY / $ALAB 30-minute confluence turns bullish, with bullish signals appearing simultaneously
📈 $BLUAI | 30-minute bullish signal
━━━━━━━━━━━━━━━━━━
Technical analysis: ADX (29): Trend is forming; potential entry | MACD is bullish, with a strengthening trend and increasing momentum | EMA5 > EMA8 > EMA13: bullish alignment | KDJ is strong, with bulls in control (K: 82.5, D: 72.6) | Volume increased (2.5x)
Price change: 1.4200%
📈 $PLAY | 30-minute bullish signal
━━━━━━━━━━━━━━━━━━
Technical analysis: ADX (73): Very strong trend (beware of an overheated pullback) | MACD golden cross above zero, releasing bullish momentum | EMA5 > EMA8 > EMA13: bullish alignment | KDJ in overbought territory; watch for pullback risk (K: 89.9, D: 87.1) | Volume increased (2.2x)
Price change: 15.9100%
📈 $ALAB | 30-minute bullish signal
━━━━━━━━━━━━━━━━━━
Technical analysis: ADX (26): Trend is forming; potential entry | MACD golden cross above zero, releasing bullish momentum | EMA5 > EMA8 > EMA13: bullish alignment | KDJ is strong, with bulls in control (K: 77.7, D: 67.3) | Volume increased (1.8x)
Price change: 0.9900%
━━━━━━━━━━━━━━━━━━
#技术分析 #BLUAI #PLAY #ALAB
📌 The above is for reference only and does not constitute investment advice
$BLUAI / $PLAY / $ALAB 30-minute confluence turns bullish, with bullish signals appearing simultaneously
📈 $BLUAI | 30-minute bullish signal
━━━━━━━━━━━━━━━━━━
Technical analysis: ADX (29): Trend is forming; potential entry | MACD is bullish, with a strengthening trend and increasing momentum | EMA5 > EMA8 > EMA13: bullish alignment | KDJ is strong, with bulls in control (K: 82.5, D: 72.6) | Volume increased (2.5x)
Price change: 1.4200%
📈 $PLAY | 30-minute bullish signal
━━━━━━━━━━━━━━━━━━
Technical analysis: ADX (73): Very strong trend (beware of an overheated pullback) | MACD golden cross above zero, releasing bullish momentum | EMA5 > EMA8 > EMA13: bullish alignment | KDJ in overbought territory; watch for pullback risk (K: 89.9, D: 87.1) | Volume increased (2.2x)
Price change: 15.9100%
📈 $ALAB | 30-minute bullish signal
━━━━━━━━━━━━━━━━━━
Technical analysis: ADX (26): Trend is forming; potential entry | MACD golden cross above zero, releasing bullish momentum | EMA5 > EMA8 > EMA13: bullish alignment | KDJ is strong, with bulls in control (K: 77.7, D: 67.3) | Volume increased (1.8x)
Price change: 0.9900%
━━━━━━━━━━━━━━━━━━
#技术分析 #BLUAI #PLAY #ALAB
📌 The above is for reference only and does not constitute investment advice
📈 $BLUAI | 30-minute bullish signal
━━━━━━━━━━━━━━━━━━
Technical analysis: ADX (29): Trend is forming; potential entry | MACD is bullish, with a strengthening trend and increasing momentum | EMA5 > EMA8 > EMA13: bullish alignment | KDJ is strong, with bulls in control (K: 82.5, D: 72.6) | Volume increased (2.5x)
Price change: 1.4200%
📈 $PLAY | 30-minute bullish signal
━━━━━━━━━━━━━━━━━━
Technical analysis: ADX (73): Very strong trend (beware of an overheated pullback) | MACD golden cross above zero, releasing bullish momentum | EMA5 > EMA8 > EMA13: bullish alignment | KDJ in overbought territory; watch for pullback risk (K: 89.9, D: 87.1) | Volume increased (2.2x)
Price change: 15.9100%
📈 $ALAB | 30-minute bullish signal
━━━━━━━━━━━━━━━━━━
Technical analysis: ADX (26): Trend is forming; potential entry | MACD golden cross above zero, releasing bullish momentum | EMA5 > EMA8 > EMA13: bullish alignment | KDJ is strong, with bulls in control (K: 77.7, D: 67.3) | Volume increased (1.8x)
Price change: 0.9900%
━━━━━━━━━━━━━━━━━━
#技术分析 #BLUAI #PLAY #ALAB
📌 The above is for reference only and does not constitute investment advice
80

·
--
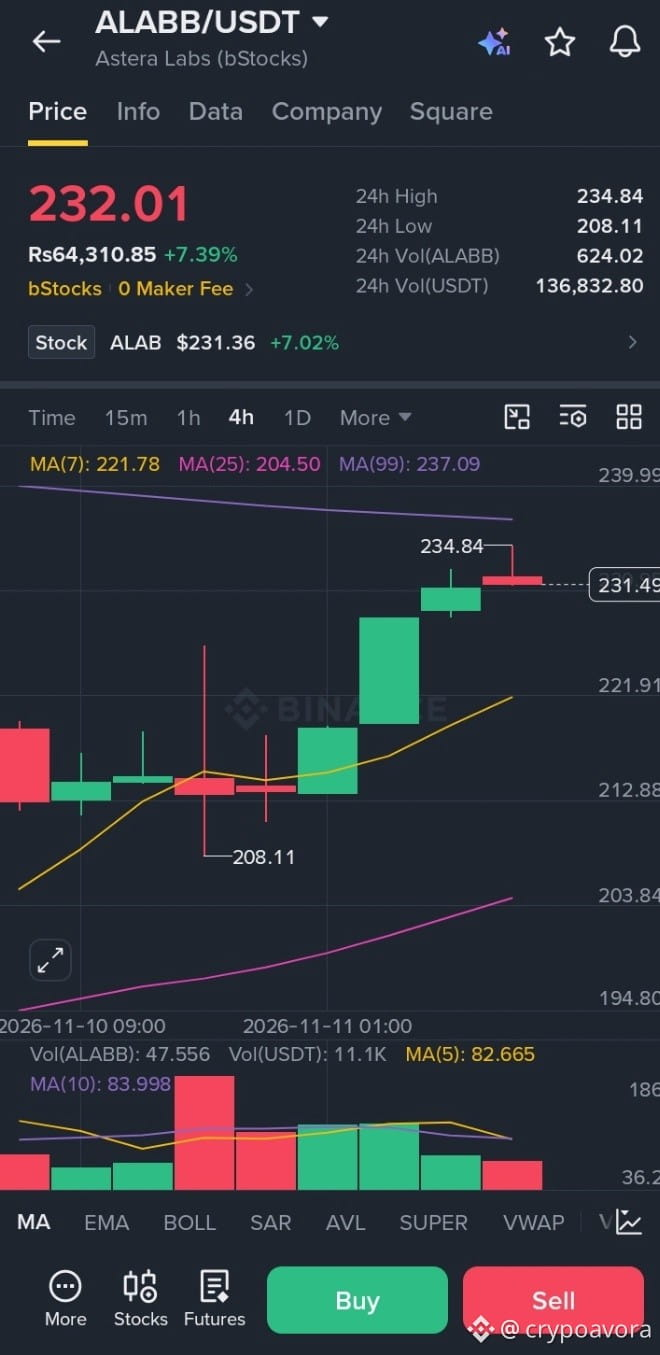
$ALABB 🚀 $ALAB — A Breakout Setup Worth Watching! 👀
Is chart getting ready for its next big move?
$ALABB is showing a potential Cup & Handle breakout after building a strong base since August. Price has returned to the cup's rim and formed a tight handle. Buyers are now testing a key breakout level.
🔥 Why I'm watching $AAPLB LAB: • Q2 revenue: $392.4M (+104% YoY) • Adjusted EPS beat estimates by 15.9% • Scorpio X AI fabric switches entered volume production ahead of schedule. • PCIe 6.0 now contributes over 50% of revenue. • Q3 revenue guidance: $540M–$560M.
📊 Key Technical Levels:
🟢 Breakout confirmation: Daily close above $377.87
🎯 TP1: $436.47 (+15.5%) 🎯 TP2: $465 (+23.1%) 🎯 TP3: $490 (+29.7%)
🔴 Invalidation: Daily close below $342.
💡 My Take: AI infrastructure demand is growing, and ALAB's fundamentals are attracting attention. But the breakout still needs confirmation.
👇 What do you think?
Is $ALAB heading toward $465, or will sellers reject this breakout?
#ALAB #Aİ #stockmarketnews
{spot}(ALABBUSDT)
#TechnicalAnalysis #AIInfrastructure
$ALABB 🚀 $ALAB — A Breakout Setup Worth Watching! 👀
Is chart getting ready for its next big move?
$ALABB is showing a potential Cup & Handle breakout after building a strong base since August. Price has returned to the cup's rim and formed a tight handle. Buyers are now testing a key breakout level.
🔥 Why I'm watching $AAPLB LAB: • Q2 revenue: $392.4M (+104% YoY) • Adjusted EPS beat estimates by 15.9% • Scorpio X AI fabric switches entered volume production ahead of schedule. • PCIe 6.0 now contributes over 50% of revenue. • Q3 revenue guidance: $540M–$560M.
📊 Key Technical Levels:
🟢 Breakout confirmation: Daily close above $377.87
🎯 TP1: $436.47 (+15.5%) 🎯 TP2: $465 (+23.1%) 🎯 TP3: $490 (+29.7%)
🔴 Invalidation: Daily close below $342.
💡 My Take: AI infrastructure demand is growing, and ALAB's fundamentals are attracting attention. But the breakout still needs confirmation.
👇 What do you think?
Is $ALAB heading toward $465, or will sellers reject this breakout?
#ALAB #Aİ #stockmarketnews
#TechnicalAnalysis #AIInfrastructure
Is chart getting ready for its next big move?
$ALABB is showing a potential Cup & Handle breakout after building a strong base since August. Price has returned to the cup's rim and formed a tight handle. Buyers are now testing a key breakout level.
🔥 Why I'm watching $AAPLB LAB: • Q2 revenue: $392.4M (+104% YoY) • Adjusted EPS beat estimates by 15.9% • Scorpio X AI fabric switches entered volume production ahead of schedule. • PCIe 6.0 now contributes over 50% of revenue. • Q3 revenue guidance: $540M–$560M.
📊 Key Technical Levels:
🟢 Breakout confirmation: Daily close above $377.87
🎯 TP1: $436.47 (+15.5%) 🎯 TP2: $465 (+23.1%) 🎯 TP3: $490 (+29.7%)
🔴 Invalidation: Daily close below $342.
💡 My Take: AI infrastructure demand is growing, and ALAB's fundamentals are attracting attention. But the breakout still needs confirmation.
👇 What do you think?
Is $ALAB heading toward $465, or will sellers reject this breakout?
#ALAB #Aİ #stockmarketnews
#TechnicalAnalysis #AIInfrastructure
34
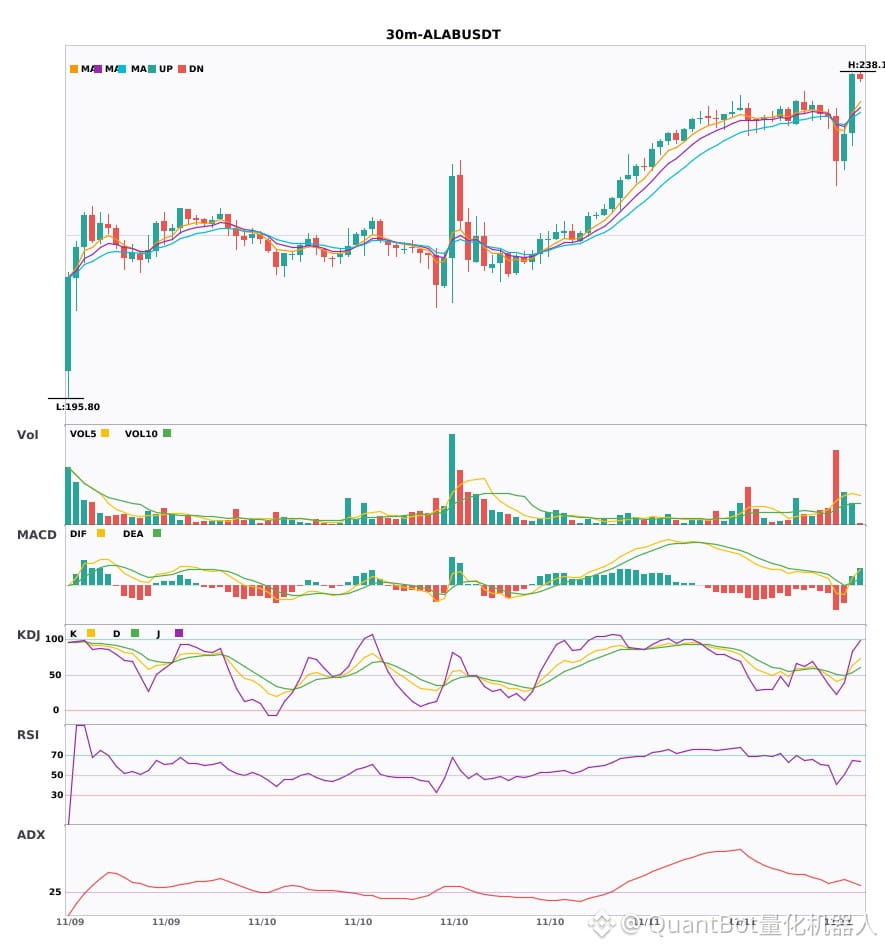
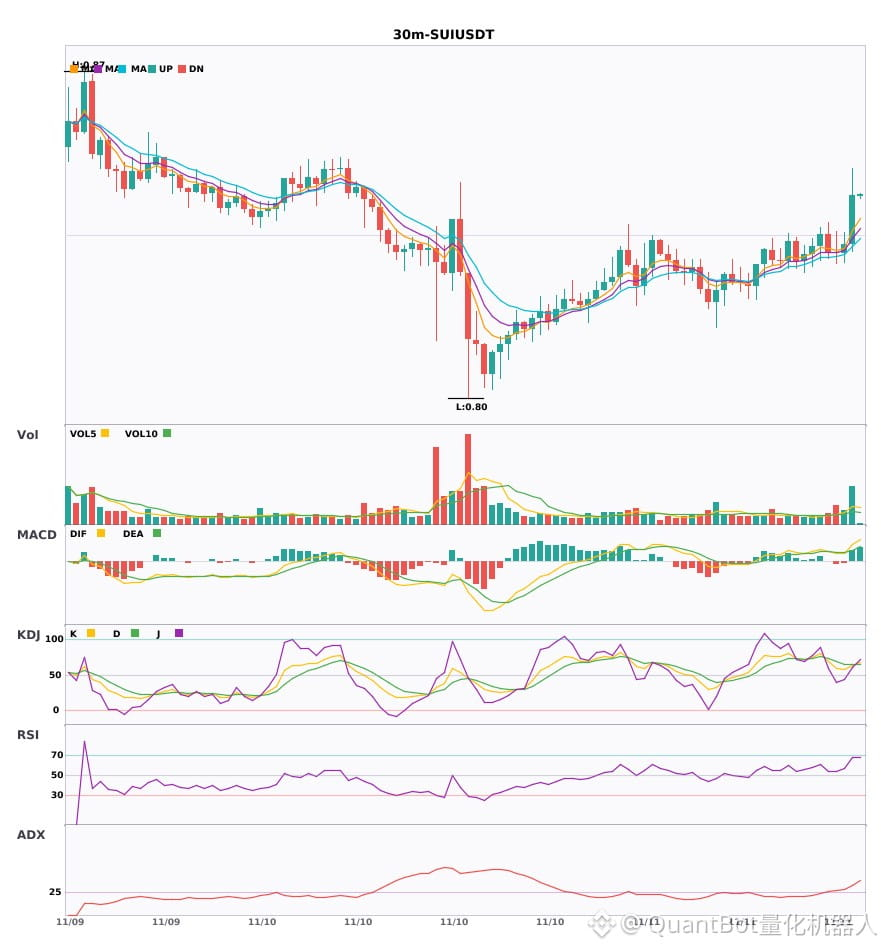
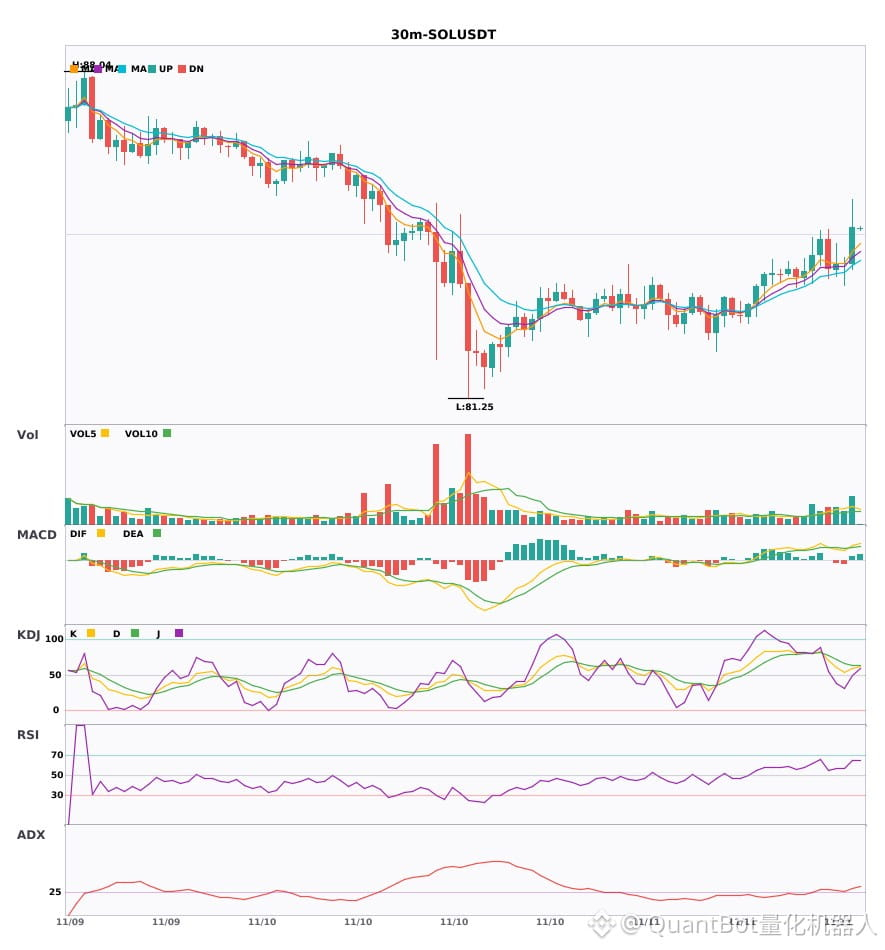
Three 30-minute bullish signals appearing simultaneously: $ALAB / $SUI / $SOL
📈 $ALAB | 30-minute bullish signal
━━━━━━━━━━━━━━━━━━
Technical analysis: ADX(35) indicates a clear trending market | MACD golden cross above zero, bullish momentum released | EMA5 crosses above EMA8, turning bullish in the short term | KDJ golden cross, bullish short-term outlook (K is 63.5, D is 53.7) | Volume expands (1.7x)
Price change: 3.3600%
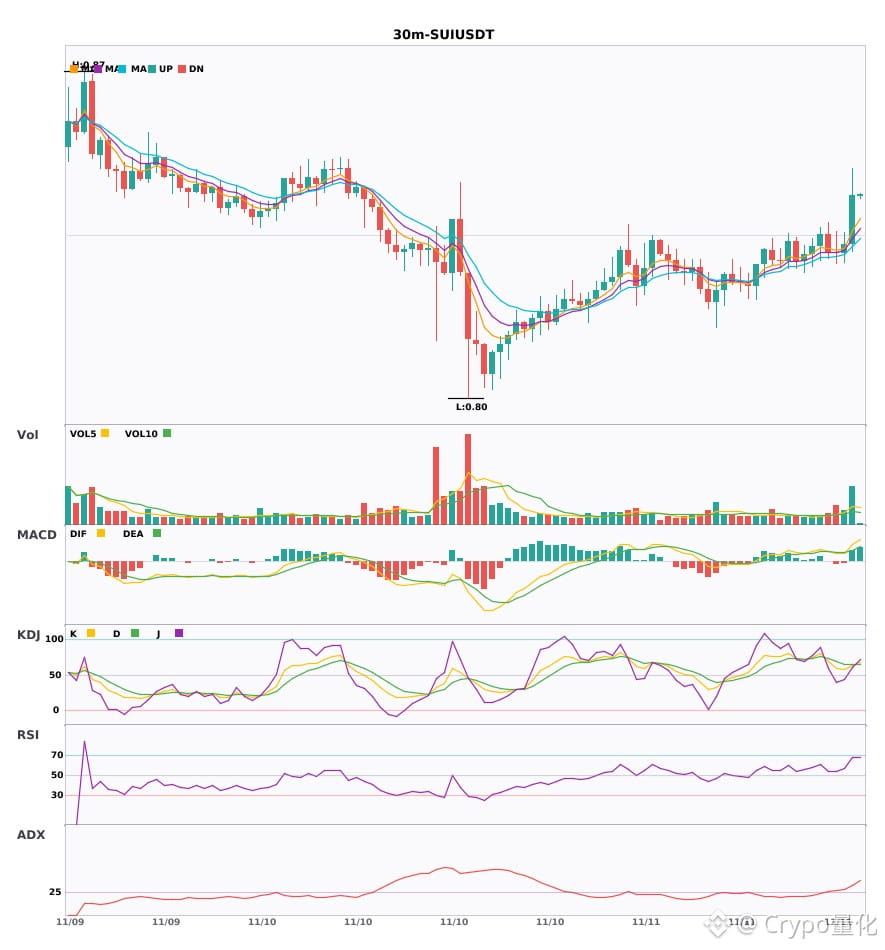
📈 $SUI | 30-minute bullish signal
━━━━━━━━━━━━━━━━━━
Technical analysis: ADX(38) indicates a clear trending market | MACD golden cross above zero, bullish momentum released | EMA5 above EMA8 above EMA13, bullish alignment | KDJ showing strength, bulls in control (K is 63.3, D is 64.3) | Volume surges (2.9x)
Price change: 1.2200%
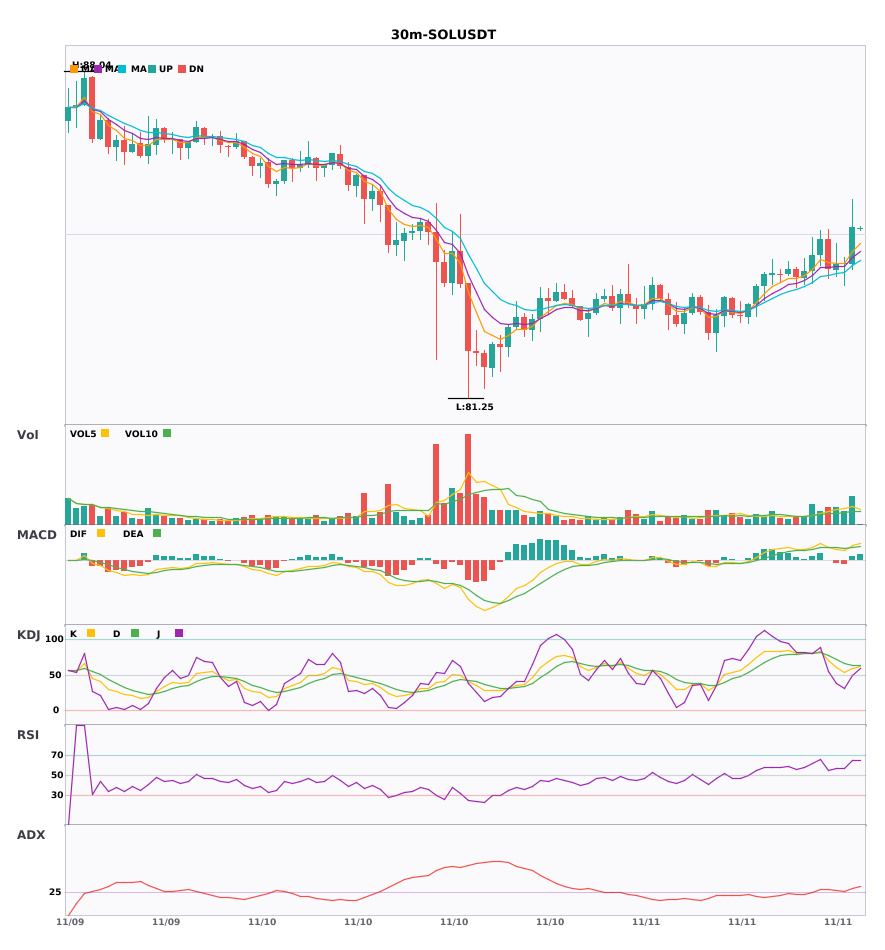
📈 $SOL | 30-minute bullish signal
━━━━━━━━━━━━━━━━━━
Technical analysis: ADX(32) indicates a clear trending market | MACD golden cross above zero, bullish momentum released | EMA5 above EMA8 above EMA13, bullish alignment | KDJ showing strength, bulls in control (K is 58.8, D is 63.4) | Volume expands (2.0x)
Price change: 0.8900%
━━━━━━━━━━━━━━━━━━
#技术分析 #ALAB #SUI #SOL
📌 The above content is for reference only and does not constitute investment advice
Three 30-minute bullish signals appearing simultaneously: $ALAB / $SUI / $SOL
📈 $ALAB | 30-minute bullish signal
━━━━━━━━━━━━━━━━━━
Technical analysis: ADX(35) indicates a clear trending market | MACD golden cross above zero, bullish momentum released | EMA5 crosses above EMA8, turning bullish in the short term | KDJ golden cross, bullish short-term outlook (K is 63.5, D is 53.7) | Volume expands (1.7x)
Price change: 3.3600%
📈 $SUI | 30-minute bullish signal
━━━━━━━━━━━━━━━━━━
Technical analysis: ADX(38) indicates a clear trending market | MACD golden cross above zero, bullish momentum released | EMA5 above EMA8 above EMA13, bullish alignment | KDJ showing strength, bulls in control (K is 63.3, D is 64.3) | Volume surges (2.9x)
Price change: 1.2200%
📈 $SOL | 30-minute bullish signal
━━━━━━━━━━━━━━━━━━
Technical analysis: ADX(32) indicates a clear trending market | MACD golden cross above zero, bullish momentum released | EMA5 above EMA8 above EMA13, bullish alignment | KDJ showing strength, bulls in control (K is 58.8, D is 63.4) | Volume expands (2.0x)
Price change: 0.8900%
━━━━━━━━━━━━━━━━━━
#技术分析 #ALAB #SUI #SOL
📌 The above content is for reference only and does not constitute investment advice
📈 $ALAB | 30-minute bullish signal
━━━━━━━━━━━━━━━━━━
Technical analysis: ADX(35) indicates a clear trending market | MACD golden cross above zero, bullish momentum released | EMA5 crosses above EMA8, turning bullish in the short term | KDJ golden cross, bullish short-term outlook (K is 63.5, D is 53.7) | Volume expands (1.7x)
Price change: 3.3600%
📈 $SUI | 30-minute bullish signal
━━━━━━━━━━━━━━━━━━
Technical analysis: ADX(38) indicates a clear trending market | MACD golden cross above zero, bullish momentum released | EMA5 above EMA8 above EMA13, bullish alignment | KDJ showing strength, bulls in control (K is 63.3, D is 64.3) | Volume surges (2.9x)
Price change: 1.2200%
📈 $SOL | 30-minute bullish signal
━━━━━━━━━━━━━━━━━━
Technical analysis: ADX(32) indicates a clear trending market | MACD golden cross above zero, bullish momentum released | EMA5 above EMA8 above EMA13, bullish alignment | KDJ showing strength, bulls in control (K is 58.8, D is 63.4) | Volume expands (2.0x)
Price change: 0.8900%
━━━━━━━━━━━━━━━━━━
#技术分析 #ALAB #SUI #SOL
📌 The above content is for reference only and does not constitute investment advice
11
·
--
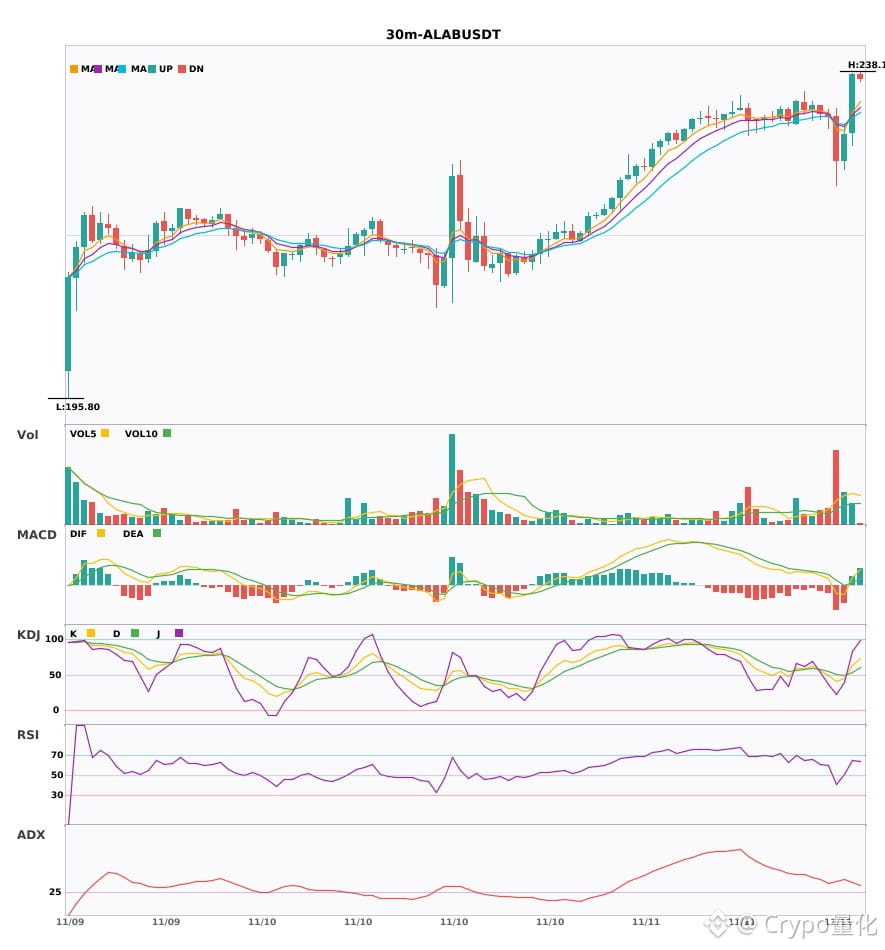
$ALAB / $SUI / $SOL multiple signals turn bullish on the 30-minute timeframe 🔥
════════════════════
🔴 $ALAB 30-minute bullish signal
⚠️Technical analysis: ADX(35) indicates a clear trend | MACD bullish crossover above zero, bullish momentum emerging | EMA5 crosses above EMA8, short-term outlook turns bullish | KDJ bullish crossover, short-term outlook is bullish (K: 63.5, D: 53.7) | Volume increases (1.7x)
════════════════════
🔴 $SUI 30-minute bullish signal
⚠️Technical analysis: ADX(38) indicates a clear trend | MACD bullish crossover above zero, bullish momentum emerging | EMA5 > EMA8 > EMA13, bullish alignment | KDJ showing strength, bulls have the upper hand (K: 63.3, D: 64.3) | Volume surges (2.9x)
════════════════════
🔴 $SOL 30-minute bullish signal
⚠️Technical analysis: ADX(32) indicates a clear trend | MACD bullish crossover above zero, bullish momentum emerging | EMA5 > EMA8 > EMA13, bullish alignment | KDJ showing strength, bulls have the upper hand (K: 58.8, D: 63.4) | Volume increases (2.0x)
════════════════════
🔔 Follow for real-time market updates 🔔
#技术分析 #ALAB #SUI #SOL
📌 When trading, pay attention to whether the candlestick pattern confirms the signal
$ALAB / $SUI / $SOL multiple signals turn bullish on the 30-minute timeframe 🔥
════════════════════
🔴 $ALAB 30-minute bullish signal
⚠️Technical analysis: ADX(35) indicates a clear trend | MACD bullish crossover above zero, bullish momentum emerging | EMA5 crosses above EMA8, short-term outlook turns bullish | KDJ bullish crossover, short-term outlook is bullish (K: 63.5, D: 53.7) | Volume increases (1.7x)
════════════════════
🔴 $SUI 30-minute bullish signal
⚠️Technical analysis: ADX(38) indicates a clear trend | MACD bullish crossover above zero, bullish momentum emerging | EMA5 > EMA8 > EMA13, bullish alignment | KDJ showing strength, bulls have the upper hand (K: 63.3, D: 64.3) | Volume surges (2.9x)
════════════════════
🔴 $SOL 30-minute bullish signal
⚠️Technical analysis: ADX(32) indicates a clear trend | MACD bullish crossover above zero, bullish momentum emerging | EMA5 > EMA8 > EMA13, bullish alignment | KDJ showing strength, bulls have the upper hand (K: 58.8, D: 63.4) | Volume increases (2.0x)
════════════════════
🔔 Follow for real-time market updates 🔔
#技术分析 #ALAB #SUI #SOL
📌 When trading, pay attention to whether the candlestick pattern confirms the signal
════════════════════
🔴 $ALAB 30-minute bullish signal
⚠️Technical analysis: ADX(35) indicates a clear trend | MACD bullish crossover above zero, bullish momentum emerging | EMA5 crosses above EMA8, short-term outlook turns bullish | KDJ bullish crossover, short-term outlook is bullish (K: 63.5, D: 53.7) | Volume increases (1.7x)
════════════════════
🔴 $SUI 30-minute bullish signal
⚠️Technical analysis: ADX(38) indicates a clear trend | MACD bullish crossover above zero, bullish momentum emerging | EMA5 > EMA8 > EMA13, bullish alignment | KDJ showing strength, bulls have the upper hand (K: 63.3, D: 64.3) | Volume surges (2.9x)
════════════════════
🔴 $SOL 30-minute bullish signal
⚠️Technical analysis: ADX(32) indicates a clear trend | MACD bullish crossover above zero, bullish momentum emerging | EMA5 > EMA8 > EMA13, bullish alignment | KDJ showing strength, bulls have the upper hand (K: 58.8, D: 63.4) | Volume increases (2.0x)
════════════════════
🔔 Follow for real-time market updates 🔔
#技术分析 #ALAB #SUI #SOL
📌 When trading, pay attention to whether the candlestick pattern confirms the signal
14
·
--
Two 30-minute bullish signals appeared simultaneously: $ALAB / $CYBER🔥
════════════════════
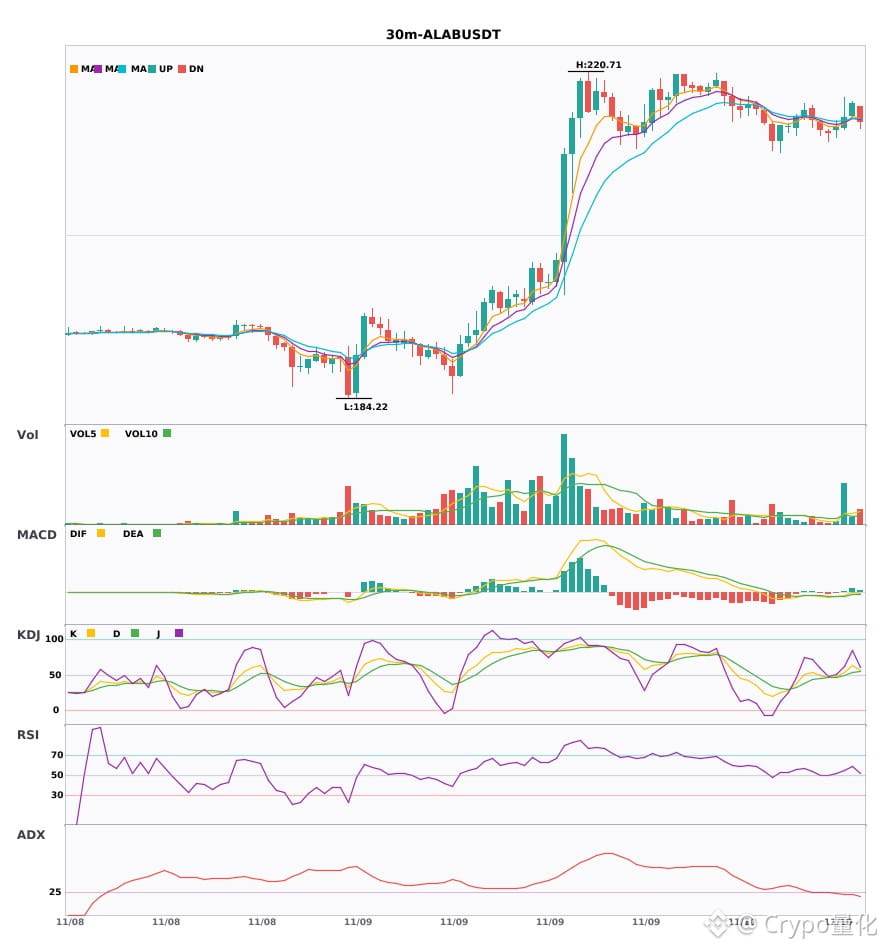
🔴 $ALAB 30-minute bullish signal
⚠️Technical analysis: ADX(25): Trend is forming; entry possible | MACD DIF broke above the zero line, turning bullish | EMA5 crossed above EMA8, turning bullish short-term | KDJ is running strong, with bulls in control (K: 63.8, D: 53.8) | Volume surge (4.1x)
════════════════════
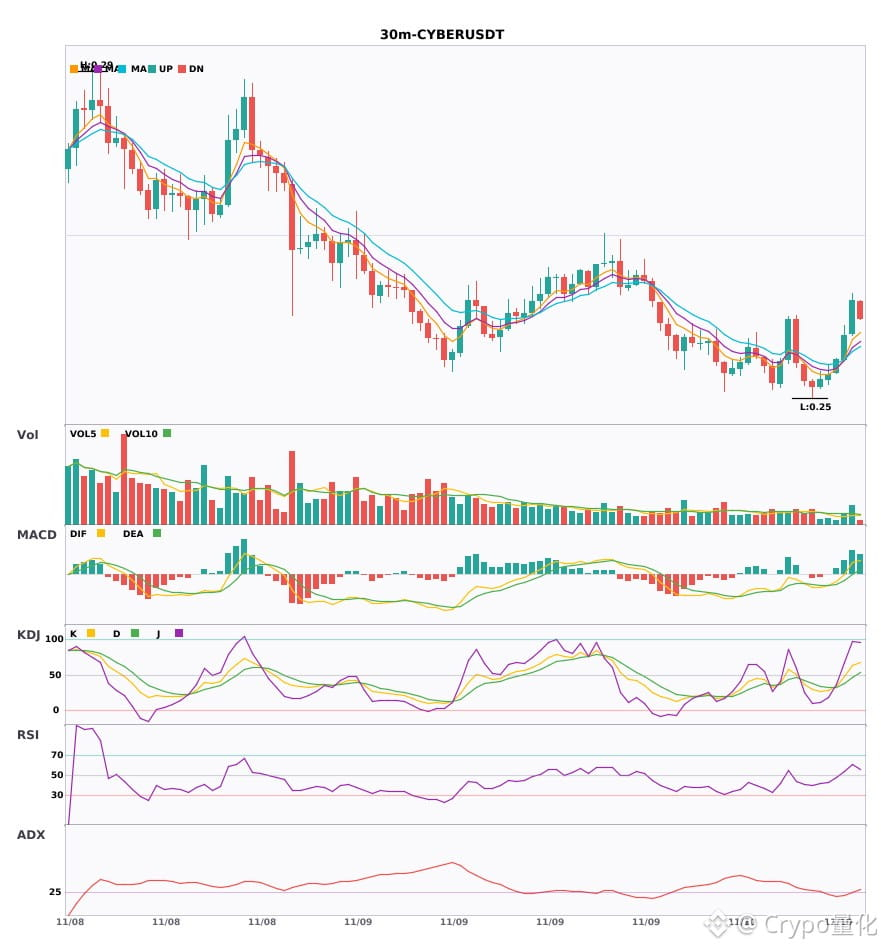
🔴 $CYBER 30-minute bullish signal
⚠️Technical analysis: ADX(26): Trend is forming; entry possible | MACD is bullish, with a strong trend and increasing momentum | EMA5 > EMA8 > EMA13, bullish alignment | Volume increased (1.7x)
════════════════════
🔔 Follow for first-hand market alerts 🔔
#技术分析 #ALAB #CYBER
📌 When trading, pay attention to whether the candlestick pattern confirms
Two 30-minute bullish signals appeared simultaneously: $ALAB / $CYBER 🔥
════════════════════
🔴 $ALAB 30-minute bullish signal
⚠️Technical analysis: ADX(25): Trend is forming; entry possible | MACD DIF broke above the zero line, turning bullish | EMA5 crossed above EMA8, turning bullish short-term | KDJ is running strong, with bulls in control (K: 63.8, D: 53.8) | Volume surge (4.1x)
════════════════════
🔴 $CYBER 30-minute bullish signal
⚠️Technical analysis: ADX(26): Trend is forming; entry possible | MACD is bullish, with a strong trend and increasing momentum | EMA5 > EMA8 > EMA13, bullish alignment | Volume increased (1.7x)
════════════════════
🔔 Follow for first-hand market alerts 🔔
#技术分析 #ALAB #CYBER
📌 When trading, pay attention to whether the candlestick pattern confirms
════════════════════
🔴 $ALAB 30-minute bullish signal
⚠️Technical analysis: ADX(25): Trend is forming; entry possible | MACD DIF broke above the zero line, turning bullish | EMA5 crossed above EMA8, turning bullish short-term | KDJ is running strong, with bulls in control (K: 63.8, D: 53.8) | Volume surge (4.1x)
════════════════════
🔴 $CYBER 30-minute bullish signal
⚠️Technical analysis: ADX(26): Trend is forming; entry possible | MACD is bullish, with a strong trend and increasing momentum | EMA5 > EMA8 > EMA13, bullish alignment | Volume increased (1.7x)
════════════════════
🔔 Follow for first-hand market alerts 🔔
#技术分析 #ALAB #CYBER
📌 When trading, pay attention to whether the candlestick pattern confirms
4
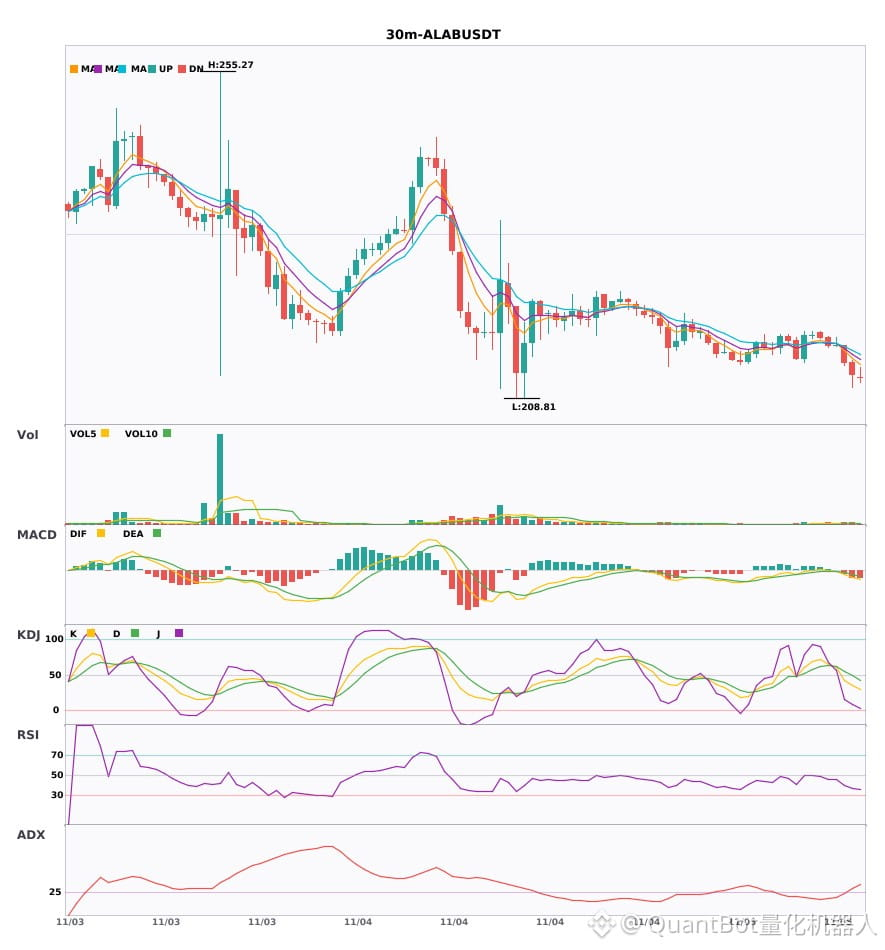
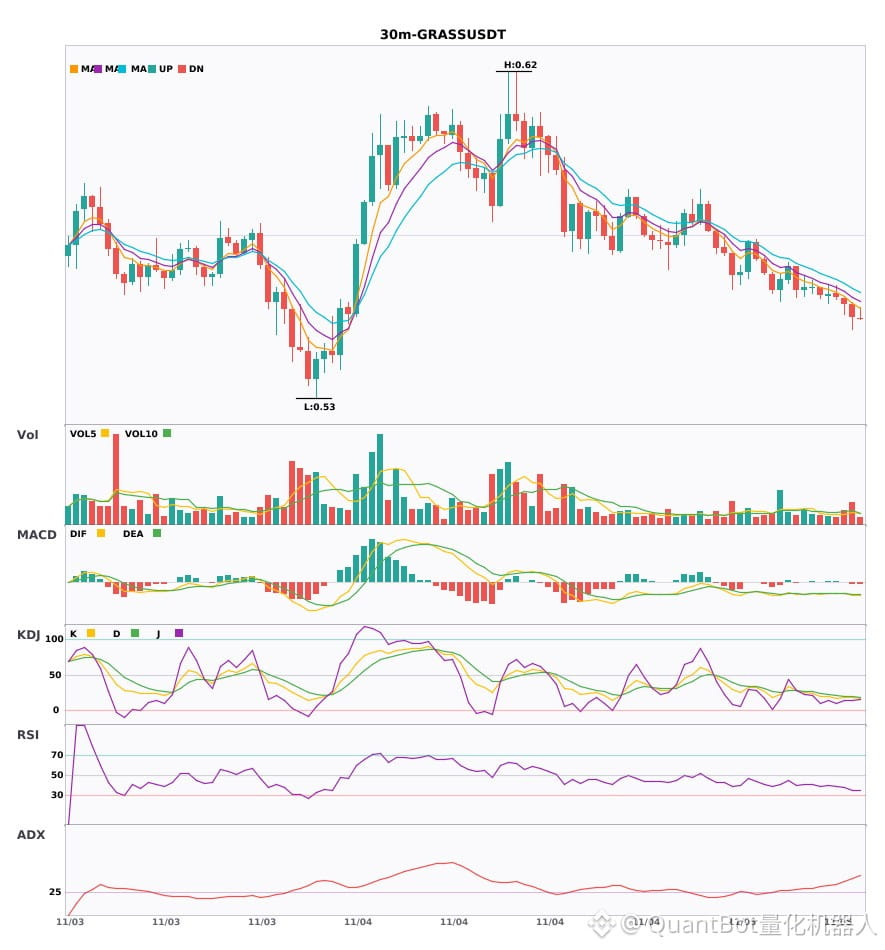
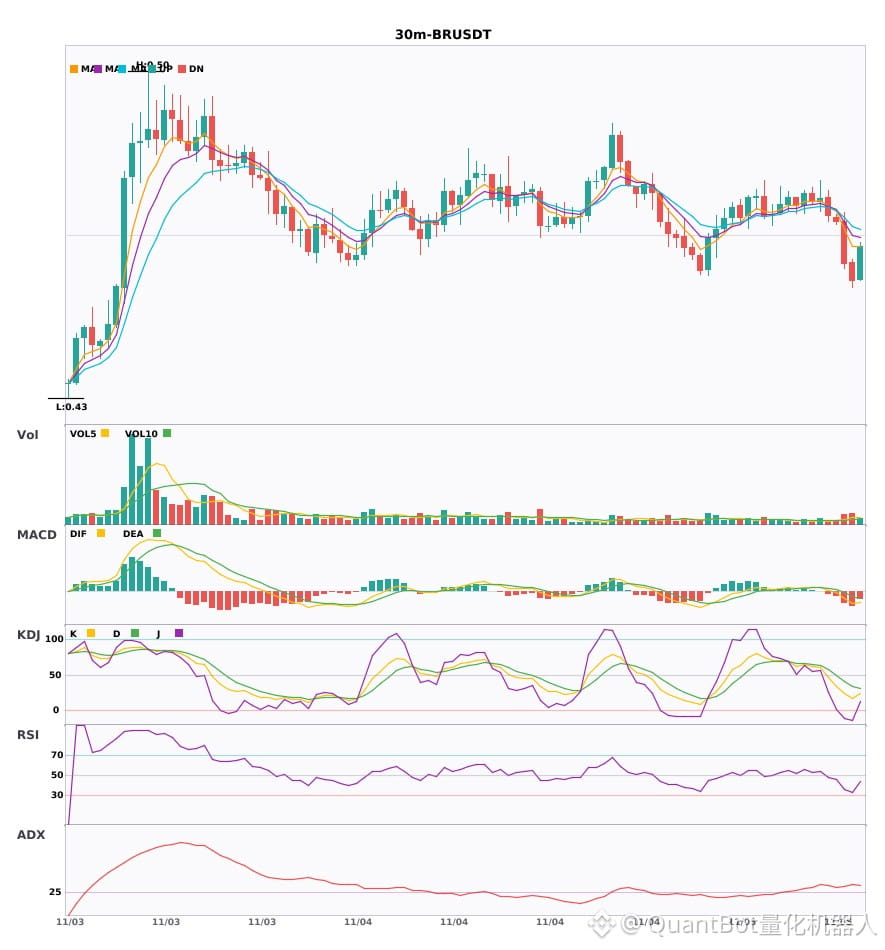
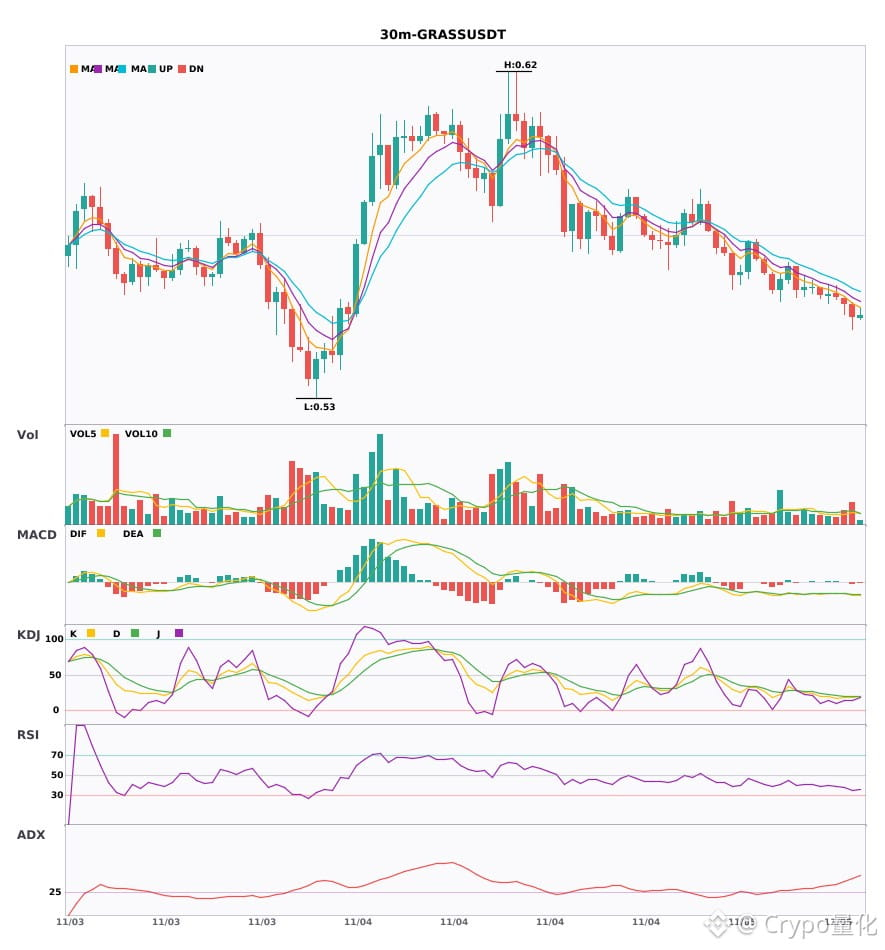
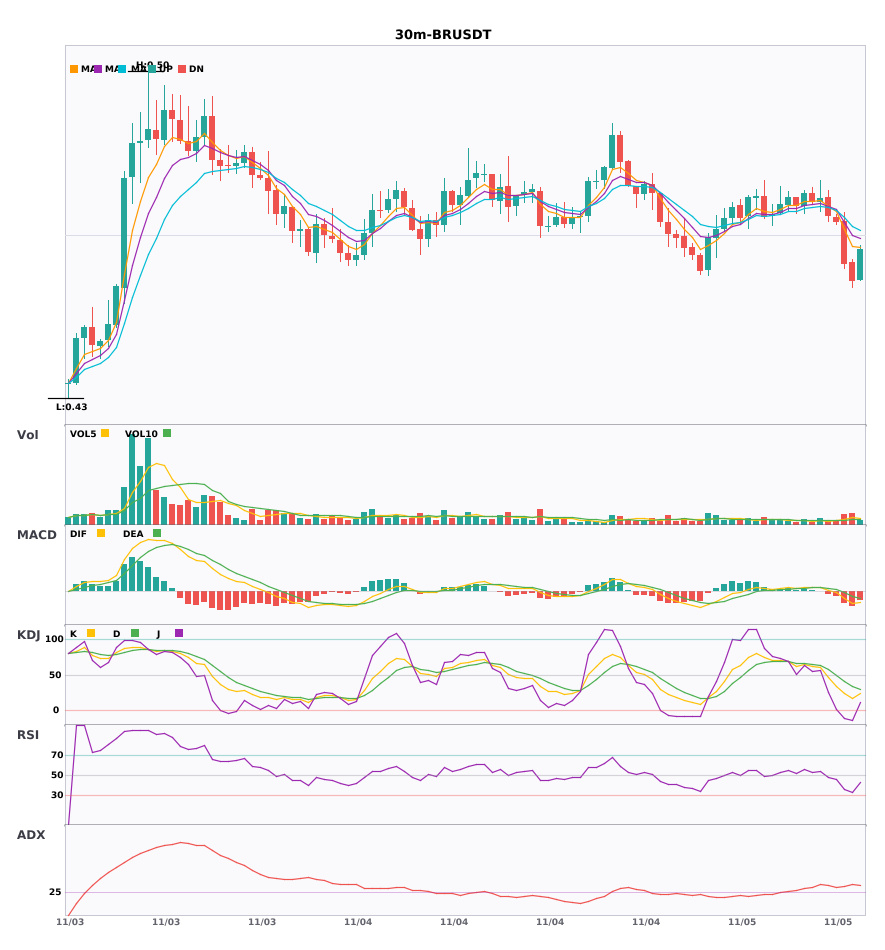
$ALAB / $GRASS / $BR 30-minute confluence signals a bearish reversal, with bearish signals appearing simultaneously
📉 $ALAB | 30-minute bearish signal
━━━━━━━━━━━━━━━━━━
Technical analysis: ADX(25) Trend is forming; participation is possible | MACD bearish crossover below zero, bearish momentum accelerating | EMA5 crosses below EMA8, short-term outlook turns bearish | Trading volume increases (2.2x)
Price change: -1.1300%
📉 $GRASS | 30-minute bearish signal
━━━━━━━━━━━━━━━━━━
Technical analysis: ADX(44) Clear trending market | MACD bearish crossover below zero, bearish momentum accelerating | EMA5 < EMA8 < EMA13, bearish alignment | KDJ in oversold territory; watch for a rebound opportunity (K: 17.8, D: 19.3) | Trading volume increases (1.5x)
Price change: -0.6100%
📉 $BR | 30-minute bearish signal
━━━━━━━━━━━━━━━━━━
Technical analysis: ADX(34) Clear trending market | MACD is bearish; trend is weak, momentum is strengthening | EMA5 < EMA8 < EMA13, bearish alignment | KDJ is weak, with bears in control (K: 23.9, D: 41.2) | Trading volume increases (2.4x)
Price change: -1.8100%
━━━━━━━━━━━━━━━━━━
#技术分析 #ALAB #GRASS #BR
📌 The above content is for reference only and does not constitute investment advice
$ALAB / $GRASS / $BR 30-minute confluence signals a bearish reversal, with bearish signals appearing simultaneously
📉 $ALAB | 30-minute bearish signal
━━━━━━━━━━━━━━━━━━
Technical analysis: ADX(25) Trend is forming; participation is possible | MACD bearish crossover below zero, bearish momentum accelerating | EMA5 crosses below EMA8, short-term outlook turns bearish | Trading volume increases (2.2x)
Price change: -1.1300%
📉 $GRASS | 30-minute bearish signal
━━━━━━━━━━━━━━━━━━
Technical analysis: ADX(44) Clear trending market | MACD bearish crossover below zero, bearish momentum accelerating | EMA5 < EMA8 < EMA13, bearish alignment | KDJ in oversold territory; watch for a rebound opportunity (K: 17.8, D: 19.3) | Trading volume increases (1.5x)
Price change: -0.6100%
📉 $BR | 30-minute bearish signal
━━━━━━━━━━━━━━━━━━
Technical analysis: ADX(34) Clear trending market | MACD is bearish; trend is weak, momentum is strengthening | EMA5 < EMA8 < EMA13, bearish alignment | KDJ is weak, with bears in control (K: 23.9, D: 41.2) | Trading volume increases (2.4x)
Price change: -1.8100%
━━━━━━━━━━━━━━━━━━
#技术分析 #ALAB #GRASS #BR
📌 The above content is for reference only and does not constitute investment advice
📉 $ALAB | 30-minute bearish signal
━━━━━━━━━━━━━━━━━━
Technical analysis: ADX(25) Trend is forming; participation is possible | MACD bearish crossover below zero, bearish momentum accelerating | EMA5 crosses below EMA8, short-term outlook turns bearish | Trading volume increases (2.2x)
Price change: -1.1300%
📉 $GRASS | 30-minute bearish signal
━━━━━━━━━━━━━━━━━━
Technical analysis: ADX(44) Clear trending market | MACD bearish crossover below zero, bearish momentum accelerating | EMA5 < EMA8 < EMA13, bearish alignment | KDJ in oversold territory; watch for a rebound opportunity (K: 17.8, D: 19.3) | Trading volume increases (1.5x)
Price change: -0.6100%
📉 $BR | 30-minute bearish signal
━━━━━━━━━━━━━━━━━━
Technical analysis: ADX(34) Clear trending market | MACD is bearish; trend is weak, momentum is strengthening | EMA5 < EMA8 < EMA13, bearish alignment | KDJ is weak, with bears in control (K: 23.9, D: 41.2) | Trading volume increases (2.4x)
Price change: -1.8100%
━━━━━━━━━━━━━━━━━━
#技术分析 #ALAB #GRASS #BR
📌 The above content is for reference only and does not constitute investment advice
15
·
--
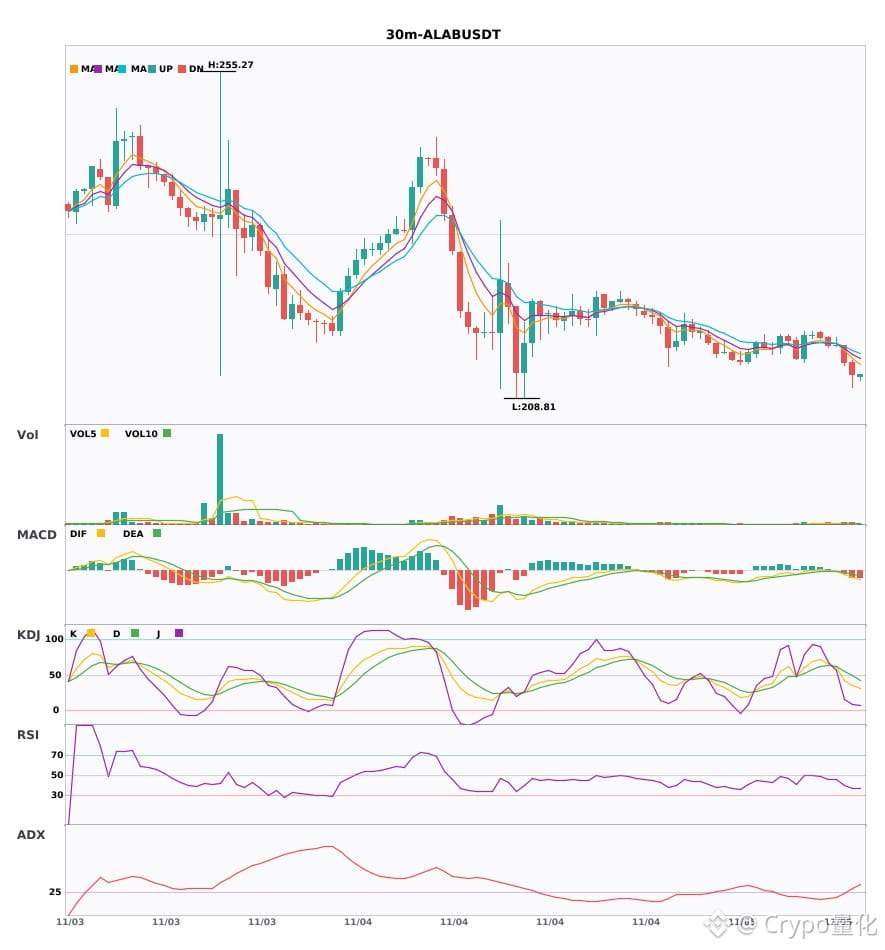
Three 30-minute bearish alerts: $ALAB / $GRASS / $BR🔥
════════════════════
🟢 $ALAB 30-minute bearish signal
⚠️Technical analysis: ADX(25): Trend is forming; consider participating | MACD bearish crossover below zero; bearish momentum accelerating | EMA5 crosses below EMA8; short-term outlook turns bearish | Volume increased (2.2x)
════════════════════
🟢 $GRASS 30-minute bearish signal
⚠️Technical analysis: ADX(44): Clear trending market | MACD bearish crossover below zero; bearish momentum accelerating | EMA5 < EMA8 < EMA13: bearish alignment | KDJ in oversold territory; watch for a potential rebound (K: 17.8, D: 19.3) | Volume increased (1.5x)
════════════════════
🟢 $BR 30-minute bearish signal
⚠️Technical analysis: ADX(34): Clear trending market | MACD is bearish; trend is weak and momentum is strengthening | EMA5 < EMA8 < EMA13: bearish alignment | KDJ remains weak, with bears in control (K: 23.9, D: 41.2) | Volume increased (2.4x)
════════════════════
🔔 Follow to get first-hand market updates 🔔
#技术分析 #ALAB #GRASS #BR
📌 When trading, pay attention to whether the candlestick patterns confirm the signal
Three 30-minute bearish alerts: $ALAB / $GRASS / $BR 🔥
════════════════════
🟢 $ALAB 30-minute bearish signal
⚠️Technical analysis: ADX(25): Trend is forming; consider participating | MACD bearish crossover below zero; bearish momentum accelerating | EMA5 crosses below EMA8; short-term outlook turns bearish | Volume increased (2.2x)
════════════════════
🟢 $GRASS 30-minute bearish signal
⚠️Technical analysis: ADX(44): Clear trending market | MACD bearish crossover below zero; bearish momentum accelerating | EMA5 < EMA8 < EMA13: bearish alignment | KDJ in oversold territory; watch for a potential rebound (K: 17.8, D: 19.3) | Volume increased (1.5x)
════════════════════
🟢 $BR 30-minute bearish signal
⚠️Technical analysis: ADX(34): Clear trending market | MACD is bearish; trend is weak and momentum is strengthening | EMA5 < EMA8 < EMA13: bearish alignment | KDJ remains weak, with bears in control (K: 23.9, D: 41.2) | Volume increased (2.4x)
════════════════════
🔔 Follow to get first-hand market updates 🔔
#技术分析 #ALAB #GRASS #BR
📌 When trading, pay attention to whether the candlestick patterns confirm the signal
════════════════════
🟢 $ALAB 30-minute bearish signal
⚠️Technical analysis: ADX(25): Trend is forming; consider participating | MACD bearish crossover below zero; bearish momentum accelerating | EMA5 crosses below EMA8; short-term outlook turns bearish | Volume increased (2.2x)
════════════════════
🟢 $GRASS 30-minute bearish signal
⚠️Technical analysis: ADX(44): Clear trending market | MACD bearish crossover below zero; bearish momentum accelerating | EMA5 < EMA8 < EMA13: bearish alignment | KDJ in oversold territory; watch for a potential rebound (K: 17.8, D: 19.3) | Volume increased (1.5x)
════════════════════
🟢 $BR 30-minute bearish signal
⚠️Technical analysis: ADX(34): Clear trending market | MACD is bearish; trend is weak and momentum is strengthening | EMA5 < EMA8 < EMA13: bearish alignment | KDJ remains weak, with bears in control (K: 23.9, D: 41.2) | Volume increased (2.4x)
════════════════════
🔔 Follow to get first-hand market updates 🔔
#技术分析 #ALAB #GRASS #BR
📌 When trading, pay attention to whether the candlestick patterns confirm the signal
2
·
--
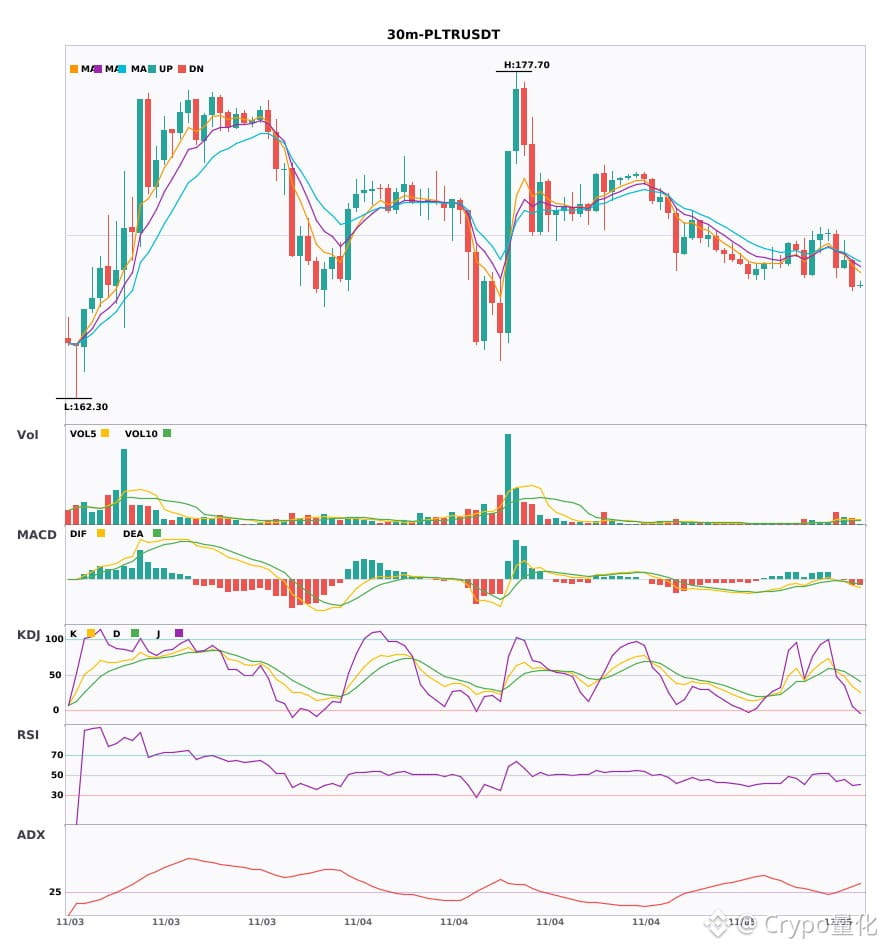
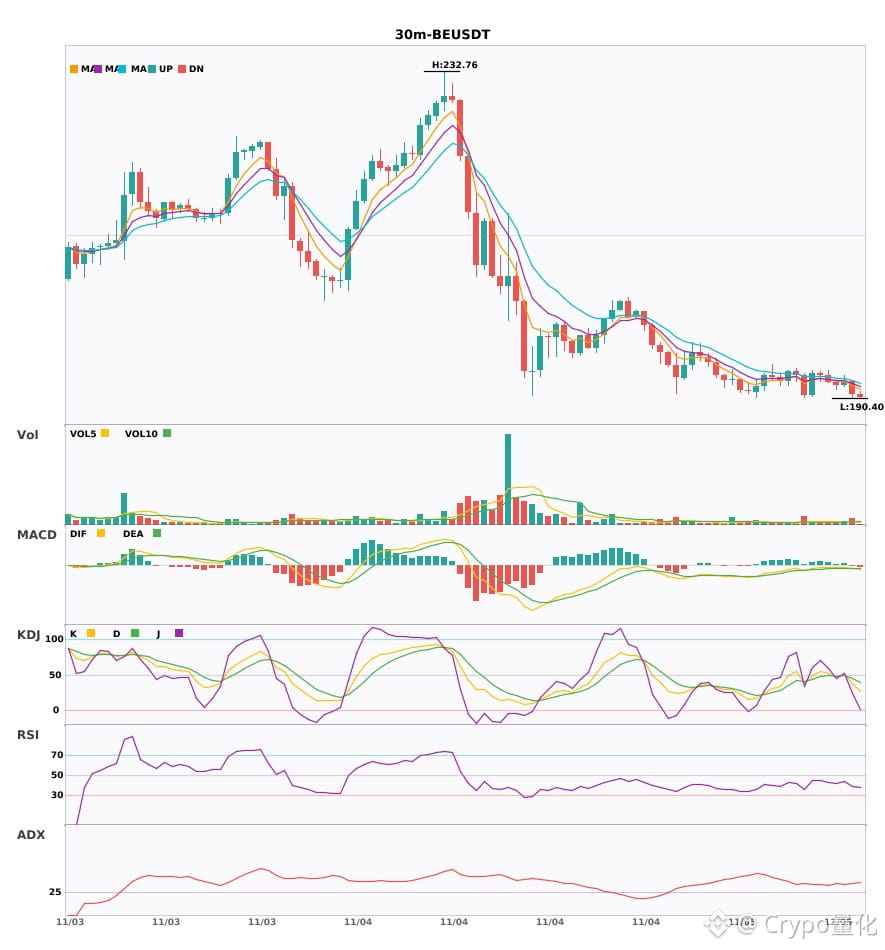
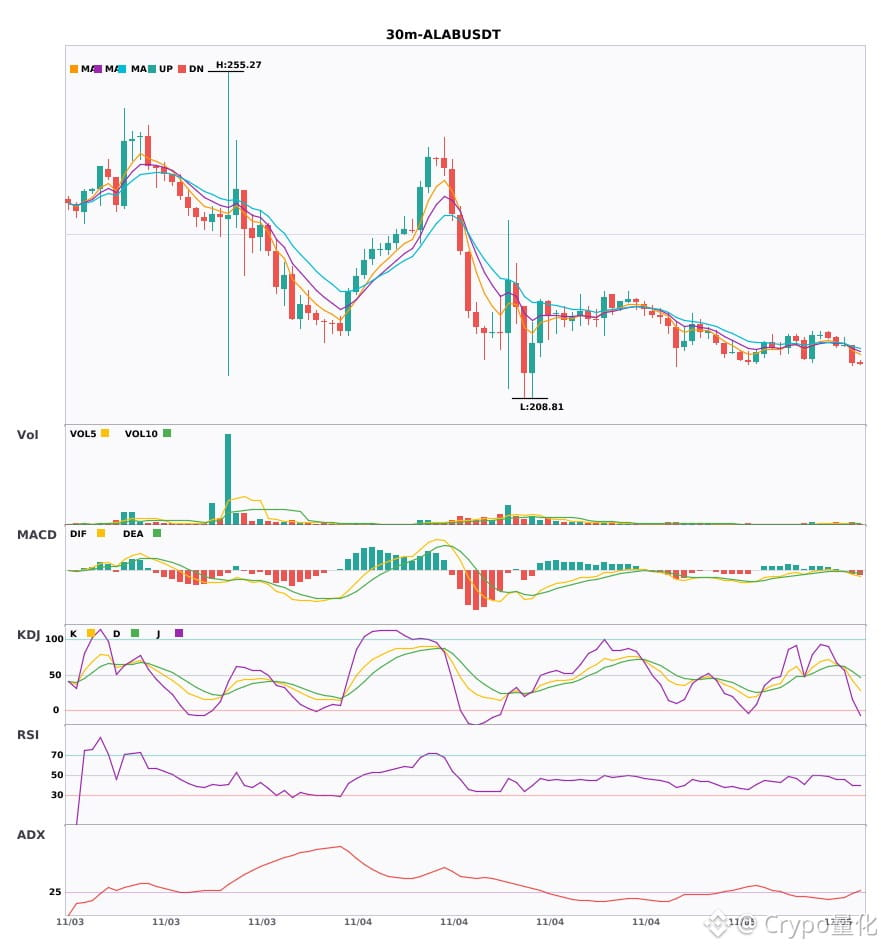
3 30-minute bearish alerts: $PLTR / $BE / $ALAB🔥
════════════════════
🟢 $PLTR 30-minute bearish signal
⚠️Technical analysis: ADX(28): Trend is forming, opportunity to participate | MACD bearish crossover below zero, bearish momentum accelerating | EMA5 crosses below EMA8, short-term outlook turns bearish | Volume surge (3.9x)
════════════════════
🟢 $BE 30-minute bearish signal
⚠️Technical analysis: ADX(34): Clear trending market | MACD bearish crossover below zero, bearish momentum accelerating | EMA5 < EMA8 < EMA13, bearish alignment | KDJ bearish crossover, short-term outlook is bearish (K: 38.5, D: 45.6) | Volume increase (1.9x)
📢Market update: Predict (PREDICT) Listing Will Be Postponed
════════════════════
🟢 $ALAB 30-minute bearish signal
⚠️Technical analysis: ADX(25): Trend is forming, opportunity to participate | MACD bearish crossover below zero, bearish momentum accelerating | EMA5 crosses below EMA8, short-term outlook turns bearish | Volume increase (2.2x)
════════════════════
🔔 Follow to get the latest market movements 🔔
#技术分析 #PLTR #BE #ALAB
📌 When trading, pay attention to whether the candlestick pattern aligns
3 30-minute bearish alerts: $PLTR / $BE / $ALAB 🔥
════════════════════
🟢 $PLTR 30-minute bearish signal
⚠️Technical analysis: ADX(28): Trend is forming, opportunity to participate | MACD bearish crossover below zero, bearish momentum accelerating | EMA5 crosses below EMA8, short-term outlook turns bearish | Volume surge (3.9x)
════════════════════
🟢 $BE 30-minute bearish signal
⚠️Technical analysis: ADX(34): Clear trending market | MACD bearish crossover below zero, bearish momentum accelerating | EMA5 < EMA8 < EMA13, bearish alignment | KDJ bearish crossover, short-term outlook is bearish (K: 38.5, D: 45.6) | Volume increase (1.9x)
📢Market update: Predict (PREDICT) Listing Will Be Postponed
════════════════════
🟢 $ALAB 30-minute bearish signal
⚠️Technical analysis: ADX(25): Trend is forming, opportunity to participate | MACD bearish crossover below zero, bearish momentum accelerating | EMA5 crosses below EMA8, short-term outlook turns bearish | Volume increase (2.2x)
════════════════════
🔔 Follow to get the latest market movements 🔔
#技术分析 #PLTR #BE #ALAB
📌 When trading, pay attention to whether the candlestick pattern aligns
════════════════════
🟢 $PLTR 30-minute bearish signal
⚠️Technical analysis: ADX(28): Trend is forming, opportunity to participate | MACD bearish crossover below zero, bearish momentum accelerating | EMA5 crosses below EMA8, short-term outlook turns bearish | Volume surge (3.9x)
════════════════════
🟢 $BE 30-minute bearish signal
⚠️Technical analysis: ADX(34): Clear trending market | MACD bearish crossover below zero, bearish momentum accelerating | EMA5 < EMA8 < EMA13, bearish alignment | KDJ bearish crossover, short-term outlook is bearish (K: 38.5, D: 45.6) | Volume increase (1.9x)
📢Market update: Predict (PREDICT) Listing Will Be Postponed
════════════════════
🟢 $ALAB 30-minute bearish signal
⚠️Technical analysis: ADX(25): Trend is forming, opportunity to participate | MACD bearish crossover below zero, bearish momentum accelerating | EMA5 crosses below EMA8, short-term outlook turns bearish | Volume increase (2.2x)
════════════════════
🔔 Follow to get the latest market movements 🔔
#技术分析 #PLTR #BE #ALAB
📌 When trading, pay attention to whether the candlestick pattern aligns
6

·
--
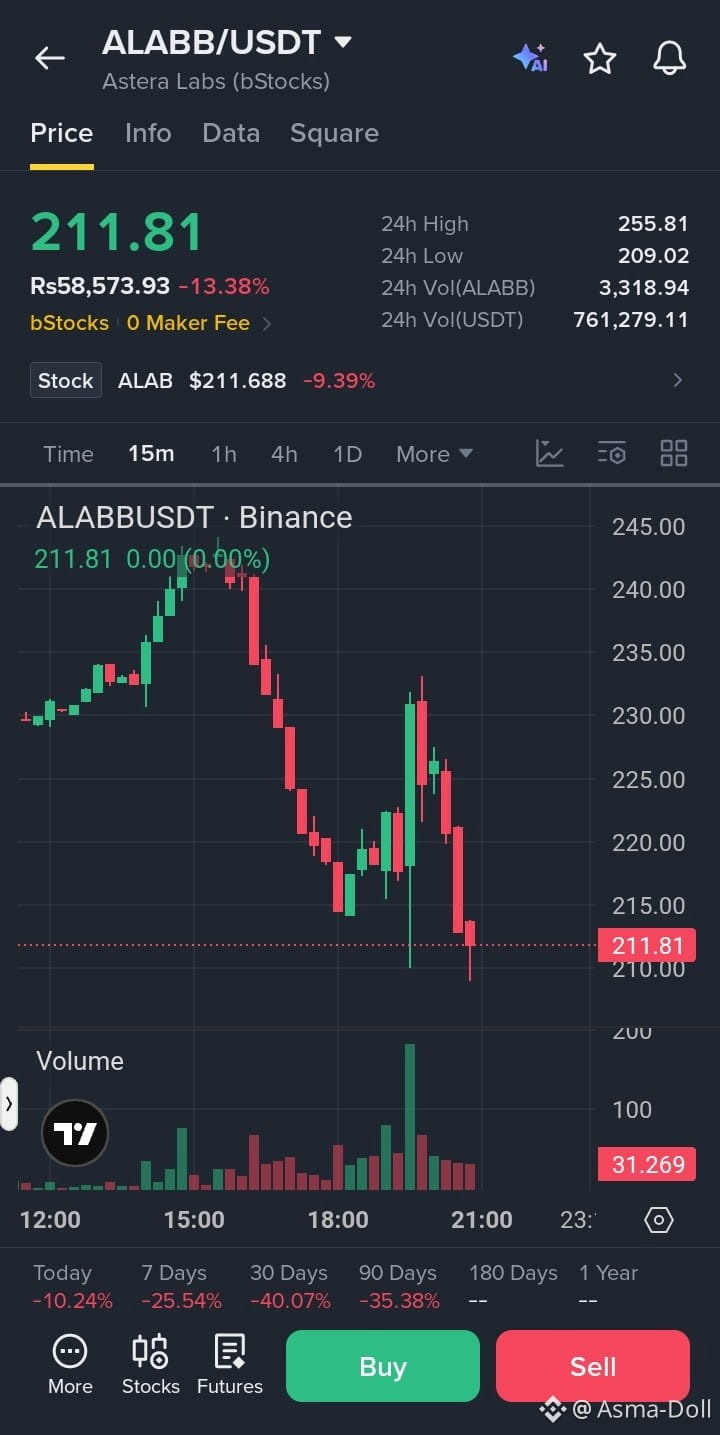
🔴 $ALABB /USDT – SHORT SIGNAL
Current Price: 211.81 USDT
Bias: Bearish 📉
📊 Trade Plan
Direction: SHORT
Entry Zone: 212.00 – 216.00
Stop Loss (SL): 225.00
Take Profit Targets:
🎯 TP1: 205.00
🎯 TP2: 198.00
🎯 TP3: 190.00
Trade here$ALABB
{spot}(ALABBUSDT)
🔍 Technical Analysis
Strong bearish move with a 13.38% daily decline.
Price dropped from 255.81 to 209.02.
Sellers remain in control.
Price is trading close to its 24-hour low.
Weak recovery suggests continued selling pressure.
A temporary relief bounce is possible before further downside.
⚡ Confirmation
Break below 209.00 with strong selling volume.
Retest of 209–212 followed by bearish rejection.
Avoid entering blindly after an extended dump.
📉 Risk-to-Reward
Approximate R:R from 214 entry:
TP1: 1:1
TP2: 1:1.78
TP3: 1:2.67
Trade Warning: Wait for confirmation. A sharp bounce is possible after such a large decline. Risk management is essential.
#ALABB #ALAB #BinanceSignals #CryptoTrading #ShortSignal
🔴 $ALABB /USDT – SHORT SIGNAL
Current Price: 211.81 USDT
Bias: Bearish 📉
📊 Trade Plan
Direction: SHORT
Entry Zone: 212.00 – 216.00
Stop Loss (SL): 225.00
Take Profit Targets:
🎯 TP1: 205.00
🎯 TP2: 198.00
🎯 TP3: 190.00
Trade here$ALABB
🔍 Technical Analysis
Strong bearish move with a 13.38% daily decline.
Price dropped from 255.81 to 209.02.
Sellers remain in control.
Price is trading close to its 24-hour low.
Weak recovery suggests continued selling pressure.
A temporary relief bounce is possible before further downside.
⚡ Confirmation
Break below 209.00 with strong selling volume.
Retest of 209–212 followed by bearish rejection.
Avoid entering blindly after an extended dump.
📉 Risk-to-Reward
Approximate R:R from 214 entry:
TP1: 1:1
TP2: 1:1.78
TP3: 1:2.67
Trade Warning: Wait for confirmation. A sharp bounce is possible after such a large decline. Risk management is essential.
#ALABB #ALAB #BinanceSignals #CryptoTrading #ShortSignal
Current Price: 211.81 USDT
Bias: Bearish 📉
📊 Trade Plan
Direction: SHORT
Entry Zone: 212.00 – 216.00
Stop Loss (SL): 225.00
Take Profit Targets:
🎯 TP1: 205.00
🎯 TP2: 198.00
🎯 TP3: 190.00
Trade here$ALABB
🔍 Technical Analysis
Strong bearish move with a 13.38% daily decline.
Price dropped from 255.81 to 209.02.
Sellers remain in control.
Price is trading close to its 24-hour low.
Weak recovery suggests continued selling pressure.
A temporary relief bounce is possible before further downside.
⚡ Confirmation
Break below 209.00 with strong selling volume.
Retest of 209–212 followed by bearish rejection.
Avoid entering blindly after an extended dump.
📉 Risk-to-Reward
Approximate R:R from 214 entry:
TP1: 1:1
TP2: 1:1.78
TP3: 1:2.67
Trade Warning: Wait for confirmation. A sharp bounce is possible after such a large decline. Risk management is essential.
#ALABB #ALAB #BinanceSignals #CryptoTrading #ShortSignal
1
47

·
--
🔻 $ALAB SHORT 🔻
Entry: 230.00 – 231.38
SL: 242.68
TP1: 220.42
TP2: 213.57
TP3: 205.00
📈 Technical Outlook:
$ALAB is showing bearish pressure after losing strength near a key technical zone. The setup is supported by EMA trend is bearish, RSI supports bearish momentum, volume confirms stronger pressure. As long as price stays below the entry area, sellers may continue pushing toward the listed downside targets.
#ALAB #Crypto #BinanceSquare #Trading
🔻 $ALAB SHORT 🔻
Entry: 230.00 – 231.38
SL: 242.68
TP1: 220.42
TP2: 213.57
TP3: 205.00
📈 Technical Outlook:
$ALAB is showing bearish pressure after losing strength near a key technical zone. The setup is supported by EMA trend is bearish, RSI supports bearish momentum, volume confirms stronger pressure. As long as price stays below the entry area, sellers may continue pushing toward the listed downside targets.
#ALAB #Crypto #BinanceSquare #Trading
Entry: 230.00 – 231.38
SL: 242.68
TP1: 220.42
TP2: 213.57
TP3: 205.00
📈 Technical Outlook:
$ALAB is showing bearish pressure after losing strength near a key technical zone. The setup is supported by EMA trend is bearish, RSI supports bearish momentum, volume confirms stronger pressure. As long as price stays below the entry area, sellers may continue pushing toward the listed downside targets.
#ALAB #Crypto #BinanceSquare #Trading

5

·
--
🚀 $ALAB CRUSHES $300 RESISTANCE AS BULLS CHARGE TOWARD NEW HIGHS! 💥
Entry: 300 ⚡
Target: 320 🚀
$ALAB just cleared the psychological $300 barrier with aggressive momentum, leaving sellers scrambling as high-volume breakout candles print on the charts. Buyers are stepping up, flipping this previous ceiling into a fortified bid zone. 📊
With order flow heavily favoring the bulls, expansion toward higher liquidity targets looks imminent while price holds firmly above structural support. ⚡ Active momentum across the sector is pulling along correlated plays like $BEAMX and $BICO . 💡
Are you riding this breakout to the upper targets or waiting for a retest of support? 👇
⚠️ Not financial advice. Always manage your risk. 🛡️
🏷️ #ALAB #Breakout #Altcoins #Crypto
🔥 ⚡
🚀 $ALAB CRUSHES $300 RESISTANCE AS BULLS CHARGE TOWARD NEW HIGHS! 💥
Entry: 300 ⚡
Target: 320 🚀
$ALAB just cleared the psychological $300 barrier with aggressive momentum, leaving sellers scrambling as high-volume breakout candles print on the charts. Buyers are stepping up, flipping this previous ceiling into a fortified bid zone. 📊
With order flow heavily favoring the bulls, expansion toward higher liquidity targets looks imminent while price holds firmly above structural support. ⚡ Active momentum across the sector is pulling along correlated plays like $BEAMX and $BICO . 💡
Are you riding this breakout to the upper targets or waiting for a retest of support? 👇
⚠️ Not financial advice. Always manage your risk. 🛡️
🏷️ #ALAB #Breakout #Altcoins #Crypto
🔥 ⚡
Entry: 300 ⚡
Target: 320 🚀
$ALAB just cleared the psychological $300 barrier with aggressive momentum, leaving sellers scrambling as high-volume breakout candles print on the charts. Buyers are stepping up, flipping this previous ceiling into a fortified bid zone. 📊
With order flow heavily favoring the bulls, expansion toward higher liquidity targets looks imminent while price holds firmly above structural support. ⚡ Active momentum across the sector is pulling along correlated plays like $BEAMX and $BICO . 💡
Are you riding this breakout to the upper targets or waiting for a retest of support? 👇
⚠️ Not financial advice. Always manage your risk. 🛡️
🏷️ #ALAB #Breakout #Altcoins #Crypto
🔥 ⚡
9
Log in to explore more content
Join global crypto users on Binance Square
⚡️ Get latest and useful information about crypto.
💬 Trusted by the world’s largest crypto exchange.
👍 Discover real insights from verified creators.
Email / Phone number
Trending Topics
1
#BitcoinCorePatchesAIDiscoveredVulnerability
7 views
34 Discussing
2
#CanBTCReboundAfterFallingBelow60K?
448,740 views
1,951 Discussing
3
#GlobalStocksFaceLongestLosingStreakSince2023
152,117 views
1,358 Discussing
4
#BlackRockIBITPostsRecord$541MSingleDayOutflow
5,295 views
42 Discussing
5
#AnthropicPlungesTowardIPOPriceonDay2
73,269 views
767 Discussing
6
#TwentyOneCapitalAdds172.25BTC
23,984 views
305 Discussing
7
#HKBillWouldExcludeTokenizedDepositsFromVirtualAssets
2,671 views
31 Discussing
8
#BNBDropsBelow540USDTWith8.46%DailyDecline
42,673 views
373 Discussing
9
#HKBillProposesHK$100KFineForUnauthorizedCryptoTitles
1,500 views
20 Discussing
10
#BitMineFaces$10.1BUnrealizedETHLoss
2,750 views
25 Discussing