
#eth
eth
4.5G views
27.5M Discussing
Hot
Latest


·
--
Bullish
ETH is sitting on the same support that held it twice before. Will it hold a third time?
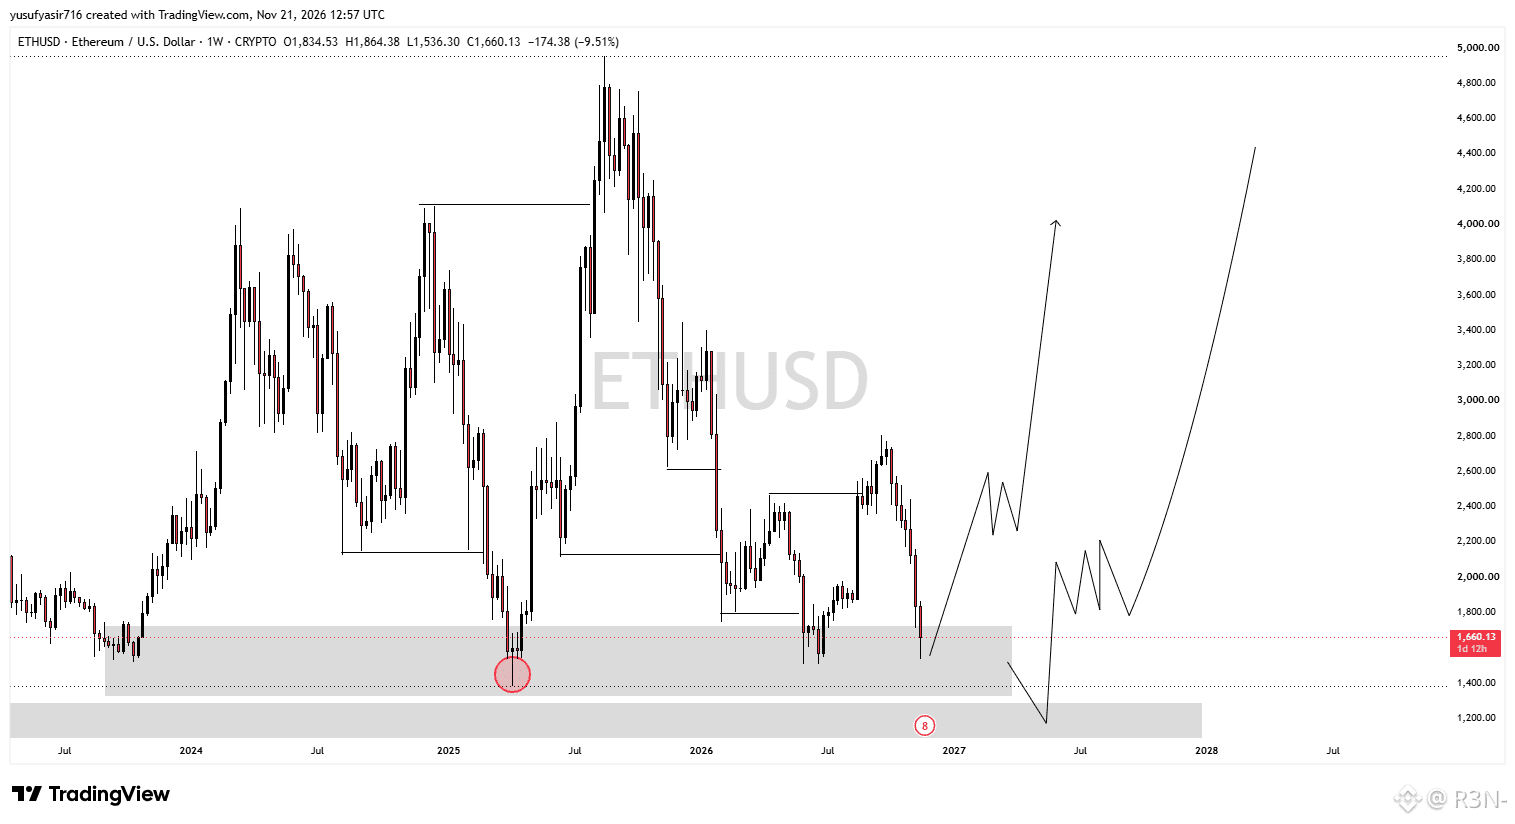
On the weekly chart, Ether trades near $1,660 after a drop of about 9.5% this week and a low near $1,536. That’s roughly 66% below its 2025 high near $4,950 (my math, levels read by eye). It’s painful to watch, especially for anyone who believed the 2025 run was the start of something bigger.
The area that matters is the grey zone from about $1,330 to $1,700. Ether bottomed there in April 2025, near $1,385, and again in mid-2026, close to $1,500. Two earlier tests held, and the market is back at the same level a third time. Repeated tests can mean strong demand, but they can also wear support down.
Below that is a second zone around $1,150 to $1,280. If the first zone fails, that’s the next area to watch. On the upside, Ether would need to climb back above the $2,000 area to show the downtrend is cooling, and it hasn’t done that yet.
There are real pressures. Ether ETFs have kept losing money, the Ethereum Foundation has been selling, and fear across crypto is extreme. One more risk: BTCS, a treasury company with a $64M Aave loan, had a liquidation line near $1,717 by CoinDesk’s estimate from Nov. 9. Ether is now below that, though the company’s position may have changed since.
My view is that Ether is at a decision point, and the reaction in this zone will say more than any prediction. This is my view, not advice.
The risk is a weekly close below $1,330. The supportive case is a market that has held this level before.
Which feels harder to you: watching support get tested again, or trusting it will hold?
#ETH $ETH #CanBTCReboundAfterFallingBelow60K?
ETH is sitting on the same support that held it twice before. Will it hold a third time?
On the weekly chart, Ether trades near $1,660 after a drop of about 9.5% this week and a low near $1,536. That’s roughly 66% below its 2025 high near $4,950 (my math, levels read by eye). It’s painful to watch, especially for anyone who believed the 2025 run was the start of something bigger.
The area that matters is the grey zone from about $1,330 to $1,700. Ether bottomed there in April 2025, near $1,385, and again in mid-2026, close to $1,500. Two earlier tests held, and the market is back at the same level a third time. Repeated tests can mean strong demand, but they can also wear support down.
Below that is a second zone around $1,150 to $1,280. If the first zone fails, that’s the next area to watch. On the upside, Ether would need to climb back above the $2,000 area to show the downtrend is cooling, and it hasn’t done that yet.
There are real pressures. Ether ETFs have kept losing money, the Ethereum Foundation has been selling, and fear across crypto is extreme. One more risk: BTCS, a treasury company with a $64M Aave loan, had a liquidation line near $1,717 by CoinDesk’s estimate from Nov. 9. Ether is now below that, though the company’s position may have changed since.
My view is that Ether is at a decision point, and the reaction in this zone will say more than any prediction. This is my view, not advice.
The risk is a weekly close below $1,330. The supportive case is a market that has held this level before.
Which feels harder to you: watching support get tested again, or trusting it will hold?
#ETH $ETH #CanBTCReboundAfterFallingBelow60K?
On the weekly chart, Ether trades near $1,660 after a drop of about 9.5% this week and a low near $1,536. That’s roughly 66% below its 2025 high near $4,950 (my math, levels read by eye). It’s painful to watch, especially for anyone who believed the 2025 run was the start of something bigger.
The area that matters is the grey zone from about $1,330 to $1,700. Ether bottomed there in April 2025, near $1,385, and again in mid-2026, close to $1,500. Two earlier tests held, and the market is back at the same level a third time. Repeated tests can mean strong demand, but they can also wear support down.
Below that is a second zone around $1,150 to $1,280. If the first zone fails, that’s the next area to watch. On the upside, Ether would need to climb back above the $2,000 area to show the downtrend is cooling, and it hasn’t done that yet.
There are real pressures. Ether ETFs have kept losing money, the Ethereum Foundation has been selling, and fear across crypto is extreme. One more risk: BTCS, a treasury company with a $64M Aave loan, had a liquidation line near $1,717 by CoinDesk’s estimate from Nov. 9. Ether is now below that, though the company’s position may have changed since.
My view is that Ether is at a decision point, and the reaction in this zone will say more than any prediction. This is my view, not advice.
The risk is a weekly close below $1,330. The supportive case is a market that has held this level before.
Which feels harder to you: watching support get tested again, or trusting it will hold?
#ETH $ETH #CanBTCReboundAfterFallingBelow60K?
2
1.6k

·
--
🤫 #BossSignal QUIZ
Where could the prices of these cryptocurrencies go today?
$BTC = $42,000
♦️ $ETH = $945
🐻 $ZEC = $125
What's your prediction? 👇
💬 Drop your answer in the comments!
Let's see who predicts the market correctly! 👊
#BossSignal #BTC #ETH #ZEC #CryptoQuiz
🤫 #BossSignal QUIZ
Where could the prices of these cryptocurrencies go today?
$BTC = $42,000
♦️ $ETH = $945
🐻 $ZEC = $125
What's your prediction? 👇
💬 Drop your answer in the comments!
Let's see who predicts the market correctly! 👊
#BossSignal #BTC #ETH #ZEC #CryptoQuiz
Where could the prices of these cryptocurrencies go today?
$BTC = $42,000
♦️ $ETH = $945
🐻 $ZEC = $125
What's your prediction? 👇
💬 Drop your answer in the comments!
Let's see who predicts the market correctly! 👊
#BossSignal #BTC #ETH #ZEC #CryptoQuiz
1️⃣ YES, ABSOLUTELY POSSIBLE!
2️⃣ NO, IMPOSSIBLE! ❌
3️⃣ I'M STILL CONFUSED! 🤔
10 hr(s) left
2.4k

·
--
Bearish
🚨 $ETH / USDT — LIQUIDITY HUNT BEFORE THE NEXT MOVE? 📉
Ethereum may still have one more upside move before sellers take control.
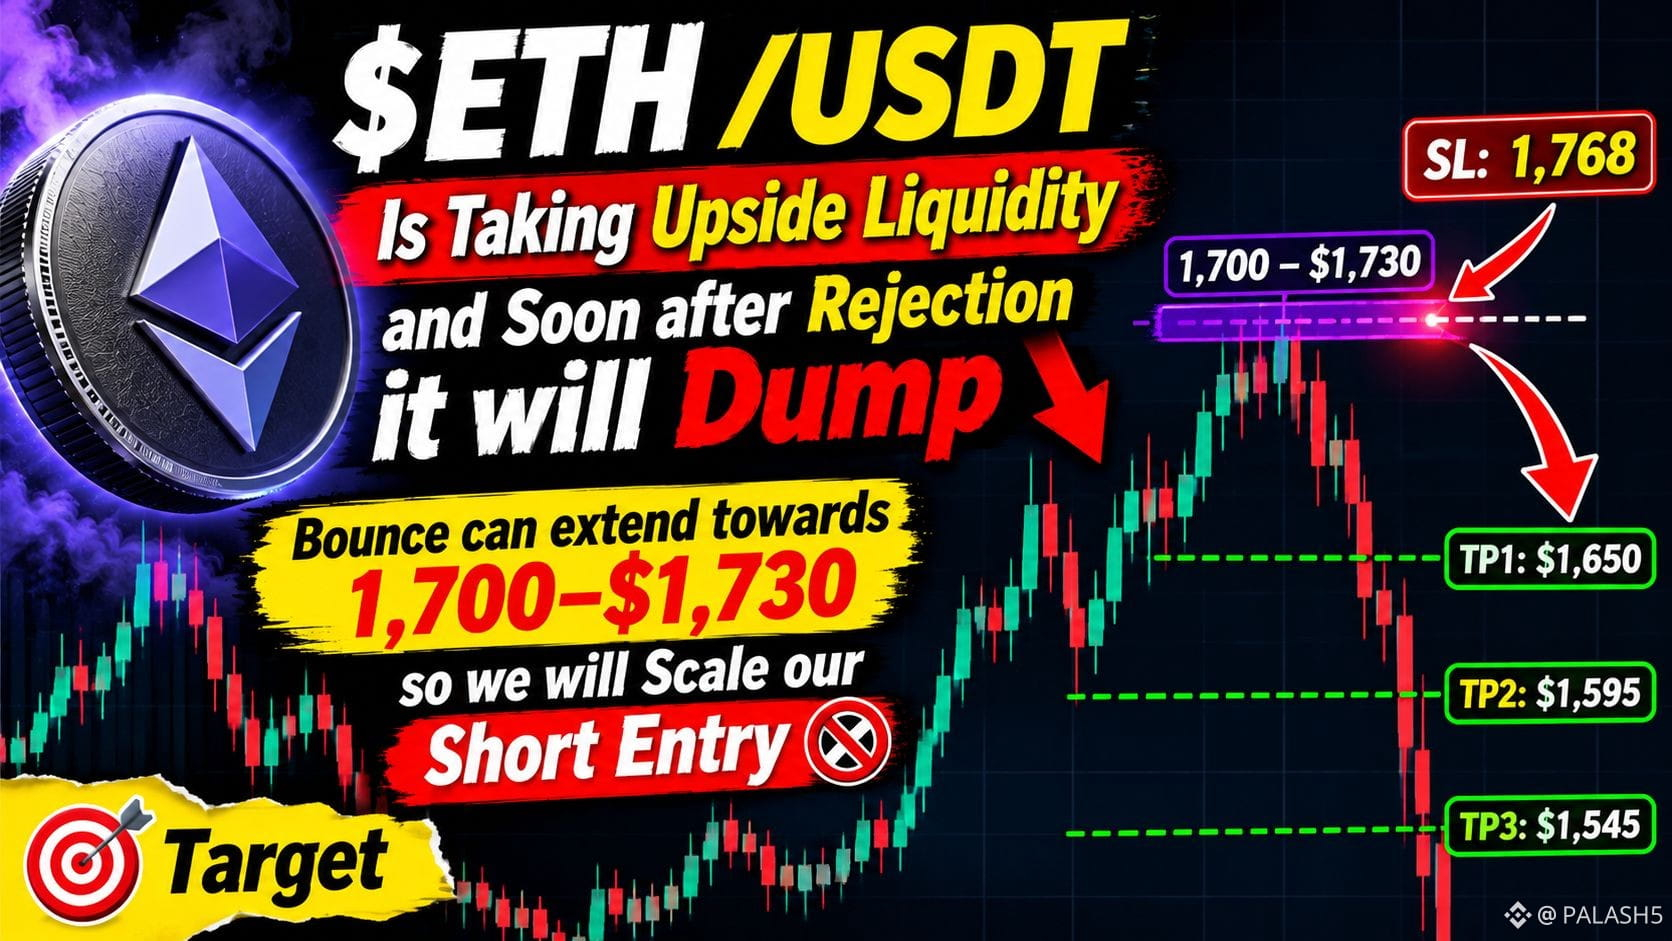
My focus is on the $1,700–$1,730 resistance zone. This could become an important area where late buyers get trapped and short sellers start defending their positions.
🎯 SHORT GAME PLAN
Scale Short Entry: $1,700–$1,730
Stop Loss: $1,768
Take Profit Targets: 🎯 TP1: $1,650 🎯 TP2: $1,595 🎯 TP3: $1,545
💡 My Unique Market Thought:
The market doesn't always dump immediately after showing bearish signals. Sometimes it first hunts upside liquidity, attracts breakout buyers, and then reverses when buying pressure starts fading.
That's why I'm watching the rejection closely rather than blindly shorting every green candle.
A strong rejection with volume confirmation could create an interesting short opportunity. However, a sustained breakout above resistance would challenge this bearish idea.
🔥 LET'S DISCUSS:
Do you think ETH will sweep $1,730 before dumping, or will bears step in earlier?
Are you preparing for a short or waiting for a bullish breakout?
Drop your analysis below! 👇
#ETH #Ethereum #CryptoTrading
$ETH
{future}(ETHUSDT)
🚨 $ETH / USDT — LIQUIDITY HUNT BEFORE THE NEXT MOVE? 📉
Ethereum may still have one more upside move before sellers take control.
My focus is on the $1,700–$1,730 resistance zone. This could become an important area where late buyers get trapped and short sellers start defending their positions.
🎯 SHORT GAME PLAN
Scale Short Entry: $1,700–$1,730
Stop Loss: $1,768
Take Profit Targets: 🎯 TP1: $1,650 🎯 TP2: $1,595 🎯 TP3: $1,545
💡 My Unique Market Thought:
The market doesn't always dump immediately after showing bearish signals. Sometimes it first hunts upside liquidity, attracts breakout buyers, and then reverses when buying pressure starts fading.
That's why I'm watching the rejection closely rather than blindly shorting every green candle.
A strong rejection with volume confirmation could create an interesting short opportunity. However, a sustained breakout above resistance would challenge this bearish idea.
🔥 LET'S DISCUSS:
Do you think ETH will sweep $1,730 before dumping, or will bears step in earlier?
Are you preparing for a short or waiting for a bullish breakout?
Drop your analysis below! 👇
#ETH #Ethereum #CryptoTrading
$ETH
Ethereum may still have one more upside move before sellers take control.
My focus is on the $1,700–$1,730 resistance zone. This could become an important area where late buyers get trapped and short sellers start defending their positions.
🎯 SHORT GAME PLAN
Scale Short Entry: $1,700–$1,730
Stop Loss: $1,768
Take Profit Targets: 🎯 TP1: $1,650 🎯 TP2: $1,595 🎯 TP3: $1,545
💡 My Unique Market Thought:
The market doesn't always dump immediately after showing bearish signals. Sometimes it first hunts upside liquidity, attracts breakout buyers, and then reverses when buying pressure starts fading.
That's why I'm watching the rejection closely rather than blindly shorting every green candle.
A strong rejection with volume confirmation could create an interesting short opportunity. However, a sustained breakout above resistance would challenge this bearish idea.
🔥 LET'S DISCUSS:
Do you think ETH will sweep $1,730 before dumping, or will bears step in earlier?
Are you preparing for a short or waiting for a bullish breakout?
Drop your analysis below! 👇
#ETH #Ethereum #CryptoTrading
$ETH
2k


·
--
Bullish
PRIME_CRYPT0:
Thinking this too
13
9
10.3k

·
--
Bullish
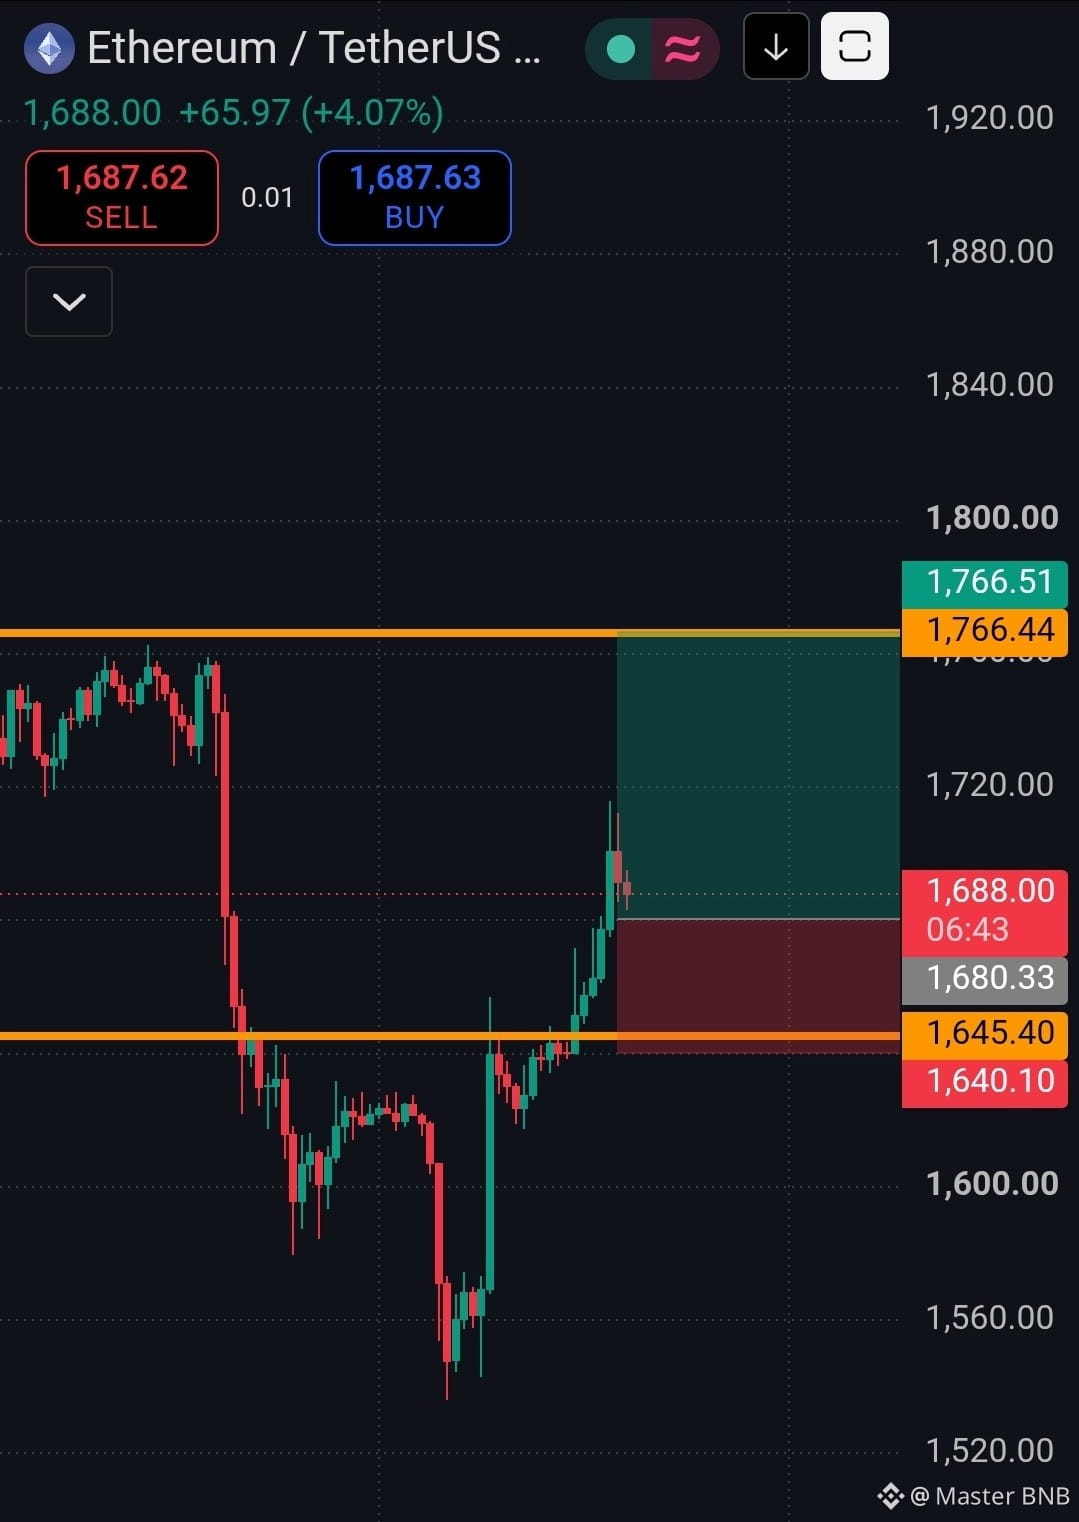
Lonnie Pantano t6vC:
İts gonna fall back after hitting 1720
1
1
1.8k

·
--
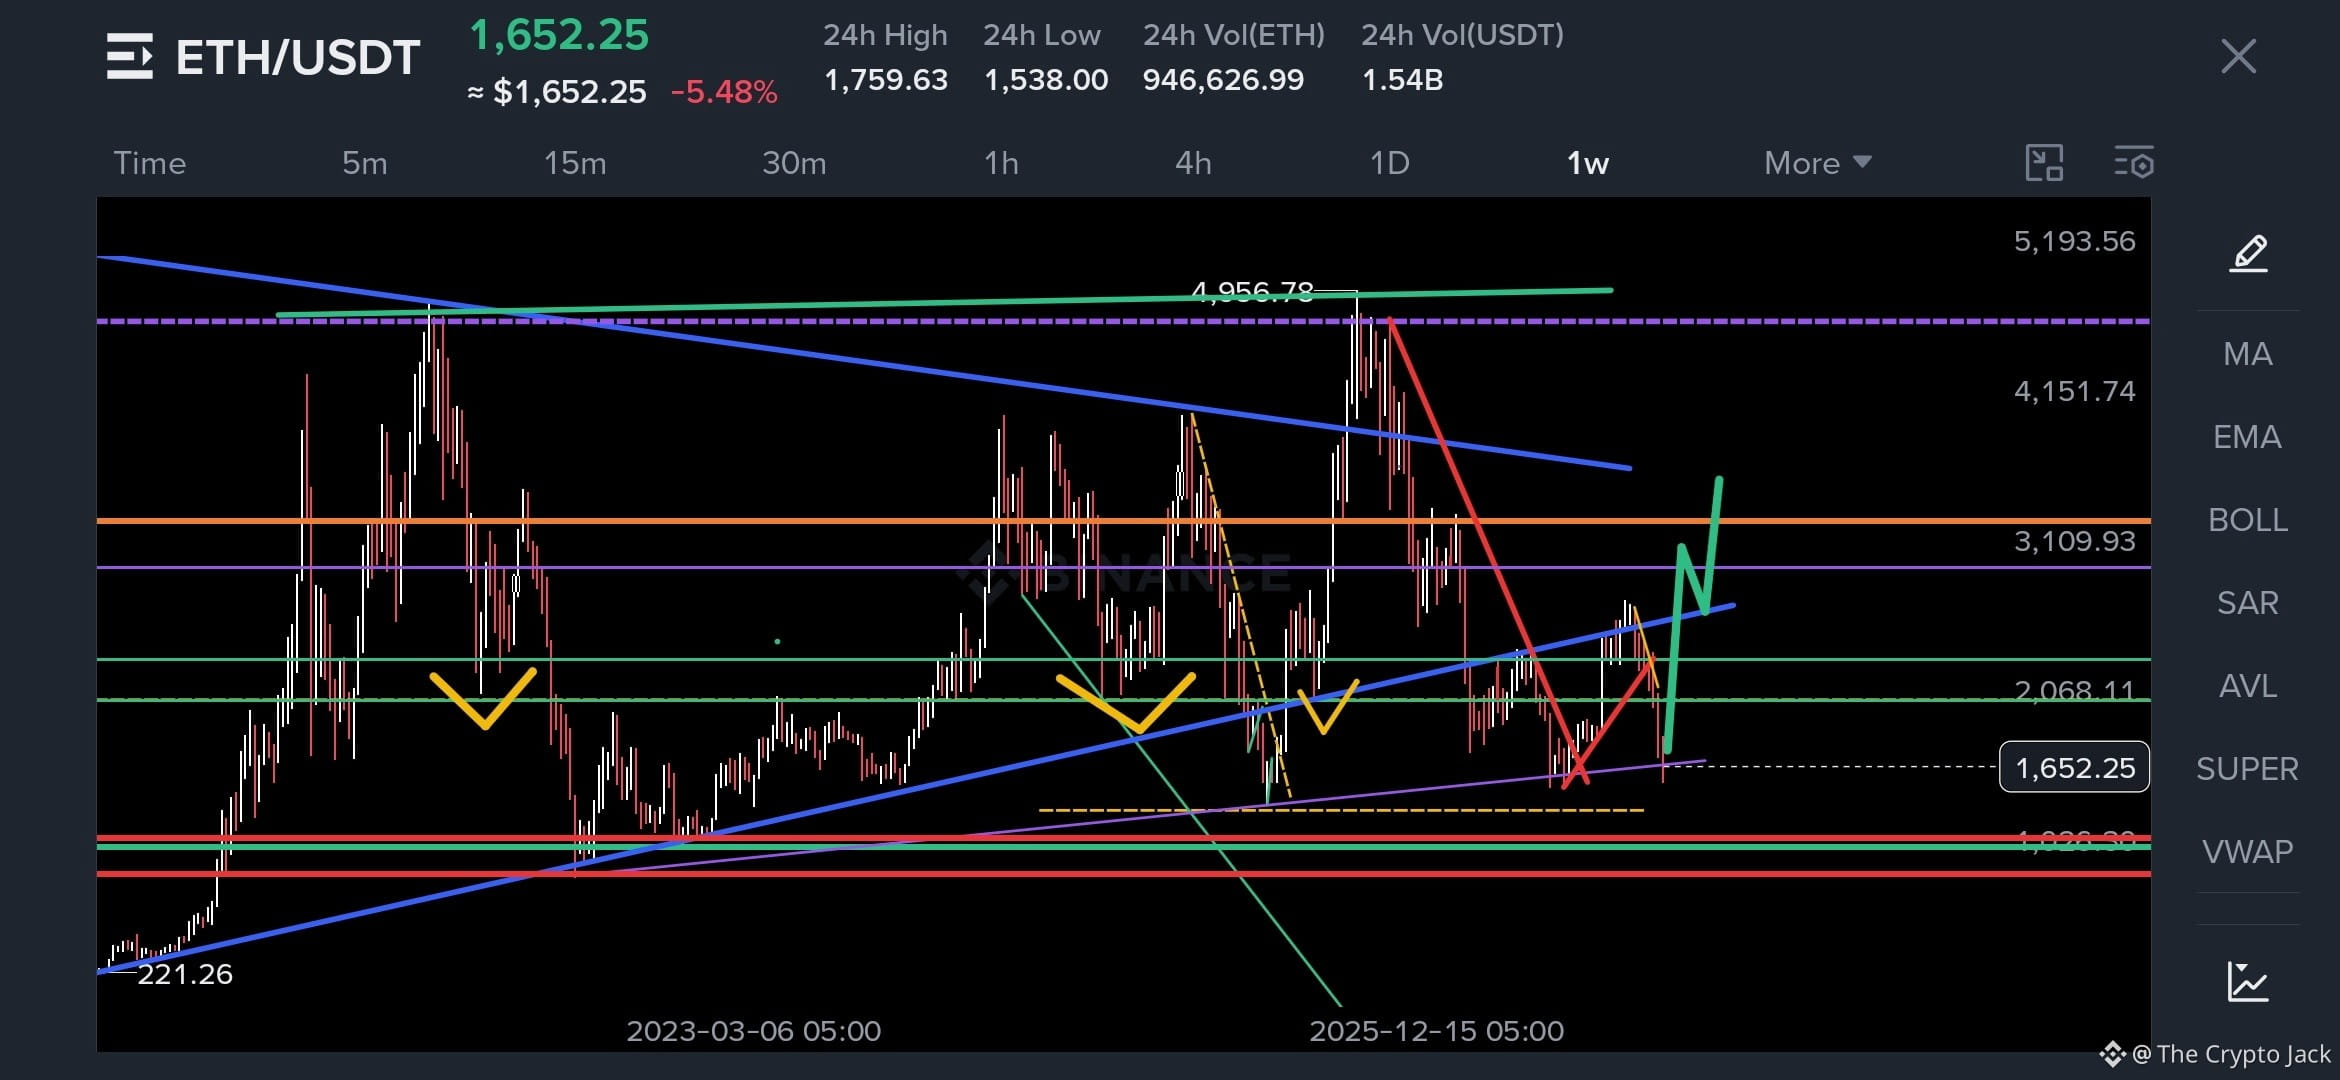
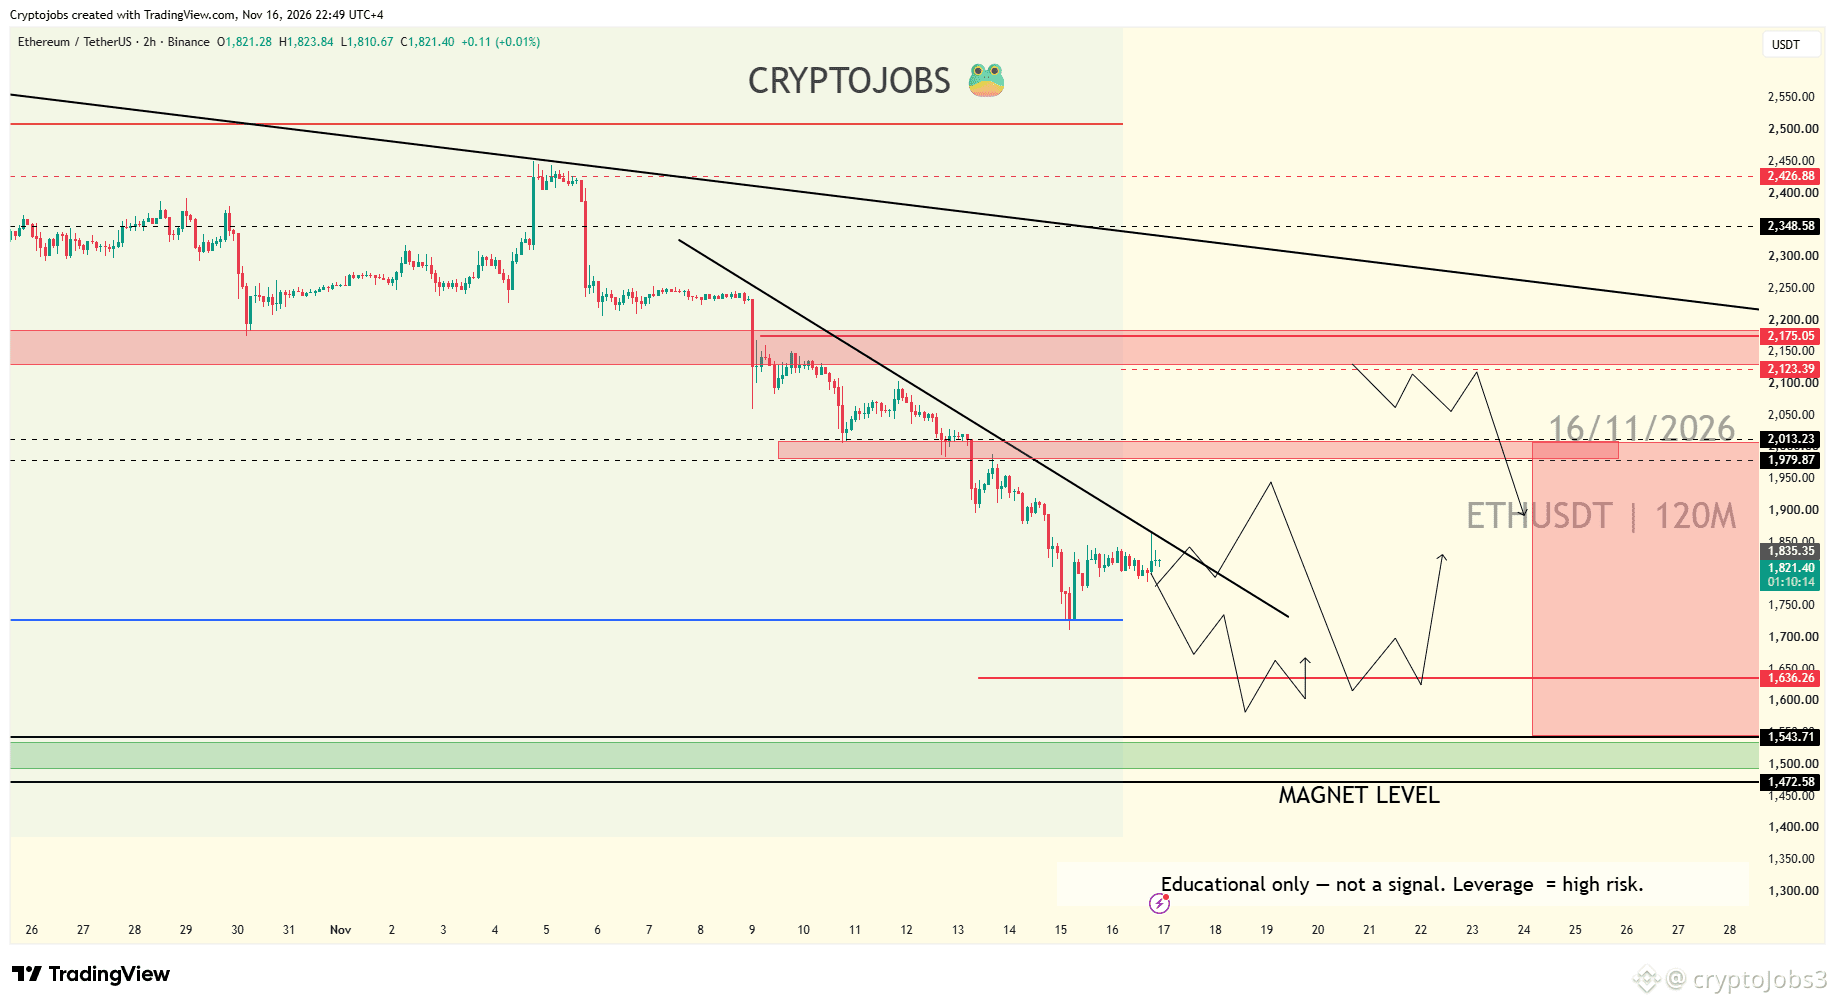
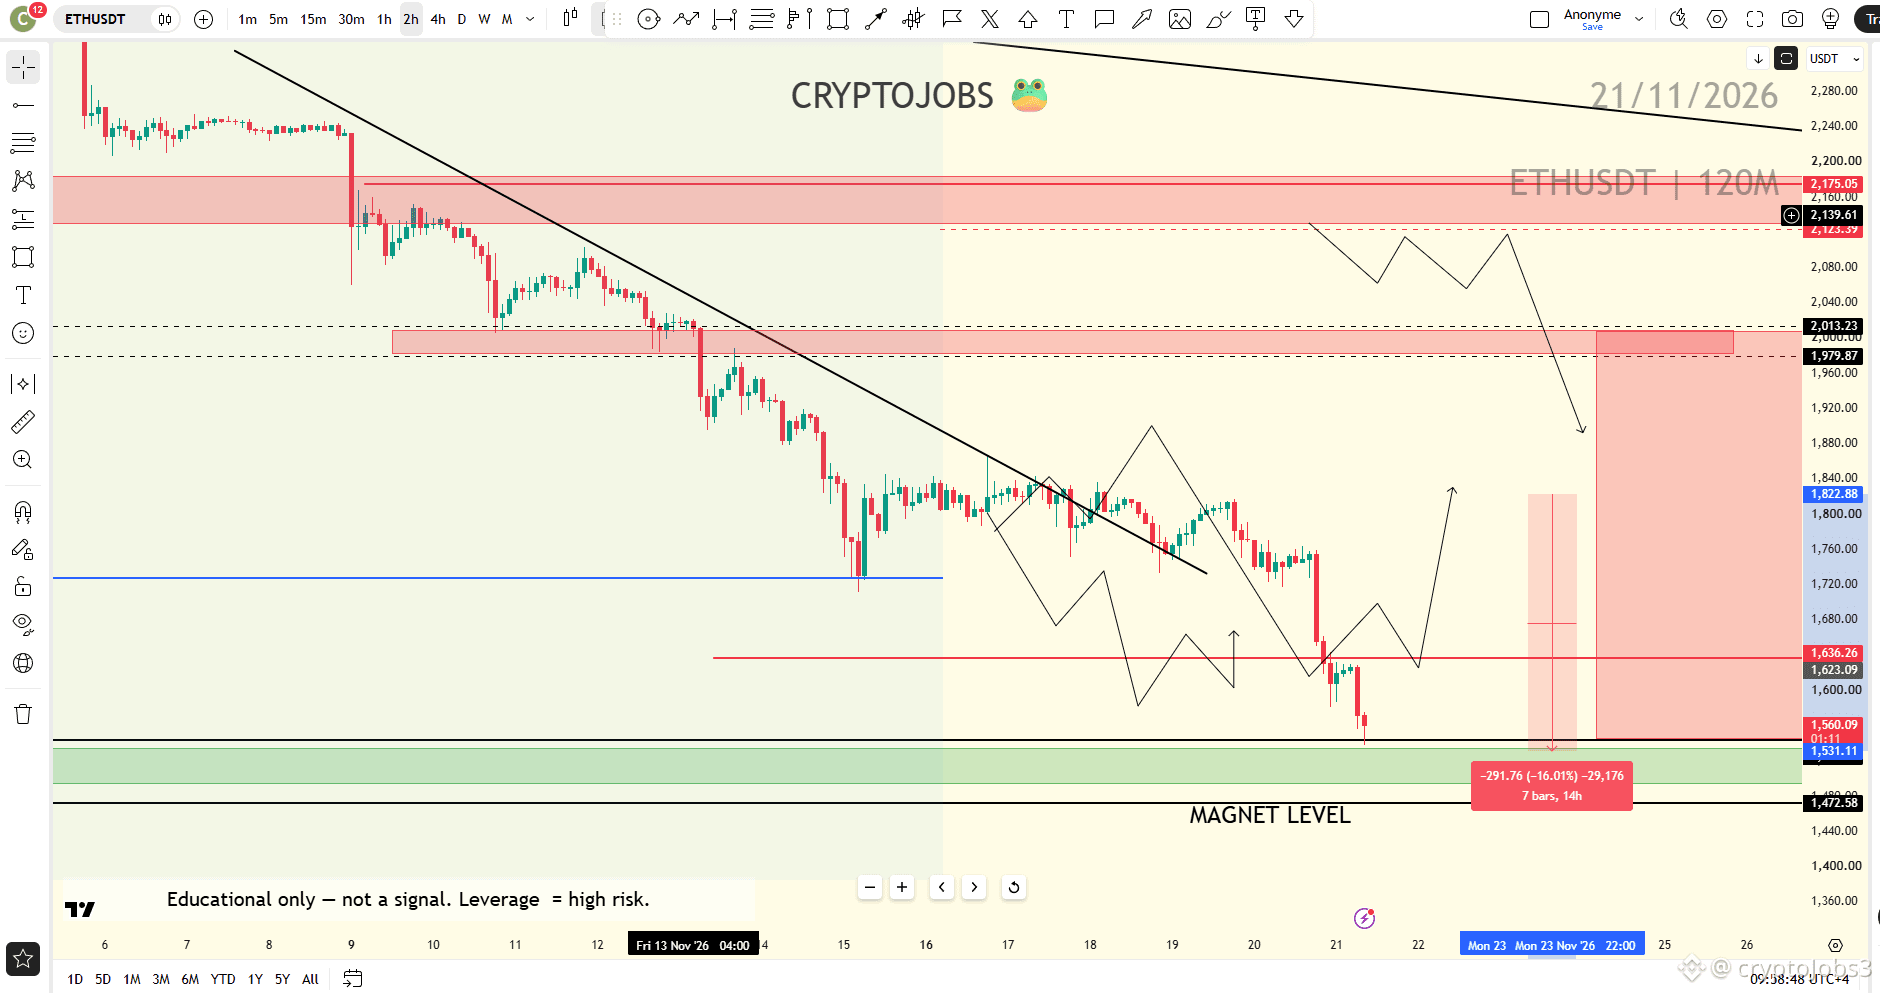
$ETH weekly outlook update: SETUP COMPLETED ✅
On 16 Nov the map was clear: bearish under 2,200, 1,640 POC first, then the magnet level.
From 1,820 to 1,538. That's a 15%+ drop in 5 days 😱
1,640 broke and price went straight into the magnet level, right on the lines.
BTC and ETH, same story: the weekly setups keep playing out.
Next week's outlooks are coming. Don't be the one who finds out after the move.
Like and share if you enjoy seeing such complete analyses every week. 👍
#ETH #trading
$ETH weekly outlook update: SETUP COMPLETED ✅
On 16 Nov the map was clear: bearish under 2,200, 1,640 POC first, then the magnet level.
From 1,820 to 1,538. That's a 15%+ drop in 5 days 😱
1,640 broke and price went straight into the magnet level, right on the lines.
BTC and ETH, same story: the weekly setups keep playing out.
Next week's outlooks are coming. Don't be the one who finds out after the move.
Like and share if you enjoy seeing such complete analyses every week. 👍
#ETH #trading
On 16 Nov the map was clear: bearish under 2,200, 1,640 POC first, then the magnet level.
From 1,820 to 1,538. That's a 15%+ drop in 5 days 😱
1,640 broke and price went straight into the magnet level, right on the lines.
BTC and ETH, same story: the weekly setups keep playing out.
Next week's outlooks are coming. Don't be the one who finds out after the move.
Like and share if you enjoy seeing such complete analyses every week. 👍
#ETH #trading
cryptoJobs3
·
--
Ethereum Weekly Outlook, Week 47 📊
Last week's map on $ETH played out perfectly: $1,920, $1,870, $1,860 and $1,820 all got hit ✅
The backdrop is still heavy. Spot ETH ETFs saw about $399M of net outflows from 9 to 13 Nov, and $488M of Ether positions got liquidated in the weekend flush
My map for the week
Monthly resistances: $2,150, $2,460, $2,930, $3,165
Key level: $1,640, the weekly POC
Demand: $1,520 to $1,500, then $1,500 to $1,480 (strong), $1,360 (weak)
Deep supports: $1,150 to $1,100 and the $1,100 VAL
Most of the volume sits around $1,500, so losing the POC could speed things up. Don't underestimate this
Short term I'm watching for a move into $1,640 and a bull reaction from there. As long as bulls can't push above $2,200, the $1,500 scenario stays the most probable one
Which one comes first, $1,640 or $2,200?
Full outlook on CryptoJobs3.com · Analysis Hub
#ETH #Etherum
Last week's map on $ETH played out perfectly: $1,920, $1,870, $1,860 and $1,820 all got hit ✅
The backdrop is still heavy. Spot ETH ETFs saw about $399M of net outflows from 9 to 13 Nov, and $488M of Ether positions got liquidated in the weekend flush
My map for the week
Monthly resistances: $2,150, $2,460, $2,930, $3,165
Key level: $1,640, the weekly POC
Demand: $1,520 to $1,500, then $1,500 to $1,480 (strong), $1,360 (weak)
Deep supports: $1,150 to $1,100 and the $1,100 VAL
Most of the volume sits around $1,500, so losing the POC could speed things up. Don't underestimate this
Short term I'm watching for a move into $1,640 and a bull reaction from there. As long as bulls can't push above $2,200, the $1,500 scenario stays the most probable one
Which one comes first, $1,640 or $2,200?
Full outlook on CryptoJobs3.com · Analysis Hub
#ETH #Etherum
3
1.5k

·
--
Bullish
3 Major Altcoins #ETH #BCH #SOL Ready To pump after big dump. Spot Opportunity
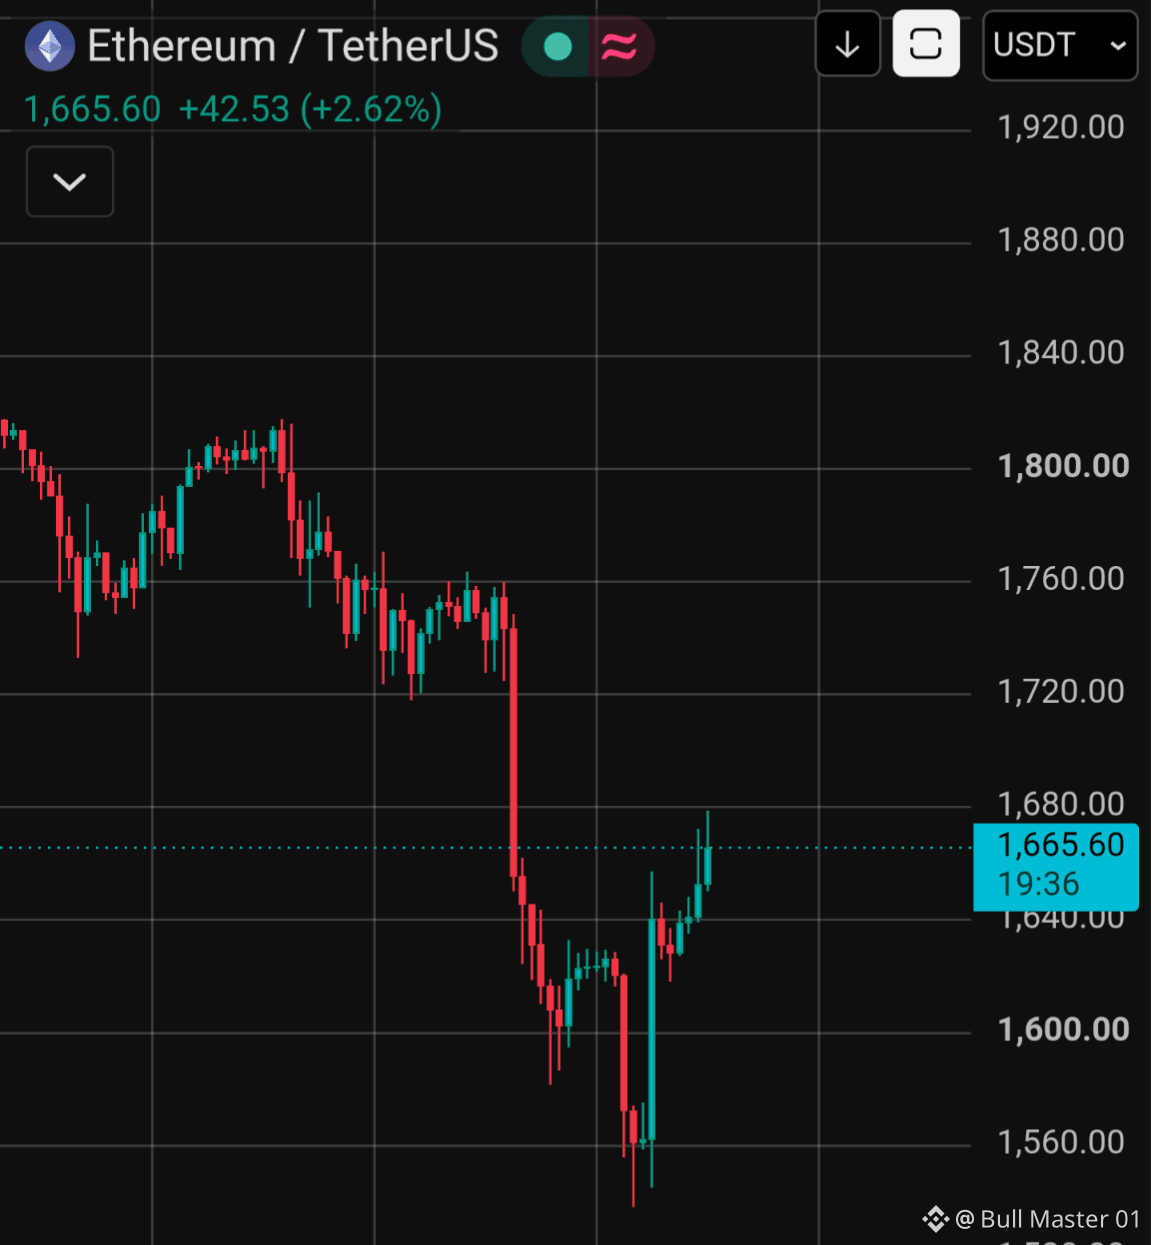
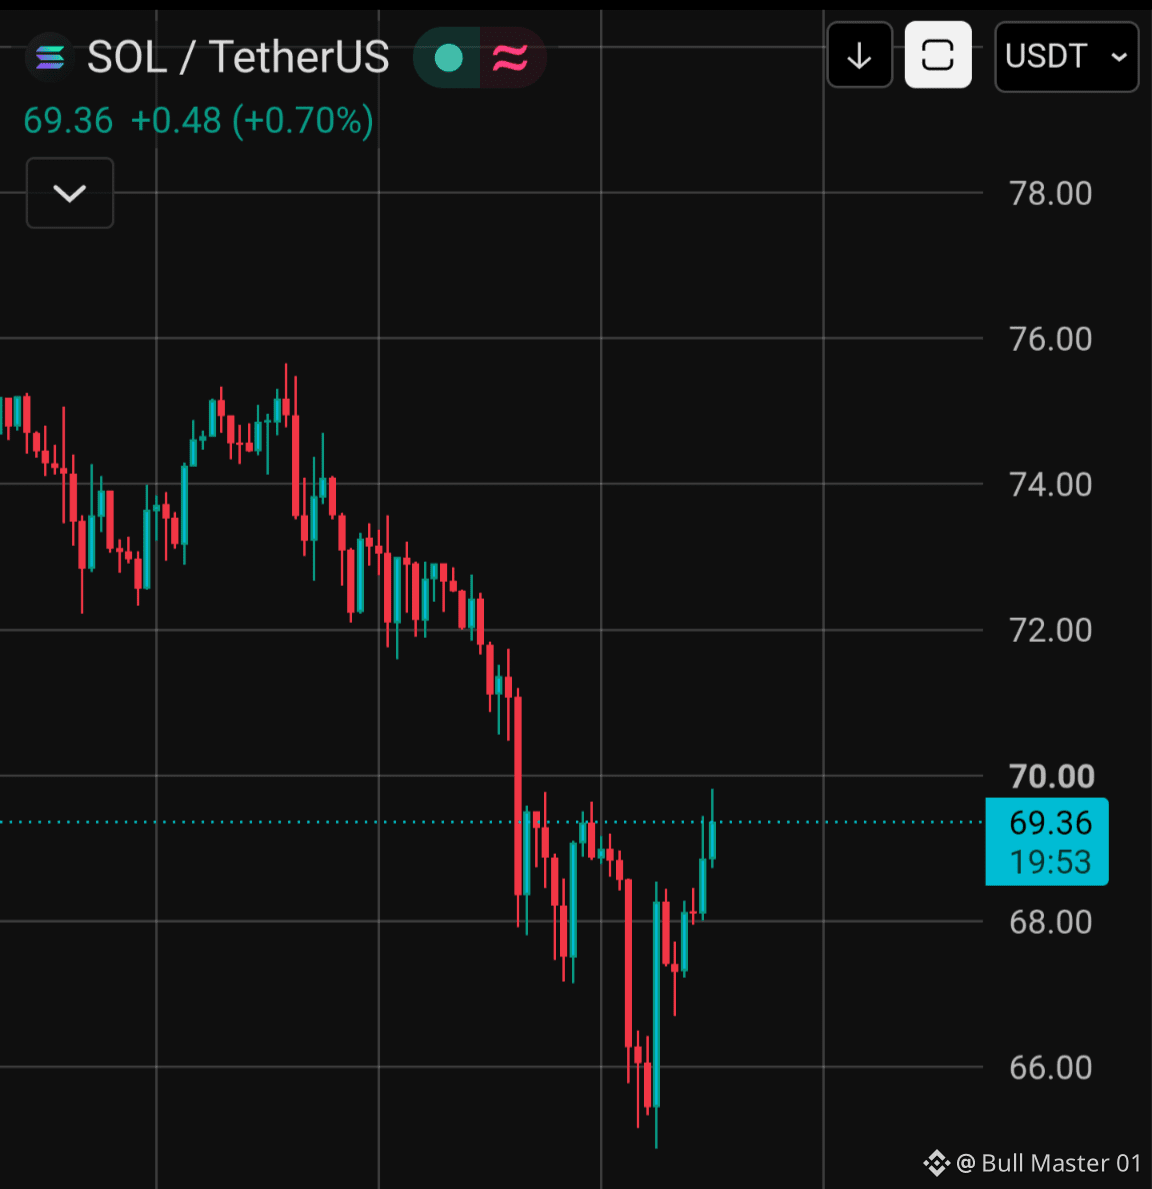
The market just gave us a massive discount. Look at these charts: heavy sell-offs, but the long wicks at the bottom show buyers are stepping in aggressively. We are looking at textbook V-shaped recoveries.
No stress, no liquidation risk. Just buy, hold, and sell at the targets.
Here are the 3 Spot Setups:
$SOL Solana
Buy Zone: $68.00 – $69.50
TP1: $72.00
TP2: $74.50
TP3: $78.00
Why? Massive rejection wick at $66. The bounce is already starting.
{spot}(SOLUSDT)
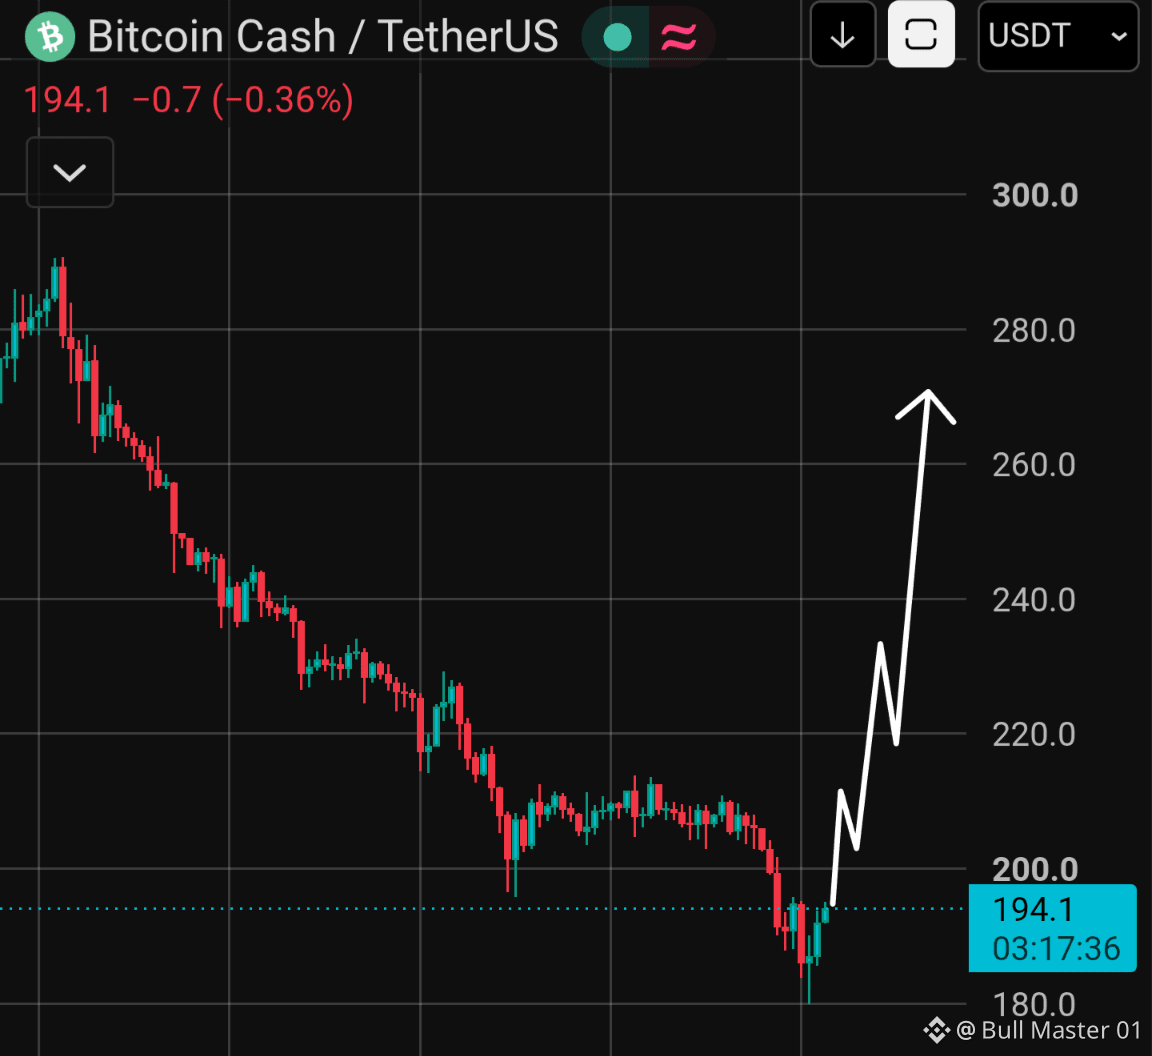
$BCH Bitcoin Cash
Buy Zone: $190.00 – $196.00
TP1: $210.00
TP2: $240.00
TP3: $280.00
Why? Perfect bottom wick at $180. Heavily oversold, ready for a violent bounce back above $200.
{spot}(BCHUSDT)
$ETH Ethereum
Target 1800
SL: 1620
{spot}(ETHUSDT)
The Safe Execution Plan:
Spot Only: Buy the actual coins.
Accumulate: Scale in at the buy zones.
Sell on the way up: Take profits at TP1, TP2, and TP3.
No SL needed: It's spot. Even if it dips, you own the asset and can wait for the next pump.
This is the easiest money in crypto. Buy the fear, sell the greed.
Which one are you grabbing?
NFA. DYOR.
3 Major Altcoins #ETH #BCH #SOL Ready To pump after big dump. Spot Opportunity
The market just gave us a massive discount. Look at these charts: heavy sell-offs, but the long wicks at the bottom show buyers are stepping in aggressively. We are looking at textbook V-shaped recoveries.
No stress, no liquidation risk. Just buy, hold, and sell at the targets.
Here are the 3 Spot Setups:
$SOL Solana
Buy Zone: $68.00 – $69.50
TP1: $72.00
TP2: $74.50
TP3: $78.00
Why? Massive rejection wick at $66. The bounce is already starting.
$BCH Bitcoin Cash
Buy Zone: $190.00 – $196.00
TP1: $210.00
TP2: $240.00
TP3: $280.00
Why? Perfect bottom wick at $180. Heavily oversold, ready for a violent bounce back above $200.
$ETH Ethereum
Target 1800
SL: 1620
The Safe Execution Plan:
Spot Only: Buy the actual coins.
Accumulate: Scale in at the buy zones.
Sell on the way up: Take profits at TP1, TP2, and TP3.
No SL needed: It's spot. Even if it dips, you own the asset and can wait for the next pump.
This is the easiest money in crypto. Buy the fear, sell the greed.
Which one are you grabbing?
NFA. DYOR.
The market just gave us a massive discount. Look at these charts: heavy sell-offs, but the long wicks at the bottom show buyers are stepping in aggressively. We are looking at textbook V-shaped recoveries.
No stress, no liquidation risk. Just buy, hold, and sell at the targets.
Here are the 3 Spot Setups:
$SOL Solana
Buy Zone: $68.00 – $69.50
TP1: $72.00
TP2: $74.50
TP3: $78.00
Why? Massive rejection wick at $66. The bounce is already starting.
$BCH Bitcoin Cash
Buy Zone: $190.00 – $196.00
TP1: $210.00
TP2: $240.00
TP3: $280.00
Why? Perfect bottom wick at $180. Heavily oversold, ready for a violent bounce back above $200.
$ETH Ethereum
Target 1800
SL: 1620
The Safe Execution Plan:
Spot Only: Buy the actual coins.
Accumulate: Scale in at the buy zones.
Sell on the way up: Take profits at TP1, TP2, and TP3.
No SL needed: It's spot. Even if it dips, you own the asset and can wait for the next pump.
This is the easiest money in crypto. Buy the fear, sell the greed.
Which one are you grabbing?
NFA. DYOR.
5
665


·
--
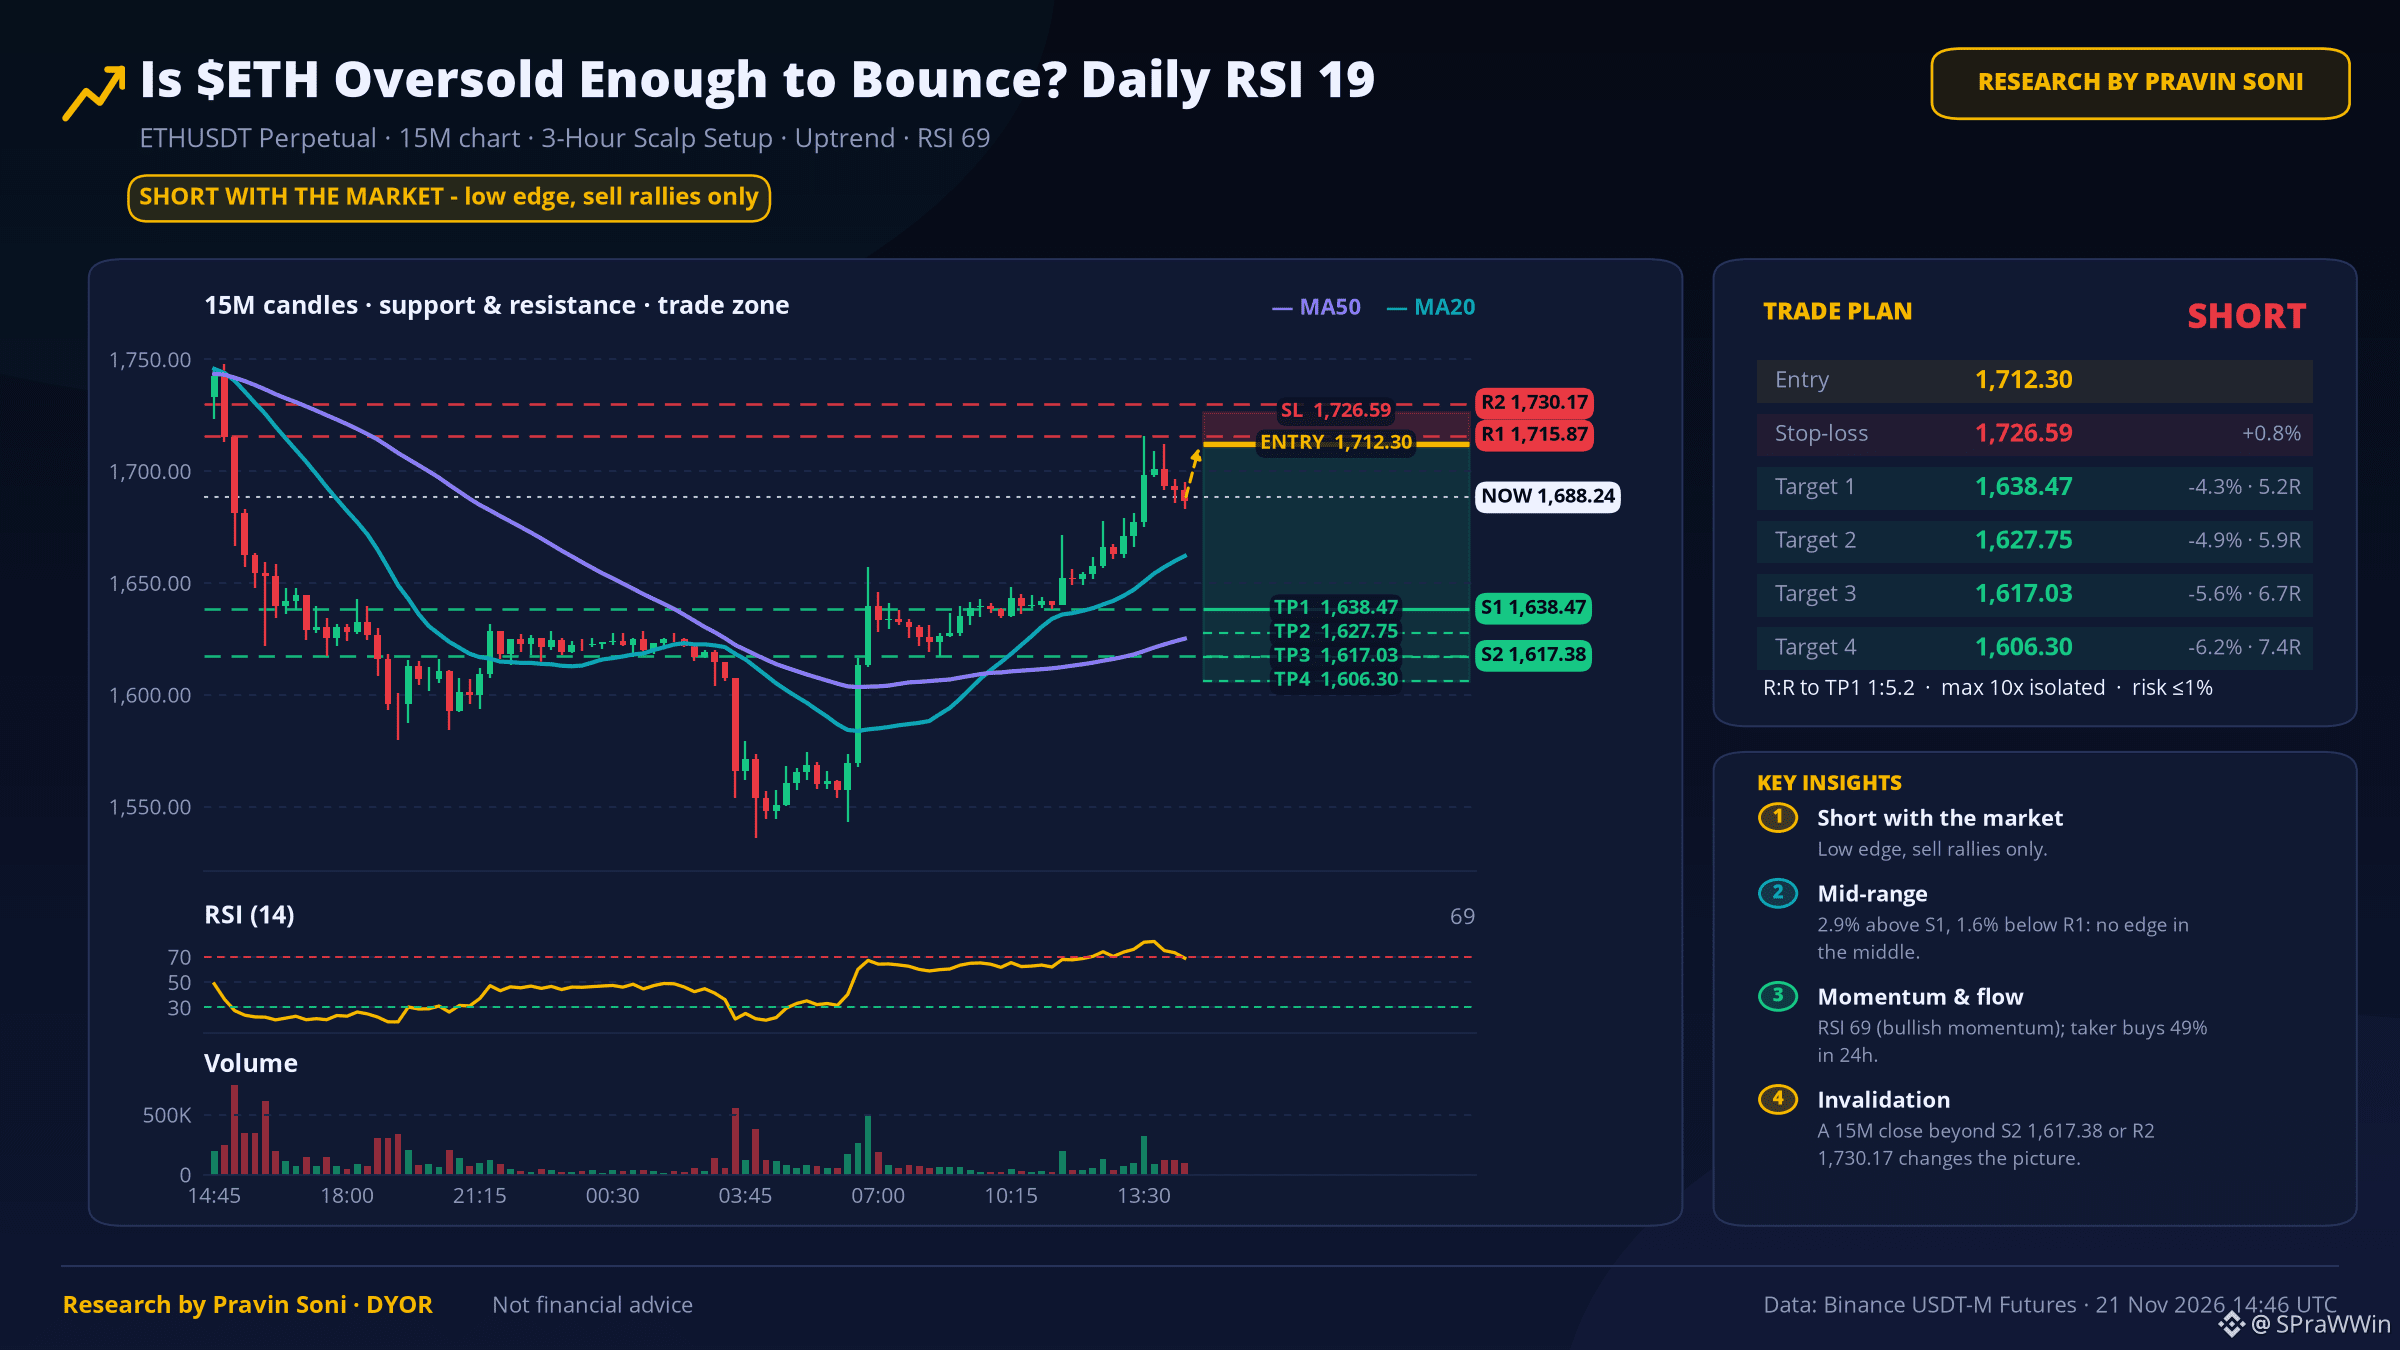
$ETH SHORT Setup 🔴 Entry 1,712.30 · SL 1,726.59 · 4 Targets
TL;DR: short idea from 1,712.30, stop 1,726.59 (+0.8%), first target 1,638.47 (5.2R).
🧪 Research verdict: SHORT WITH THE MARKET - low edge, sell rallies only
✅ What supports it
1️⃣ Top traders more bearish than the crowd
2️⃣ Open interest -10% in 24h
3️⃣ Volume 2.3x its 30-day average
⚠️ Risk to the idea: RSI 19: oversold on the daily
🎯 The plan
⚡ Entry: 1,712.30 (limit, on a retest)
⛔ Stop-loss: 1,726.59 (+0.8%)
🎯 TP1: 1,638.47 (-4.3% · 5.2R) · ~2% touch in 3h
🎯 TP2: 1,627.75 (-4.9% · 5.9R) · ~1% touch in 3h
🎯 TP3: 1,617.03 (-5.6% · 6.7R) · ~0% touch in 3h
🎯 TP4: 1,606.30 (-6.2% · 7.4R) · ~0% touch in 3h
📐 Odds TP1 hits before the stop with no edge: 16%. That's why R:R must be ≥ 1.5.
🛠️ How I'd manage it
1) Limit order at entry, no chasing candles.
2) Stop goes in right after the fill and never gets widened.
3) Small partial at TP1, then trail the stop for TP2-TP4 (in our 2-year test, booking everything early cut the edge to ~0).
4) Risk ≤1% of capital, max 10x isolated.
❌ Invalid: daily close above 1,726.59
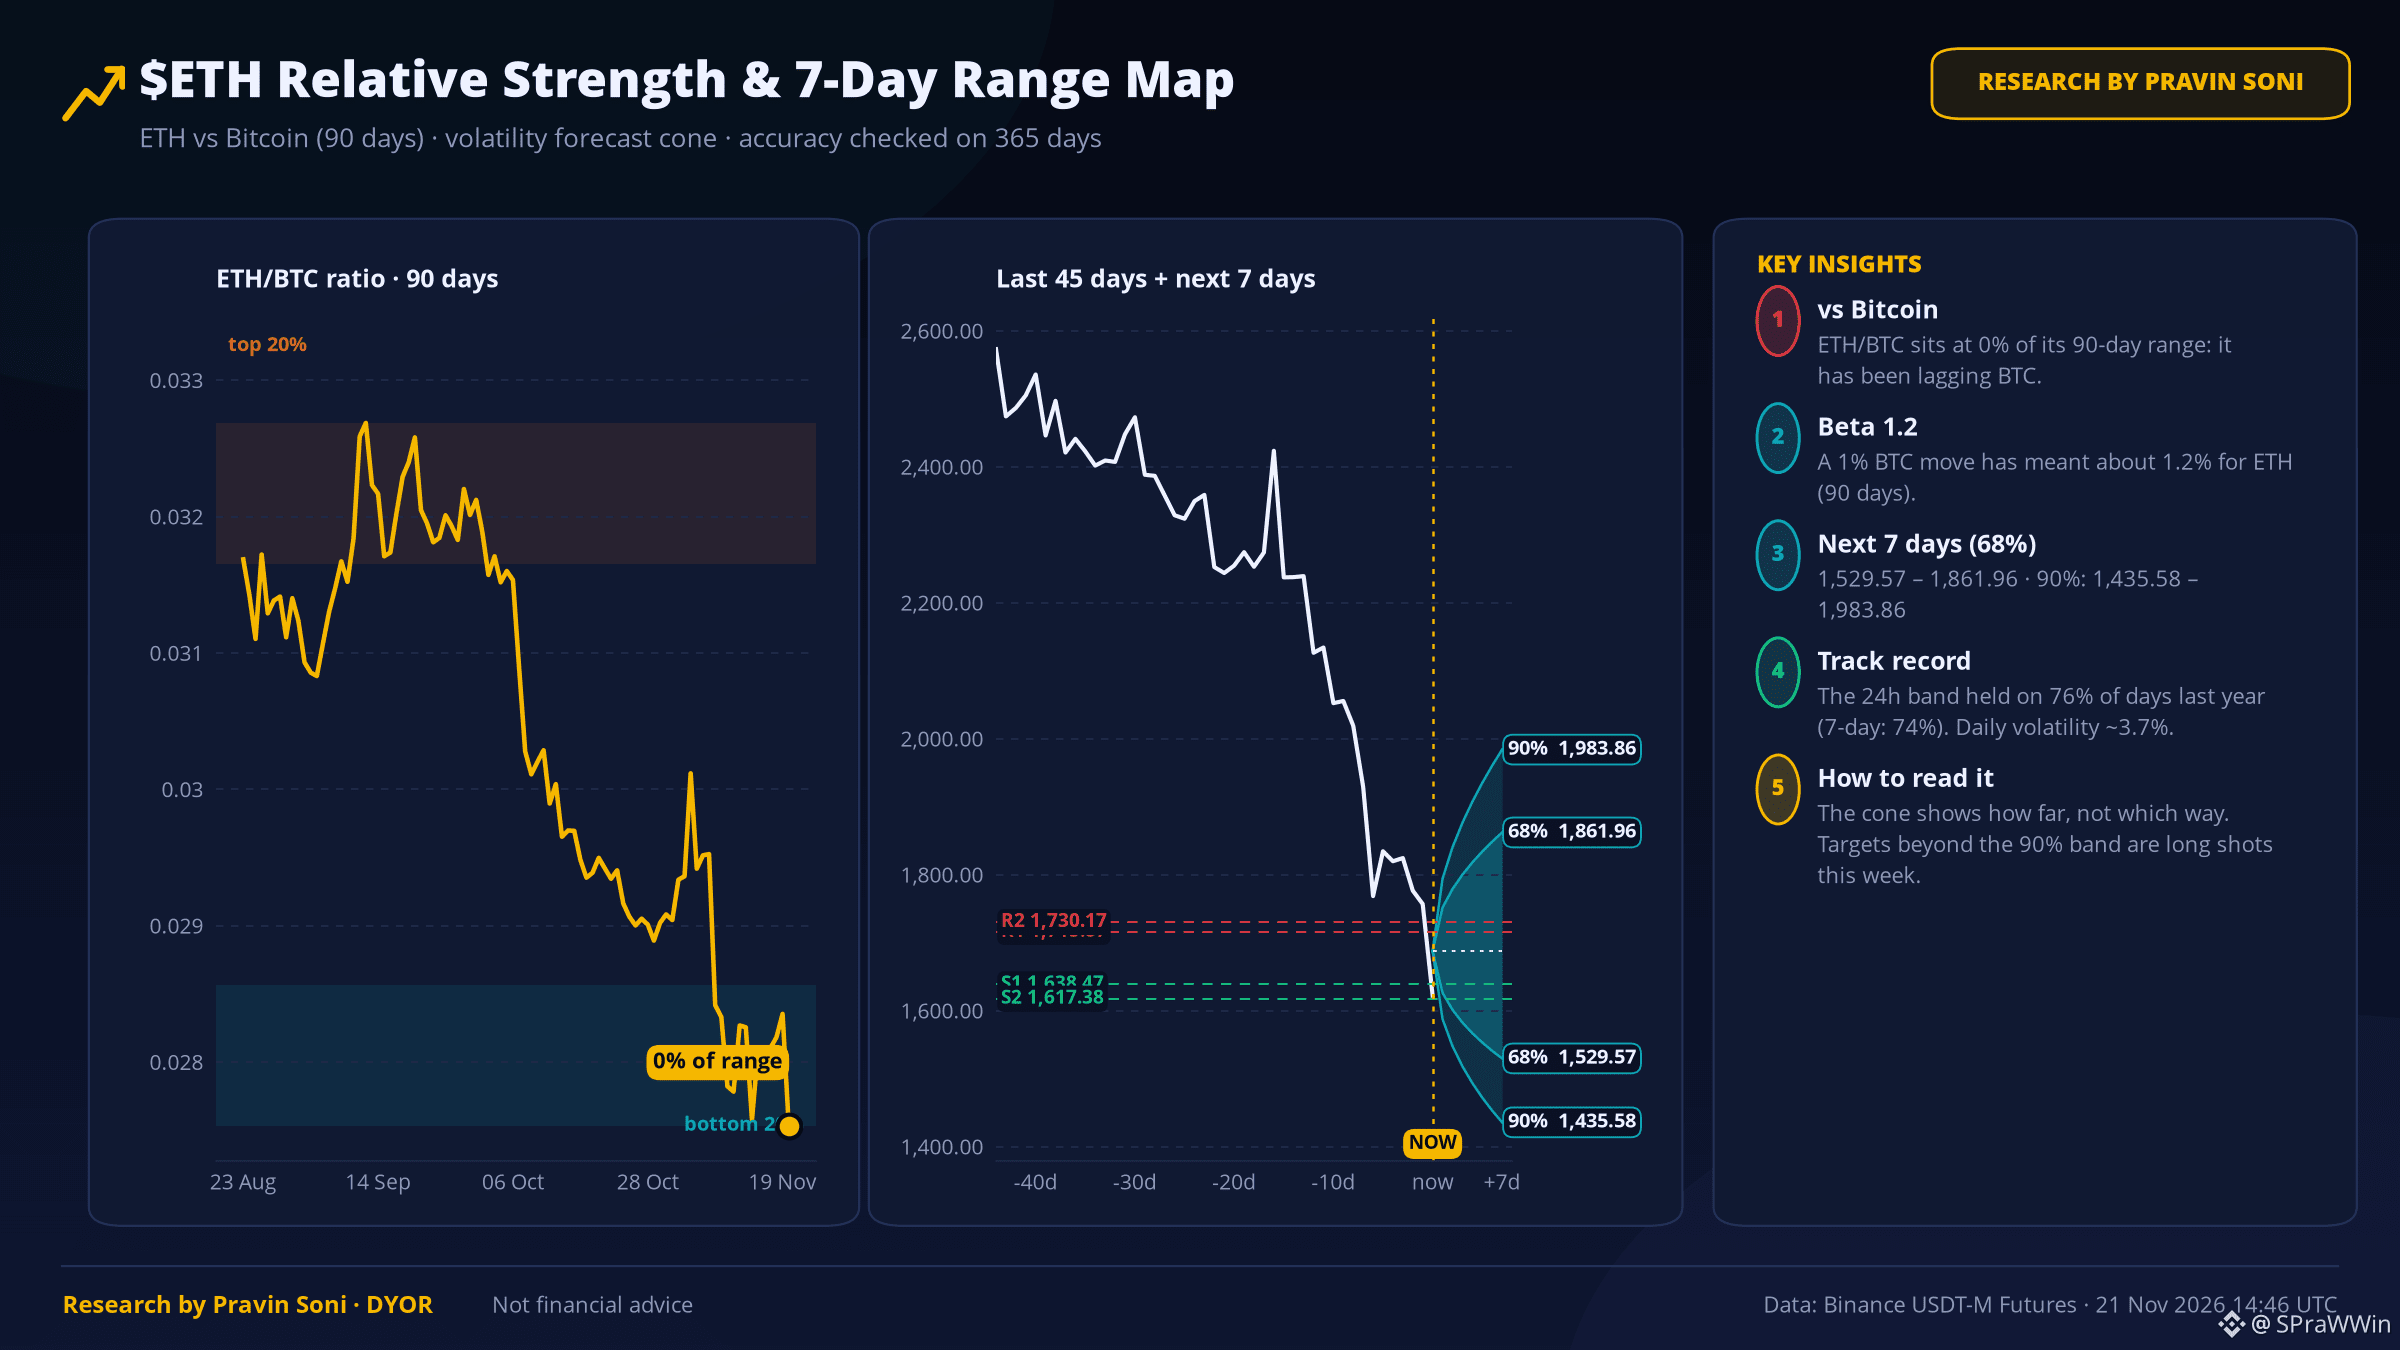
Key levels: support 1,638.47 / 1,617.38 · resistance 1,715.87 / 1,730.17
📏 7-day range (68%): 1,529.57 – 1,861.96. This band held on 76% of days last year.
💬 Would you take this trade, or wait for a better price?
Not financial advice · Data: Binance Futures
$ETH #ETH #TradingSetup #CryptoAnalysis
⚠️ Research by Pravin Soni - DYOR
$ETH SHORT Setup 🔴 Entry 1,712.30 · SL 1,726.59 · 4 Targets
TL;DR: short idea from 1,712.30, stop 1,726.59 (+0.8%), first target 1,638.47 (5.2R).
🧪 Research verdict: SHORT WITH THE MARKET - low edge, sell rallies only
✅ What supports it
1️⃣ Top traders more bearish than the crowd
2️⃣ Open interest -10% in 24h
3️⃣ Volume 2.3x its 30-day average
⚠️ Risk to the idea: RSI 19: oversold on the daily
🎯 The plan
⚡ Entry: 1,712.30 (limit, on a retest)
⛔ Stop-loss: 1,726.59 (+0.8%)
🎯 TP1: 1,638.47 (-4.3% · 5.2R) · ~2% touch in 3h
🎯 TP2: 1,627.75 (-4.9% · 5.9R) · ~1% touch in 3h
🎯 TP3: 1,617.03 (-5.6% · 6.7R) · ~0% touch in 3h
🎯 TP4: 1,606.30 (-6.2% · 7.4R) · ~0% touch in 3h
📐 Odds TP1 hits before the stop with no edge: 16%. That's why R:R must be ≥ 1.5.
🛠️ How I'd manage it
1) Limit order at entry, no chasing candles.
2) Stop goes in right after the fill and never gets widened.
3) Small partial at TP1, then trail the stop for TP2-TP4 (in our 2-year test, booking everything early cut the edge to ~0).
4) Risk ≤1% of capital, max 10x isolated.
❌ Invalid: daily close above 1,726.59
Key levels: support 1,638.47 / 1,617.38 · resistance 1,715.87 / 1,730.17
📏 7-day range (68%): 1,529.57 – 1,861.96. This band held on 76% of days last year.
💬 Would you take this trade, or wait for a better price?
Not financial advice · Data: Binance Futures
$ETH #ETH #TradingSetup #CryptoAnalysis
⚠️ Research by Pravin Soni - DYOR
TL;DR: short idea from 1,712.30, stop 1,726.59 (+0.8%), first target 1,638.47 (5.2R).
🧪 Research verdict: SHORT WITH THE MARKET - low edge, sell rallies only
✅ What supports it
1️⃣ Top traders more bearish than the crowd
2️⃣ Open interest -10% in 24h
3️⃣ Volume 2.3x its 30-day average
⚠️ Risk to the idea: RSI 19: oversold on the daily
🎯 The plan
⚡ Entry: 1,712.30 (limit, on a retest)
⛔ Stop-loss: 1,726.59 (+0.8%)
🎯 TP1: 1,638.47 (-4.3% · 5.2R) · ~2% touch in 3h
🎯 TP2: 1,627.75 (-4.9% · 5.9R) · ~1% touch in 3h
🎯 TP3: 1,617.03 (-5.6% · 6.7R) · ~0% touch in 3h
🎯 TP4: 1,606.30 (-6.2% · 7.4R) · ~0% touch in 3h
📐 Odds TP1 hits before the stop with no edge: 16%. That's why R:R must be ≥ 1.5.
🛠️ How I'd manage it
1) Limit order at entry, no chasing candles.
2) Stop goes in right after the fill and never gets widened.
3) Small partial at TP1, then trail the stop for TP2-TP4 (in our 2-year test, booking everything early cut the edge to ~0).
4) Risk ≤1% of capital, max 10x isolated.
❌ Invalid: daily close above 1,726.59
Key levels: support 1,638.47 / 1,617.38 · resistance 1,715.87 / 1,730.17
📏 7-day range (68%): 1,529.57 – 1,861.96. This band held on 76% of days last year.
💬 Would you take this trade, or wait for a better price?
Not financial advice · Data: Binance Futures
$ETH #ETH #TradingSetup #CryptoAnalysis
⚠️ Research by Pravin Soni - DYOR
108

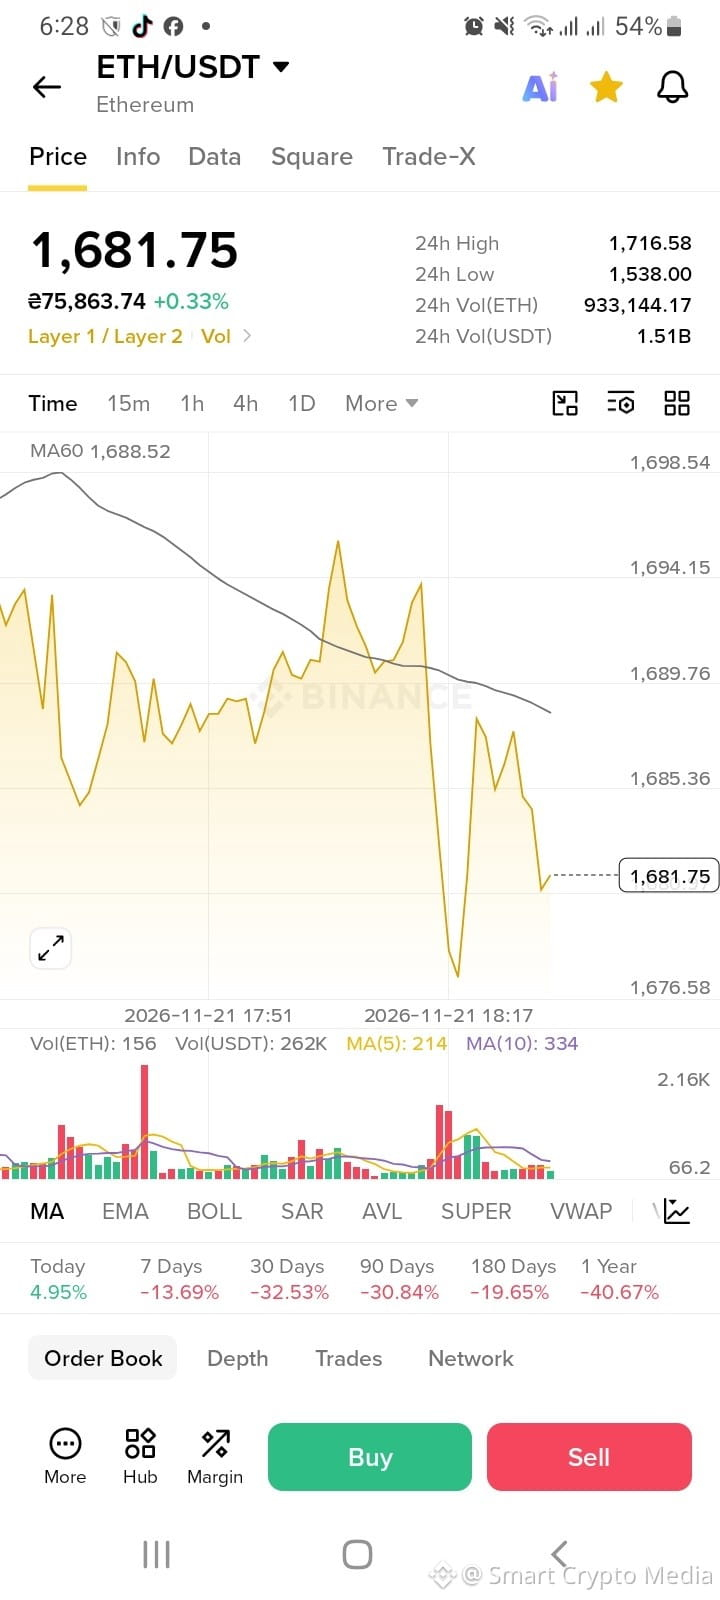
Honestly, the $ETH chart feels confusing at first glance.
The daily number is green. +0.33%.
Then I looked at the other numbers.
$1,681.75 price. The MA60 sits at $1,688.52. Seven-day performance is -13.69%, while the 30-day figure is -32.53%.
That's a very different mood from the small green number at the top.
I think this is where it's easy to become emotionally attached to the timeframe you're watching. If you're looking at the last few candles, a bounce can feel like a recovery.
Zoom out, and the damage becomes harder to ignore.
I'm not saying ETH can't recover. I just don't think this screenshot gives enough evidence to call a trend reversal yet.
Sometimes the most useful thing on a chart isn't the candle that looks exciting. It's the numbers that remind you to slow down.
When ETH makes these small rebounds after a heavy drop, do you watch the short timeframe or step back and zoom out?
#ETH #SmartCryptoMedia
Honestly, the $ETH chart feels confusing at first glance.
The daily number is green. +0.33%.
Then I looked at the other numbers.
$1,681.75 price. The MA60 sits at $1,688.52. Seven-day performance is -13.69%, while the 30-day figure is -32.53%.
That's a very different mood from the small green number at the top.
I think this is where it's easy to become emotionally attached to the timeframe you're watching. If you're looking at the last few candles, a bounce can feel like a recovery.
Zoom out, and the damage becomes harder to ignore.
I'm not saying ETH can't recover. I just don't think this screenshot gives enough evidence to call a trend reversal yet.
Sometimes the most useful thing on a chart isn't the candle that looks exciting. It's the numbers that remind you to slow down.
When ETH makes these small rebounds after a heavy drop, do you watch the short timeframe or step back and zoom out?
#ETH #SmartCryptoMedia
The daily number is green. +0.33%.
Then I looked at the other numbers.
$1,681.75 price. The MA60 sits at $1,688.52. Seven-day performance is -13.69%, while the 30-day figure is -32.53%.
That's a very different mood from the small green number at the top.
I think this is where it's easy to become emotionally attached to the timeframe you're watching. If you're looking at the last few candles, a bounce can feel like a recovery.
Zoom out, and the damage becomes harder to ignore.
I'm not saying ETH can't recover. I just don't think this screenshot gives enough evidence to call a trend reversal yet.
Sometimes the most useful thing on a chart isn't the candle that looks exciting. It's the numbers that remind you to slow down.
When ETH makes these small rebounds after a heavy drop, do you watch the short timeframe or step back and zoom out?
#ETH #SmartCryptoMedia
173

·
--
Bullish
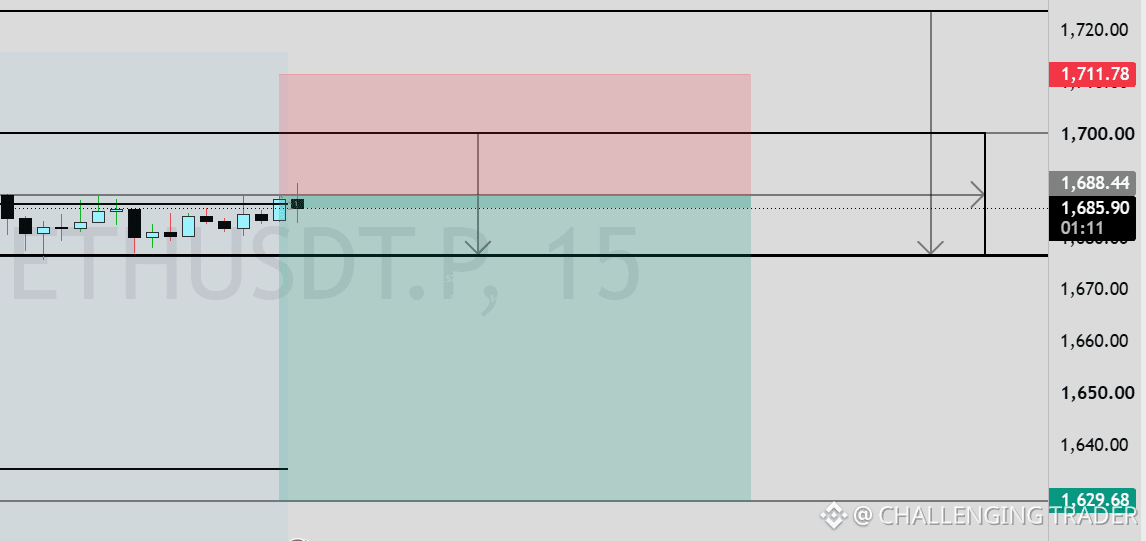
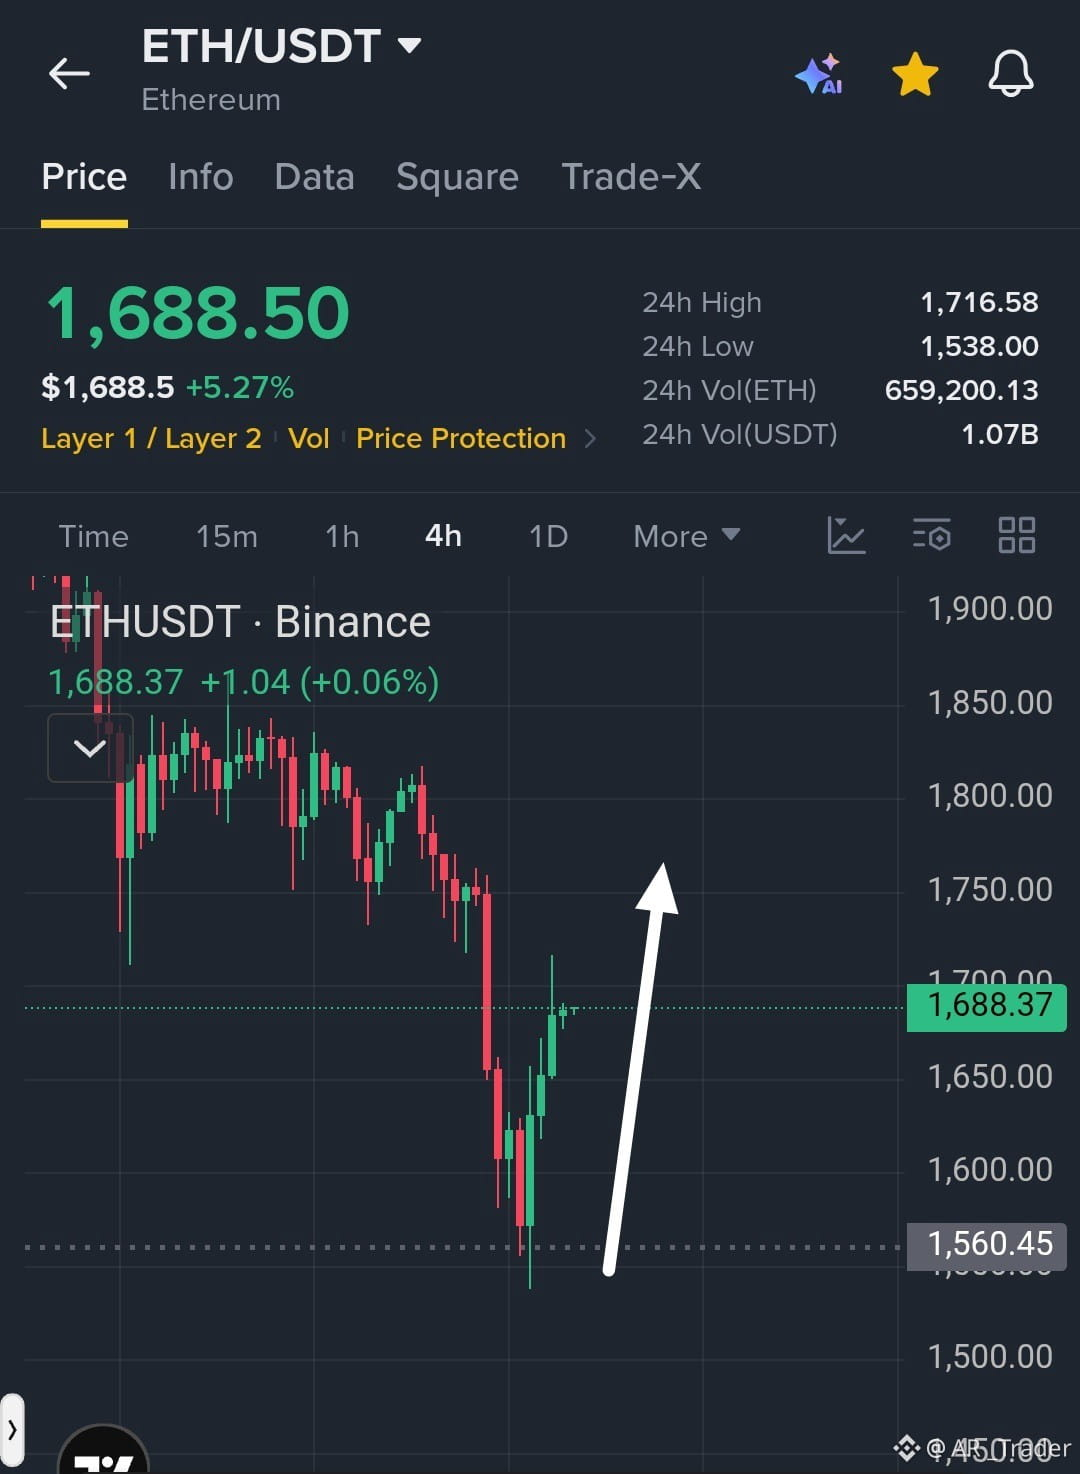
$ETH /USDT Rebounds Strongly From Support as Bulls Target a Recovery Toward $1,750
Trade Setup: LONG
Entry Zone: $1,680 – $1,690
TP1: $1,710
TP2: $1,735
TP3: $1,750
SL: $1,560
#ETH has staged a strong rebound from the $1,560 support zone, with consecutive bullish candles signaling renewed buying pressure. Holding above $1,680 could support further recovery toward the $1,750 resistance area.
Manage risk carefully and wait for confirmation before entering
{future}(ETHUSDT)
$ETC
{future}(ETCUSDT)
.$ENA
{future}(ENAUSDT)
$ETH /USDT Rebounds Strongly From Support as Bulls Target a Recovery Toward $1,750
Trade Setup: LONG
Entry Zone: $1,680 – $1,690
TP1: $1,710
TP2: $1,735
TP3: $1,750
SL: $1,560
#ETH has staged a strong rebound from the $1,560 support zone, with consecutive bullish candles signaling renewed buying pressure. Holding above $1,680 could support further recovery toward the $1,750 resistance area.
Manage risk carefully and wait for confirmation before entering
$ETC
.$ENA
Trade Setup: LONG
Entry Zone: $1,680 – $1,690
TP1: $1,710
TP2: $1,735
TP3: $1,750
SL: $1,560
#ETH has staged a strong rebound from the $1,560 support zone, with consecutive bullish candles signaling renewed buying pressure. Holding above $1,680 could support further recovery toward the $1,750 resistance area.
Manage risk carefully and wait for confirmation before entering
$ETC
.$ENA
2
31

SHARK $ETH WALLET WAKES AFTER ELEVEN YEARS TO EVADE SOPHISTICATED ADDRESS POISONING VECTORS 🦈⚡
When ancient capital mobilizes after more than a decade of dormancy, market participants watch closely. Recently, an early-era participant executed a test transfer before moving thousands of tokens, successfully bypassing a malicious address poisoning attempt designed to siphon funds via visual similarity. 🔍
Institutional-grade operational security requires verifying every single character of a destination string independently rather than relying on recent transaction history interfaces. A single oversight in routing can compromise an entire portfolio regardless of underlying cryptographic strength. 🛡️
💬 Are your security protocols robust enough to withstand automated dust-routing traps onchain? 👇
⚠️ Not financial advice. Always manage your risk. 🛡️
🏷️ #ETH #Ethereum #WalletSecurity #Crypto
🦈 🔒
SHARK $ETH WALLET WAKES AFTER ELEVEN YEARS TO EVADE SOPHISTICATED ADDRESS POISONING VECTORS 🦈⚡
When ancient capital mobilizes after more than a decade of dormancy, market participants watch closely. Recently, an early-era participant executed a test transfer before moving thousands of tokens, successfully bypassing a malicious address poisoning attempt designed to siphon funds via visual similarity. 🔍
Institutional-grade operational security requires verifying every single character of a destination string independently rather than relying on recent transaction history interfaces. A single oversight in routing can compromise an entire portfolio regardless of underlying cryptographic strength. 🛡️
💬 Are your security protocols robust enough to withstand automated dust-routing traps onchain? 👇
⚠️ Not financial advice. Always manage your risk. 🛡️
🏷️ #ETH #Ethereum #WalletSecurity #Crypto
🦈 🔒
When ancient capital mobilizes after more than a decade of dormancy, market participants watch closely. Recently, an early-era participant executed a test transfer before moving thousands of tokens, successfully bypassing a malicious address poisoning attempt designed to siphon funds via visual similarity. 🔍
Institutional-grade operational security requires verifying every single character of a destination string independently rather than relying on recent transaction history interfaces. A single oversight in routing can compromise an entire portfolio regardless of underlying cryptographic strength. 🛡️
💬 Are your security protocols robust enough to withstand automated dust-routing traps onchain? 👇
⚠️ Not financial advice. Always manage your risk. 🛡️
🏷️ #ETH #Ethereum #WalletSecurity #Crypto
🦈 🔒

9

·
--
📉 ETH 30-Day Breakdown: Bears in Full Control
Ethereum has dropped -30.8% over the past 30 days, sliding from $2,388 to $1,653 — a steeper decline than Bitcoin's -28.3% over the same period. ETH underperformed BTC, with the ETH/BTC ratio slipping -3.4% from 0.02941 to 0.02840.
📊 Technical Snapshot (Nov 21, 2026)
• Current Price: $1,653
• MA7: $1,756 → price trading well below short-term average
• MA25: $2,058 → heavy overhead resistance from the medium-term average
• 30-Day High: $2,450 | 30-Day Low: $1,538
🛡️ Key Levels to Watch
• Support zone: $1,538 – $1,711 (recent swing lows; Nov 14–15 wick cluster)
• Resistance zone: $1,936 – $2,066 (prior base, now flipped to resistance)
Price is currently bouncing from the $1,538 cycle low printed yesterday, but both MA7 and MA25 are sloping sharply downward — no golden cross in sight. A sustained reclaim of $1,756 (MA7) is the first hurdle for bulls. Until then, any rallies risk being sold into the declining moving averages.
ETH/BTC weakness adds to the bearish picture — altcoin season is not here yet. Watch for a confirmed daily close above $1,756 before considering any meaningful recovery thesis.
#Ethereum #ETH #CryptoTrading
📉 ETH 30-Day Breakdown: Bears in Full Control
Ethereum has dropped -30.8% over the past 30 days, sliding from $2,388 to $1,653 — a steeper decline than Bitcoin's -28.3% over the same period. ETH underperformed BTC, with the ETH/BTC ratio slipping -3.4% from 0.02941 to 0.02840.
📊 Technical Snapshot (Nov 21, 2026)
• Current Price: $1,653
• MA7: $1,756 → price trading well below short-term average
• MA25: $2,058 → heavy overhead resistance from the medium-term average
• 30-Day High: $2,450 | 30-Day Low: $1,538
🛡️ Key Levels to Watch
• Support zone: $1,538 – $1,711 (recent swing lows; Nov 14–15 wick cluster)
• Resistance zone: $1,936 – $2,066 (prior base, now flipped to resistance)
Price is currently bouncing from the $1,538 cycle low printed yesterday, but both MA7 and MA25 are sloping sharply downward — no golden cross in sight. A sustained reclaim of $1,756 (MA7) is the first hurdle for bulls. Until then, any rallies risk being sold into the declining moving averages.
ETH/BTC weakness adds to the bearish picture — altcoin season is not here yet. Watch for a confirmed daily close above $1,756 before considering any meaningful recovery thesis.
#Ethereum #ETH #CryptoTrading
Ethereum has dropped -30.8% over the past 30 days, sliding from $2,388 to $1,653 — a steeper decline than Bitcoin's -28.3% over the same period. ETH underperformed BTC, with the ETH/BTC ratio slipping -3.4% from 0.02941 to 0.02840.
📊 Technical Snapshot (Nov 21, 2026)
• Current Price: $1,653
• MA7: $1,756 → price trading well below short-term average
• MA25: $2,058 → heavy overhead resistance from the medium-term average
• 30-Day High: $2,450 | 30-Day Low: $1,538
🛡️ Key Levels to Watch
• Support zone: $1,538 – $1,711 (recent swing lows; Nov 14–15 wick cluster)
• Resistance zone: $1,936 – $2,066 (prior base, now flipped to resistance)
Price is currently bouncing from the $1,538 cycle low printed yesterday, but both MA7 and MA25 are sloping sharply downward — no golden cross in sight. A sustained reclaim of $1,756 (MA7) is the first hurdle for bulls. Until then, any rallies risk being sold into the declining moving averages.
ETH/BTC weakness adds to the bearish picture — altcoin season is not here yet. Watch for a confirmed daily close above $1,756 before considering any meaningful recovery thesis.
#Ethereum #ETH #CryptoTrading
1
105


·
--
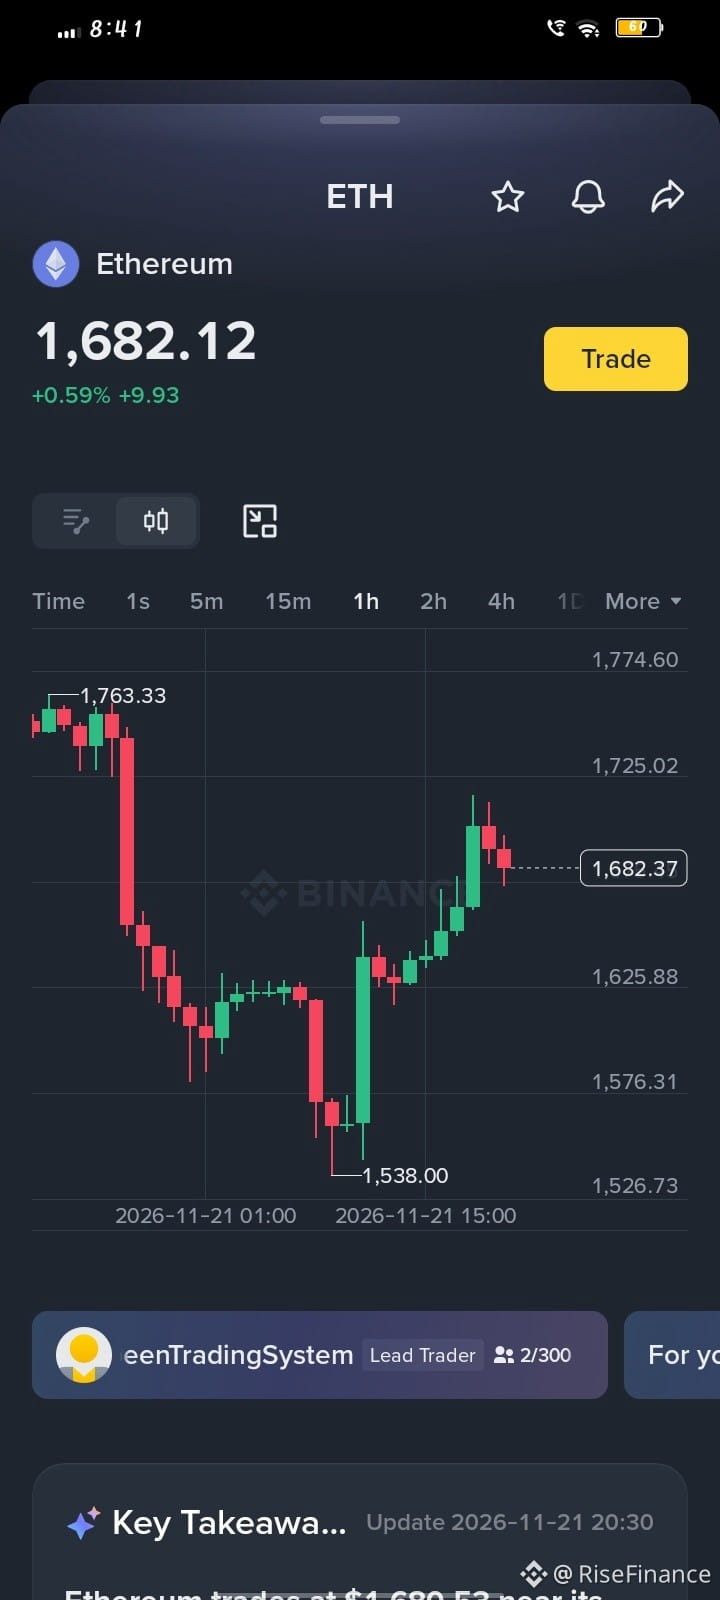
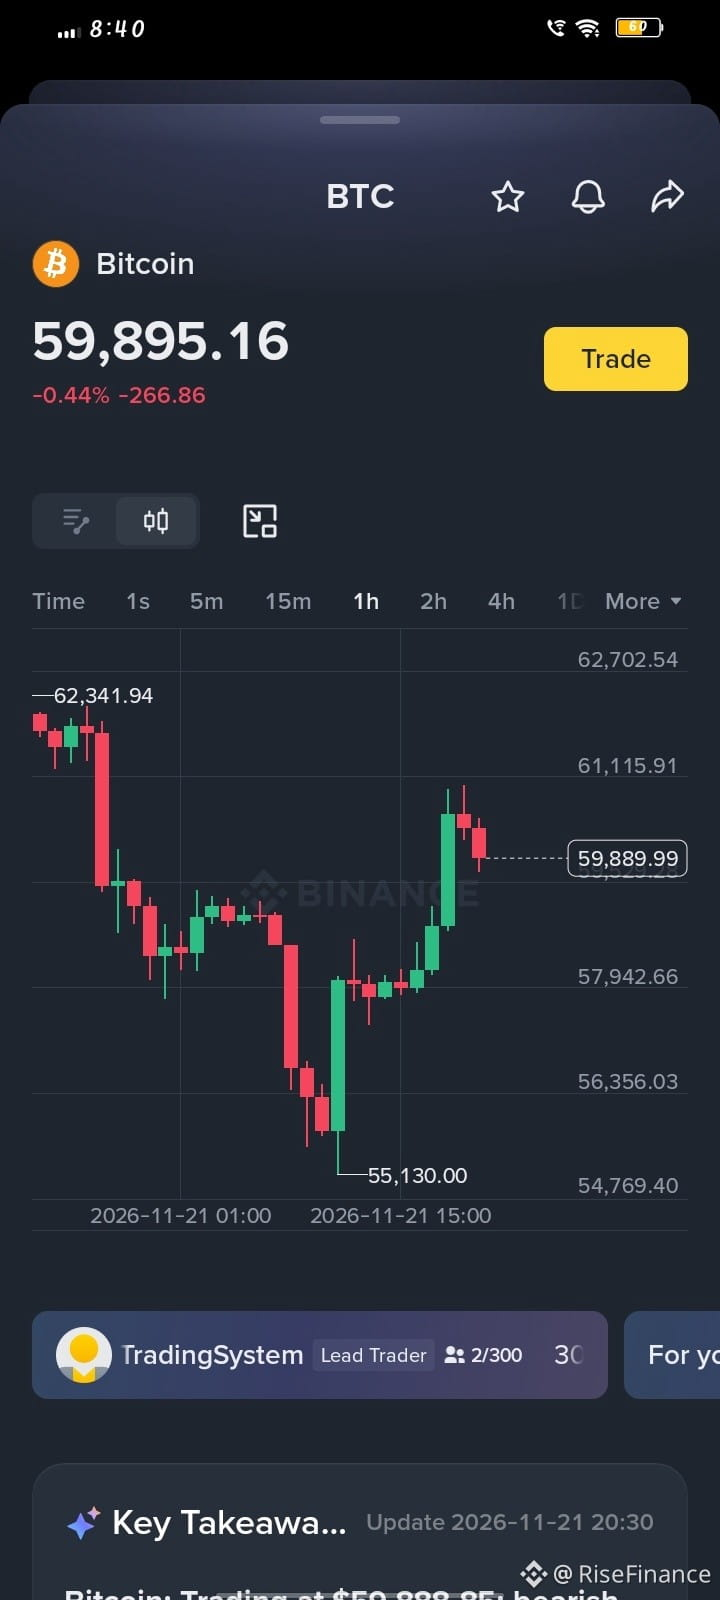
🚨 Market Update: Strong V-Shape Recovery on $BTC & $ETH ! 📊
Watching the 1H charts closely today. Both market leaders faced a sharp dip earlier, shaking out weak hands, before bouncing back aggressively from their intraday lows.
Here is what I am tracking right now:
🔸 $BTC (Bitcoin)
• Current Price: ~$59,895
• Key Support: $55,130 (Strong buyer defense seen here)
• Resistance to Watch: $61,115 – $62,340
• View: After a heavy drop, buyers stepped in cleanly. Holding above $59,500 keeps the short-term recovery structure intact.
🔹 ETH (Ethereum)
• Current Price: ~$1,682
• Key Support: $1,538
• Resistance to Watch: $1,725 – $1,763
• View: Showing slightly stronger momentum (+0.59%) compared to BTC. A clean break above $1,725 could open doors for a retest of the highs.
Volume is high and volatility is back in play—great conditions for disciplined setups, risky for over-leveraged trades.
💬 What’s your move here? Are you buying this recovery bounce or waiting for a deeper retest? Drop your thoughts below! 👇
⚠️ Disclaimer: Not financial advice. Always Do Your Own Research (DYOR) and manage your risk properly before trading.
#BTC #ETH #XRPDropsToTwoYearLowNear87Cents #CanBTCReboundAfterFallingBelow60K? #BinanceSquare
{spot}(BTCUSDT)
{spot}(ETHUSDT)
🚨 Market Update: Strong V-Shape Recovery on $BTC & $ETH ! 📊
Watching the 1H charts closely today. Both market leaders faced a sharp dip earlier, shaking out weak hands, before bouncing back aggressively from their intraday lows.
Here is what I am tracking right now:
🔸 $BTC (Bitcoin)
• Current Price: ~$59,895
• Key Support: $55,130 (Strong buyer defense seen here)
• Resistance to Watch: $61,115 – $62,340
• View: After a heavy drop, buyers stepped in cleanly. Holding above $59,500 keeps the short-term recovery structure intact.
🔹 ETH (Ethereum)
• Current Price: ~$1,682
• Key Support: $1,538
• Resistance to Watch: $1,725 – $1,763
• View: Showing slightly stronger momentum (+0.59%) compared to BTC. A clean break above $1,725 could open doors for a retest of the highs.
Volume is high and volatility is back in play—great conditions for disciplined setups, risky for over-leveraged trades.
💬 What’s your move here? Are you buying this recovery bounce or waiting for a deeper retest? Drop your thoughts below! 👇
⚠️ Disclaimer: Not financial advice. Always Do Your Own Research (DYOR) and manage your risk properly before trading.
#BTC #ETH #XRPDropsToTwoYearLowNear87Cents #CanBTCReboundAfterFallingBelow60K? #BinanceSquare
Watching the 1H charts closely today. Both market leaders faced a sharp dip earlier, shaking out weak hands, before bouncing back aggressively from their intraday lows.
Here is what I am tracking right now:
🔸 $BTC (Bitcoin)
• Current Price: ~$59,895
• Key Support: $55,130 (Strong buyer defense seen here)
• Resistance to Watch: $61,115 – $62,340
• View: After a heavy drop, buyers stepped in cleanly. Holding above $59,500 keeps the short-term recovery structure intact.
🔹 ETH (Ethereum)
• Current Price: ~$1,682
• Key Support: $1,538
• Resistance to Watch: $1,725 – $1,763
• View: Showing slightly stronger momentum (+0.59%) compared to BTC. A clean break above $1,725 could open doors for a retest of the highs.
Volume is high and volatility is back in play—great conditions for disciplined setups, risky for over-leveraged trades.
💬 What’s your move here? Are you buying this recovery bounce or waiting for a deeper retest? Drop your thoughts below! 👇
⚠️ Disclaimer: Not financial advice. Always Do Your Own Research (DYOR) and manage your risk properly before trading.
#BTC #ETH #XRPDropsToTwoYearLowNear87Cents #CanBTCReboundAfterFallingBelow60K? #BinanceSquare
1
99

·
--
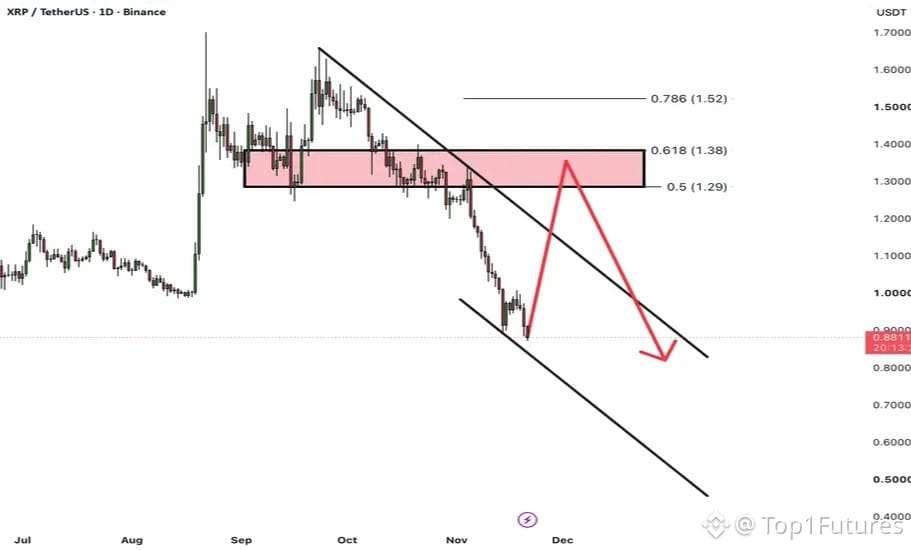
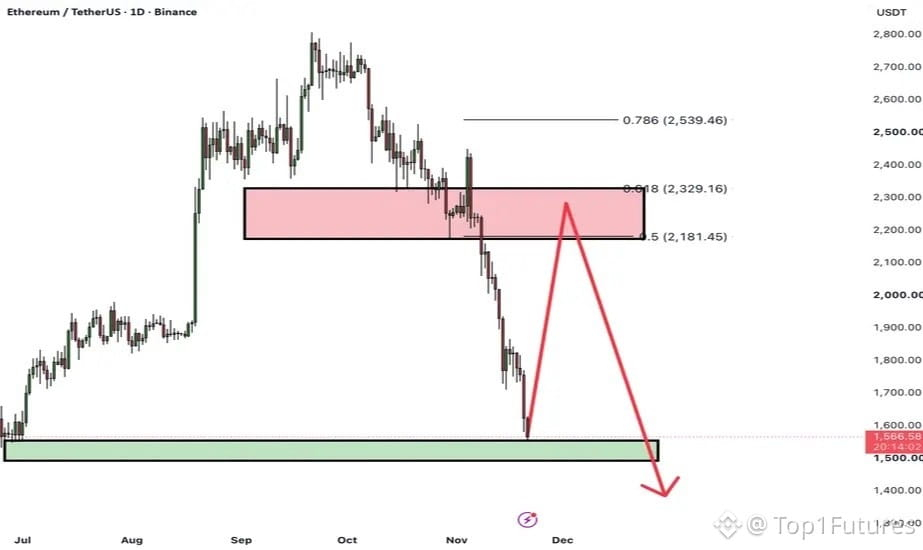
Both $XRP and $ETH are showing serious weakness, but interestingly, a temporary recovery could happen before another major move down.
#XRP : Currently trading around $0.88, XRP is still moving inside a descending channel. I think we could see a relief rally towards $1.28–$1.38. This is a major resistance area where sellers may come back again. If price gets rejected there, $0.82 could be the next downside target. 📉
#ETH : Ethereum is also looking weak near $1,550. But a bounce towards $2,150–$2,350 is still possible. This zone could become a big selling opportunity if buyers fail to break through.
If ETH faces rejection, we might see another drop towards $1,500 and possibly $1,400.
But there is one important thing! If ETH manages to close above $2,350 on the daily timeframe, this bearish prediction could become invalid, and $2,550 may come into the picture.
For now, both charts are showing a similar story.
A relief rally first, then possibly another round of selling pressure.
Of course, these are possible scenarios, not guaranteed moves.
Are we getting a temporary bounce before the next crash? Or is this where the real recovery begins? 🤔
Both $XRP and $ETH are showing serious weakness, but interestingly, a temporary recovery could happen before another major move down.
#XRP : Currently trading around $0.88, XRP is still moving inside a descending channel. I think we could see a relief rally towards $1.28–$1.38. This is a major resistance area where sellers may come back again. If price gets rejected there, $0.82 could be the next downside target. 📉
#ETH : Ethereum is also looking weak near $1,550. But a bounce towards $2,150–$2,350 is still possible. This zone could become a big selling opportunity if buyers fail to break through.
If ETH faces rejection, we might see another drop towards $1,500 and possibly $1,400.
But there is one important thing! If ETH manages to close above $2,350 on the daily timeframe, this bearish prediction could become invalid, and $2,550 may come into the picture.
For now, both charts are showing a similar story.
A relief rally first, then possibly another round of selling pressure.
Of course, these are possible scenarios, not guaranteed moves.
Are we getting a temporary bounce before the next crash? Or is this where the real recovery begins? 🤔
#XRP : Currently trading around $0.88, XRP is still moving inside a descending channel. I think we could see a relief rally towards $1.28–$1.38. This is a major resistance area where sellers may come back again. If price gets rejected there, $0.82 could be the next downside target. 📉
#ETH : Ethereum is also looking weak near $1,550. But a bounce towards $2,150–$2,350 is still possible. This zone could become a big selling opportunity if buyers fail to break through.
If ETH faces rejection, we might see another drop towards $1,500 and possibly $1,400.
But there is one important thing! If ETH manages to close above $2,350 on the daily timeframe, this bearish prediction could become invalid, and $2,550 may come into the picture.
For now, both charts are showing a similar story.
A relief rally first, then possibly another round of selling pressure.
Of course, these are possible scenarios, not guaranteed moves.
Are we getting a temporary bounce before the next crash? Or is this where the real recovery begins? 🤔
1
326

·
--
Bearish
🚀 ETHEREUM (ETH) – COIN INFORMATION & LATEST MARKET UPDATE 📊
$ETH
🪙 Coin Name: Ethereum
🔹 Symbol: ETH
🌐 Blockchain: Ethereum Network
📅 Date: November 21, 2026
🔍 5 Important Facts About Ethereum
1️⃣ Smart Contracts: Ethereum allows developers to create and run smart contracts.
2️⃣ Decentralized Apps: It supports thousands of decentralized applications (dApps).
3️⃣ DeFi Ecosystem: Ethereum plays a major role in decentralized finance.
4️⃣ NFT Support: Ethereum is widely used for creating and trading NFTs.
5️⃣ Proof of Stake: Ethereum uses a Proof-of-Stake consensus mechanism.
📉 LATEST MARKET UPDATE
Ethereum recently dropped below $1,600 USDT, showing significant selling pressure in the crypto market.
Market volatility, investor sentiment, and broader economic conditions may influence its next move.
💬 COMMUNITY QUESTION
What do you think about Ethereum's future?
🚀 BULLISH or 🐻 BEARISH?
Share your thoughts in the comments!
⚠️ Disclaimer: Educational content only. Not financial advice.
#Ethereum #ETH #BinanceSquareFamily #CryptoNews #blockchain
🚀 ETHEREUM (ETH) – COIN INFORMATION & LATEST MARKET UPDATE 📊
$ETH
🪙 Coin Name: Ethereum
🔹 Symbol: ETH
🌐 Blockchain: Ethereum Network
📅 Date: November 21, 2026
🔍 5 Important Facts About Ethereum
1️⃣ Smart Contracts: Ethereum allows developers to create and run smart contracts.
2️⃣ Decentralized Apps: It supports thousands of decentralized applications (dApps).
3️⃣ DeFi Ecosystem: Ethereum plays a major role in decentralized finance.
4️⃣ NFT Support: Ethereum is widely used for creating and trading NFTs.
5️⃣ Proof of Stake: Ethereum uses a Proof-of-Stake consensus mechanism.
📉 LATEST MARKET UPDATE
Ethereum recently dropped below $1,600 USDT, showing significant selling pressure in the crypto market.
Market volatility, investor sentiment, and broader economic conditions may influence its next move.
💬 COMMUNITY QUESTION
What do you think about Ethereum's future?
🚀 BULLISH or 🐻 BEARISH?
Share your thoughts in the comments!
⚠️ Disclaimer: Educational content only. Not financial advice.
#Ethereum #ETH #BinanceSquareFamily #CryptoNews #blockchain
$ETH
🪙 Coin Name: Ethereum
🔹 Symbol: ETH
🌐 Blockchain: Ethereum Network
📅 Date: November 21, 2026
🔍 5 Important Facts About Ethereum
1️⃣ Smart Contracts: Ethereum allows developers to create and run smart contracts.
2️⃣ Decentralized Apps: It supports thousands of decentralized applications (dApps).
3️⃣ DeFi Ecosystem: Ethereum plays a major role in decentralized finance.
4️⃣ NFT Support: Ethereum is widely used for creating and trading NFTs.
5️⃣ Proof of Stake: Ethereum uses a Proof-of-Stake consensus mechanism.
📉 LATEST MARKET UPDATE
Ethereum recently dropped below $1,600 USDT, showing significant selling pressure in the crypto market.
Market volatility, investor sentiment, and broader economic conditions may influence its next move.
💬 COMMUNITY QUESTION
What do you think about Ethereum's future?
🚀 BULLISH or 🐻 BEARISH?
Share your thoughts in the comments!
⚠️ Disclaimer: Educational content only. Not financial advice.
#Ethereum #ETH #BinanceSquareFamily #CryptoNews #blockchain

81

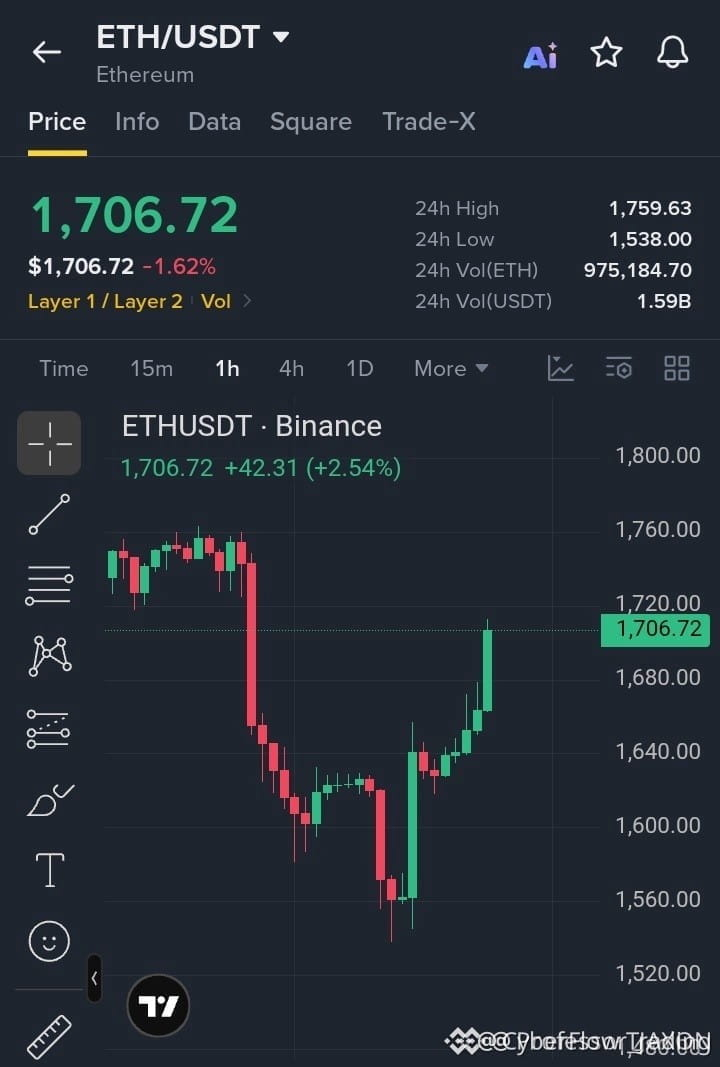
🚀 $ETH VAPORIZING RESISTANCE AS BULLS RECLAIM THE MOMENTUM BATTLEFIELD! 💥
Entry: 1,695 - 1,710 ⚡
Target: 1,760 🚀
Stop Loss: 1,675 ⚠️
Buyers have stepped in with serious conviction after wiping the floor clean at the 1,540 support shelf. Momentum is shifting fast as order flow tilts heavily in favor of the bulls. 📊
Price is currently compressing right beneath overhead resistance, setting up a coiled spring dynamic. If buyers manage a clean reclaim above the 1,720 pivot, expect velocity to accelerate rapidly toward our primary target. ⚡
💬 Are you positioning ahead of the breakout or waiting for a confirmed close above resistance? 👇
⚠️ Not financial advice. Always manage your risk. 🛡️
🏷️ #ETH #Breakout #Crypto #LongSetup
🔥 💎
🚀 $ETH VAPORIZING RESISTANCE AS BULLS RECLAIM THE MOMENTUM BATTLEFIELD! 💥
Entry: 1,695 - 1,710 ⚡
Target: 1,760 🚀
Stop Loss: 1,675 ⚠️
Buyers have stepped in with serious conviction after wiping the floor clean at the 1,540 support shelf. Momentum is shifting fast as order flow tilts heavily in favor of the bulls. 📊
Price is currently compressing right beneath overhead resistance, setting up a coiled spring dynamic. If buyers manage a clean reclaim above the 1,720 pivot, expect velocity to accelerate rapidly toward our primary target. ⚡
💬 Are you positioning ahead of the breakout or waiting for a confirmed close above resistance? 👇
⚠️ Not financial advice. Always manage your risk. 🛡️
🏷️ #ETH #Breakout #Crypto #LongSetup
🔥 💎
Entry: 1,695 - 1,710 ⚡
Target: 1,760 🚀
Stop Loss: 1,675 ⚠️
Buyers have stepped in with serious conviction after wiping the floor clean at the 1,540 support shelf. Momentum is shifting fast as order flow tilts heavily in favor of the bulls. 📊
Price is currently compressing right beneath overhead resistance, setting up a coiled spring dynamic. If buyers manage a clean reclaim above the 1,720 pivot, expect velocity to accelerate rapidly toward our primary target. ⚡
💬 Are you positioning ahead of the breakout or waiting for a confirmed close above resistance? 👇
⚠️ Not financial advice. Always manage your risk. 🛡️
🏷️ #ETH #Breakout #Crypto #LongSetup
🔥 💎
15

·
--
Bullish
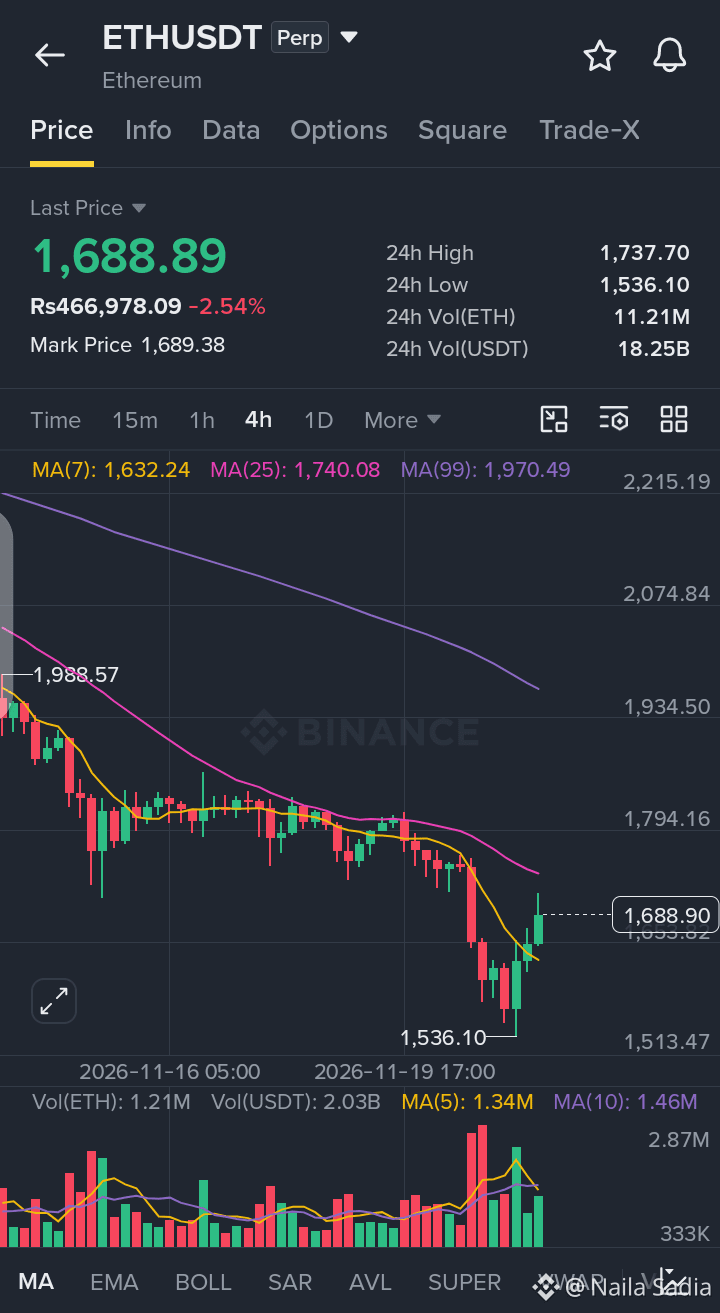
🚨 ETH BOUNCING OFF $1,536! CAN BUYERS RECLAIM $1,740 RESISTANCE?
$ETH is trading near $1,688.89, down 2.54%. The 4H chart shows a recovery bounce off the $1,536.10 low, pushing above MA(7) ($1,632.24) while facing overhead resistance near MA(25) ($1,740.08) and MA(99) ($1,970.49).
📉 Market Outlook: Short-term recovery momentum is active above MA(7), though broader 4H structure remains under overhead moving-average pressure.
A sustained break above $1,737.70–$1,740.08 could extend the bounce higher, while dropping back below $1,632.24 may invite renewed selling pressure toward $1,536.10.
🎯 TRADE PLAN – LONG
Entry: $1,645.00–$1,690.00
TP1: $1,738.00
TP2: $1,795.00
SL: $1,595.00
💬 Will $ETH push toward $1,740 resistance or pull back toward $1,632?
👇 CLICK HERE FOR TRADE
$ETH
{future}(ETHUSDT)
#ETH #Ethereum #CryptoAnalysis #BinanceSquare
🚨 ETH BOUNCING OFF $1,536! CAN BUYERS RECLAIM $1,740 RESISTANCE?
$ETH is trading near $1,688.89, down 2.54%. The 4H chart shows a recovery bounce off the $1,536.10 low, pushing above MA(7) ($1,632.24) while facing overhead resistance near MA(25) ($1,740.08) and MA(99) ($1,970.49).
📉 Market Outlook: Short-term recovery momentum is active above MA(7), though broader 4H structure remains under overhead moving-average pressure.
A sustained break above $1,737.70–$1,740.08 could extend the bounce higher, while dropping back below $1,632.24 may invite renewed selling pressure toward $1,536.10.
🎯 TRADE PLAN – LONG
Entry: $1,645.00–$1,690.00
TP1: $1,738.00
TP2: $1,795.00
SL: $1,595.00
💬 Will $ETH push toward $1,740 resistance or pull back toward $1,632?
👇 CLICK HERE FOR TRADE
$ETH
#ETH #Ethereum #CryptoAnalysis #BinanceSquare
$ETH is trading near $1,688.89, down 2.54%. The 4H chart shows a recovery bounce off the $1,536.10 low, pushing above MA(7) ($1,632.24) while facing overhead resistance near MA(25) ($1,740.08) and MA(99) ($1,970.49).
📉 Market Outlook: Short-term recovery momentum is active above MA(7), though broader 4H structure remains under overhead moving-average pressure.
A sustained break above $1,737.70–$1,740.08 could extend the bounce higher, while dropping back below $1,632.24 may invite renewed selling pressure toward $1,536.10.
🎯 TRADE PLAN – LONG
Entry: $1,645.00–$1,690.00
TP1: $1,738.00
TP2: $1,795.00
SL: $1,595.00
💬 Will $ETH push toward $1,740 resistance or pull back toward $1,632?
👇 CLICK HERE FOR TRADE
$ETH
#ETH #Ethereum #CryptoAnalysis #BinanceSquare
89
Log in to explore more content
Join global crypto users on Binance Square
⚡️ Get latest and useful information about crypto.
💬 Trusted by the world’s largest crypto exchange.
👍 Discover real insights from verified creators.
Email / Phone number
Trending Topics
1
#NvidiaLoses$2.7TrillionInMonthAndAHalf
18,385 views
116 Discussing
2
#CanBTCReboundAfterFallingBelow60K?
754,532 views
2,962 Discussing
3
#GlobalStocksFaceLongestLosingStreakSince2023
273,897 views
1,981 Discussing
4
#BlackRockIBITPostsRecord$541MSingleDayOutflow
32,265 views
88 Discussing
5
#AnthropicPlungesTowardIPOPriceonDay2
139,854 views
1,206 Discussing
6
#TwentyOneCapitalAdds172.25BTC
64,345 views
658 Discussing
7
#HKBillWouldExcludeTokenizedDepositsFromVirtualAssets
8,097 views
50 Discussing
8
#BNBDropsBelow540USDTWith8.46%DailyDecline
76,509 views
649 Discussing
9
#HKBillProposesHK$100KFineForUnauthorizedCryptoTitles
2,555 views
22 Discussing
10
#BitMineFaces$10.1BUnrealizedETHLoss
5,386 views
28 Discussing