
#marketanalysis
marketanalysis
10.8M views
70,948 Discussing
Hot
Latest

·
--
Here is what happened when retail traders tried to front-run institutional support on $XRP, only to watch the floor completely give way.
Most investors do not lose money on the initial correction, but by buying what feels like a bargain right before smart money heads for the exit. That impulse quickly turns an aggressive entry into months of holding an underwater position.
When $XRP broke down toward the $0.87 level, it marked an abrupt 9% drop in a single day and deepened its weekly drawdown to roughly 11.5%. While many traders blamed broader market weakness alongside $BTC, the real issue was a structural shift in liquidity that few were tracking.
The warning sign came directly from institutional desks, with US spot products logging around $4.97 million in net outflows right before the slide. When institutional vehicles start draining capital instead of absorbing market sell orders, order books thin out and amplify the downside. Stepping in front of active fund outflows to catch a falling knife usually ends the same way.
Do you see this as a temporary liquidity flush, or is there more downside ahead?
#XRP #CryptoTrading #MarketAnalysis
Here is what happened when retail traders tried to front-run institutional support on $XRP , only to watch the floor completely give way.
Most investors do not lose money on the initial correction, but by buying what feels like a bargain right before smart money heads for the exit. That impulse quickly turns an aggressive entry into months of holding an underwater position.
When $XRP broke down toward the $0.87 level, it marked an abrupt 9% drop in a single day and deepened its weekly drawdown to roughly 11.5%. While many traders blamed broader market weakness alongside $BTC , the real issue was a structural shift in liquidity that few were tracking.
The warning sign came directly from institutional desks, with US spot products logging around $4.97 million in net outflows right before the slide. When institutional vehicles start draining capital instead of absorbing market sell orders, order books thin out and amplify the downside. Stepping in front of active fund outflows to catch a falling knife usually ends the same way.
Do you see this as a temporary liquidity flush, or is there more downside ahead?
#XRP #CryptoTrading #MarketAnalysis
Most investors do not lose money on the initial correction, but by buying what feels like a bargain right before smart money heads for the exit. That impulse quickly turns an aggressive entry into months of holding an underwater position.
When $XRP broke down toward the $0.87 level, it marked an abrupt 9% drop in a single day and deepened its weekly drawdown to roughly 11.5%. While many traders blamed broader market weakness alongside $BTC , the real issue was a structural shift in liquidity that few were tracking.
The warning sign came directly from institutional desks, with US spot products logging around $4.97 million in net outflows right before the slide. When institutional vehicles start draining capital instead of absorbing market sell orders, order books thin out and amplify the downside. Stepping in front of active fund outflows to catch a falling knife usually ends the same way.
Do you see this as a temporary liquidity flush, or is there more downside ahead?
#XRP #CryptoTrading #MarketAnalysis

68

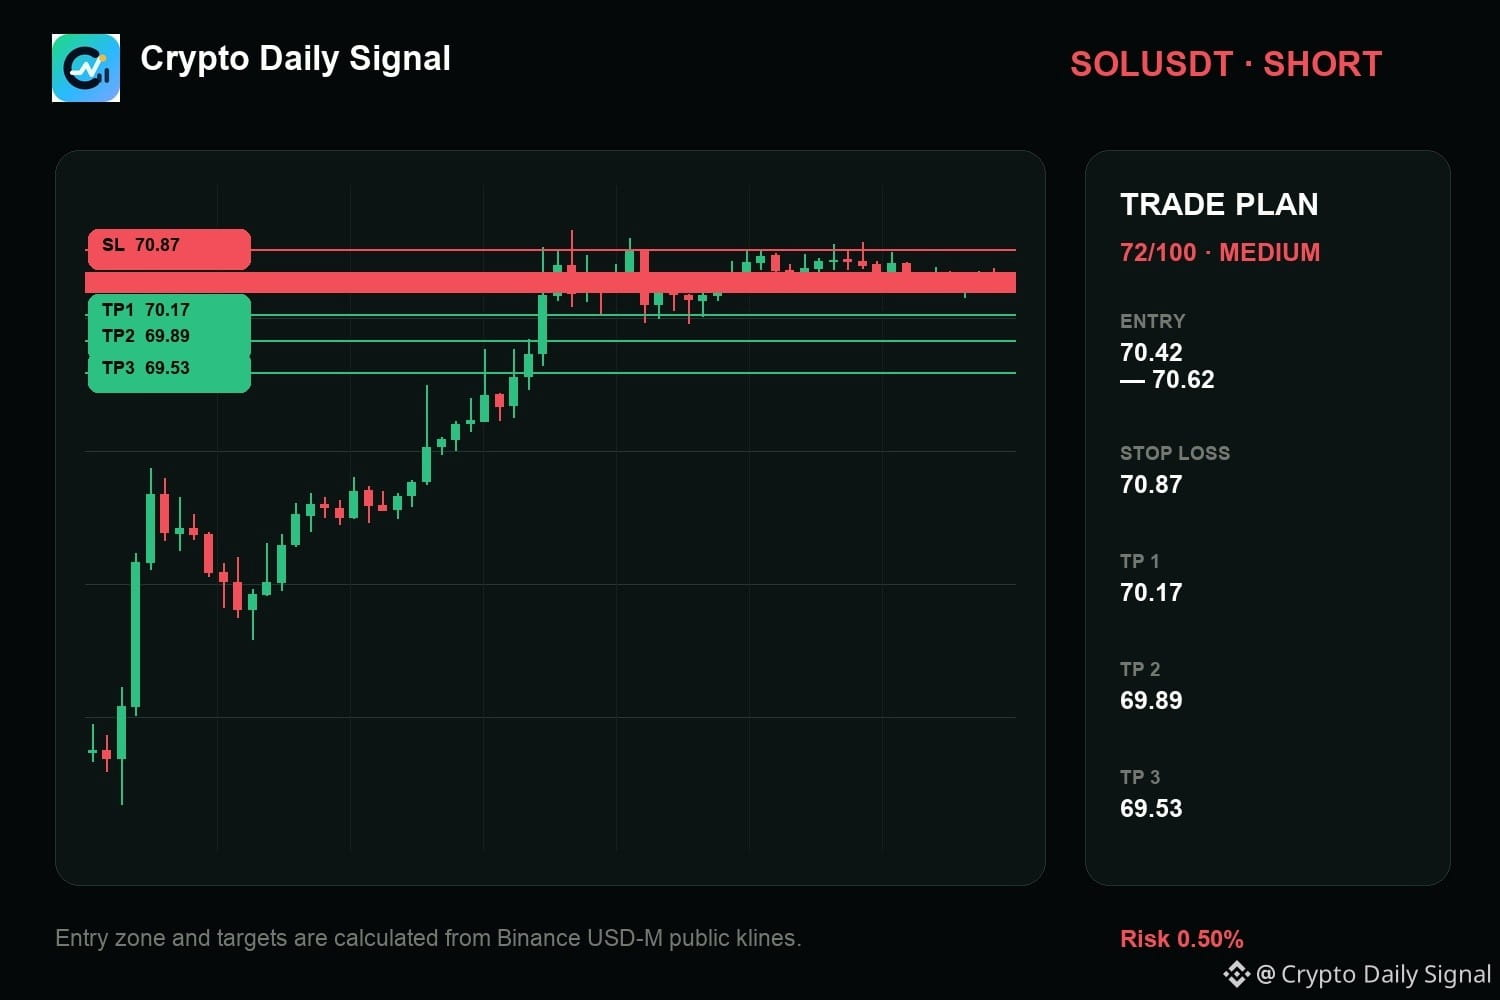
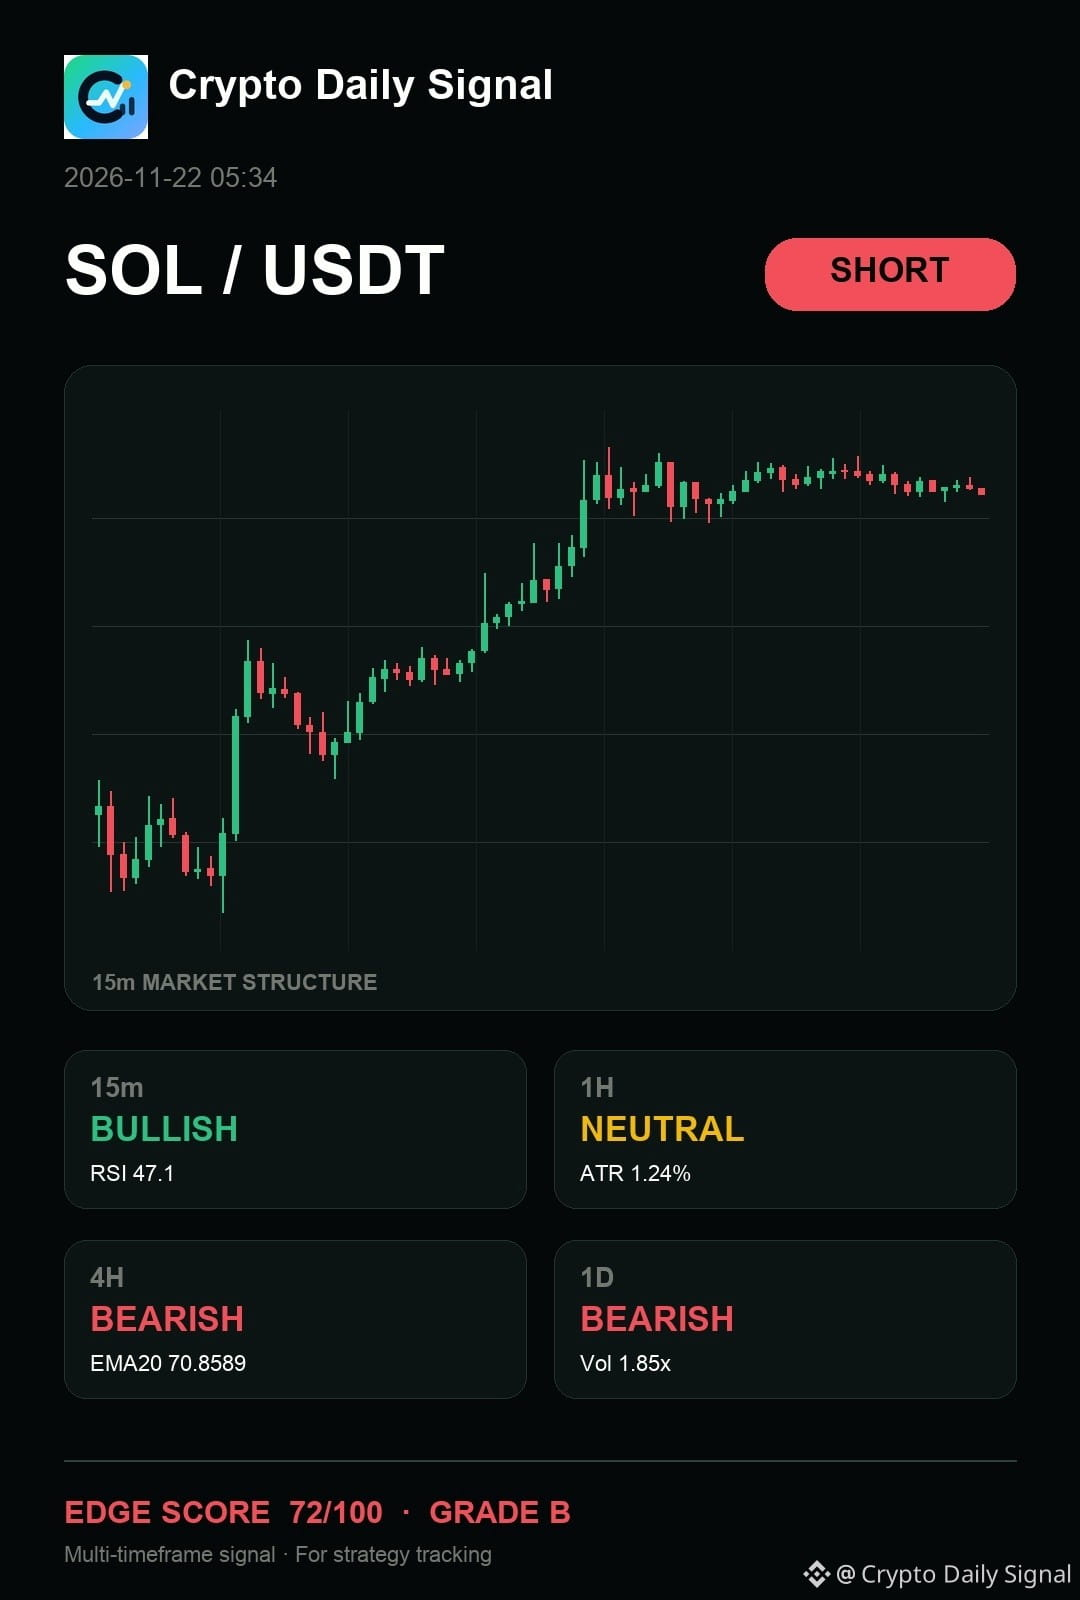
$SOL — right now, I would say it still gives sellers the cleaner argument as the momentum seems to be stalling inside a defined, tight range. The recent upper wick signals supply is stepping in at short-term resistance, which aligns with the bearish bias from the daily and four-hour charts. For this to become stronger on the short side, we'd need a close below the range bottom on bearish volume.
The map is useful only while the invalidation remains intact.
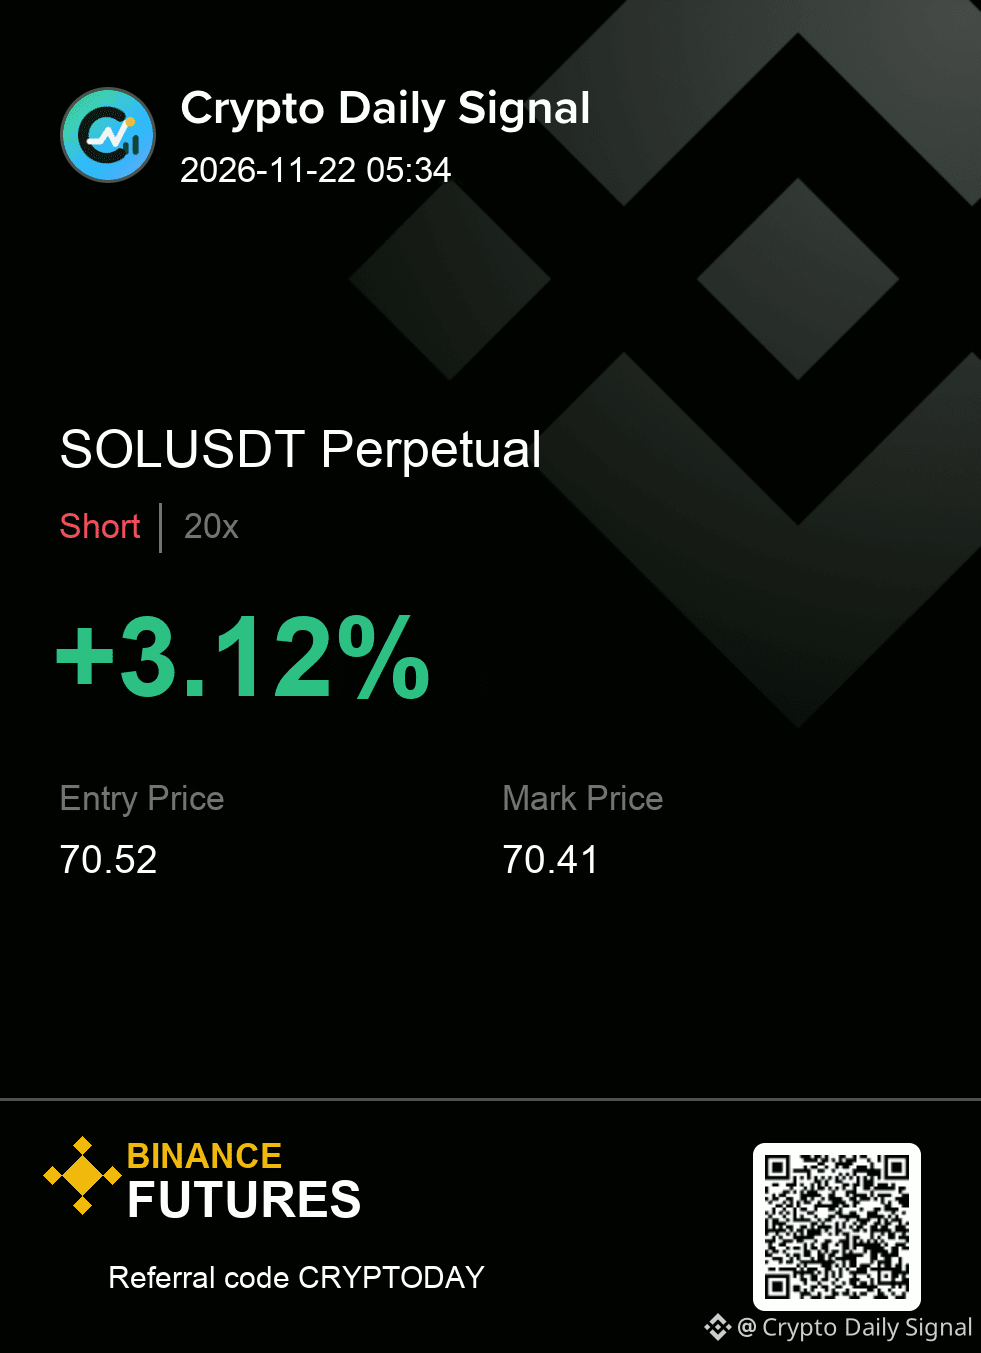
SHORT plan for SOLUSDT
70.42 - 70.62 entry | 70.87 stop
70.17 → 69.89 → 69.53
#MarketAnalysis
{future}(SOLUSDT)
$SOL — right now, I would say it still gives sellers the cleaner argument as the momentum seems to be stalling inside a defined, tight range. The recent upper wick signals supply is stepping in at short-term resistance, which aligns with the bearish bias from the daily and four-hour charts. For this to become stronger on the short side, we'd need a close below the range bottom on bearish volume.
The map is useful only while the invalidation remains intact.
SHORT plan for SOLUSDT
70.42 - 70.62 entry | 70.87 stop
70.17 → 69.89 → 69.53
#MarketAnalysis
The map is useful only while the invalidation remains intact.
SHORT plan for SOLUSDT
70.42 - 70.62 entry | 70.87 stop
70.17 → 69.89 → 69.53
#MarketAnalysis
14

·
--
$IDOL
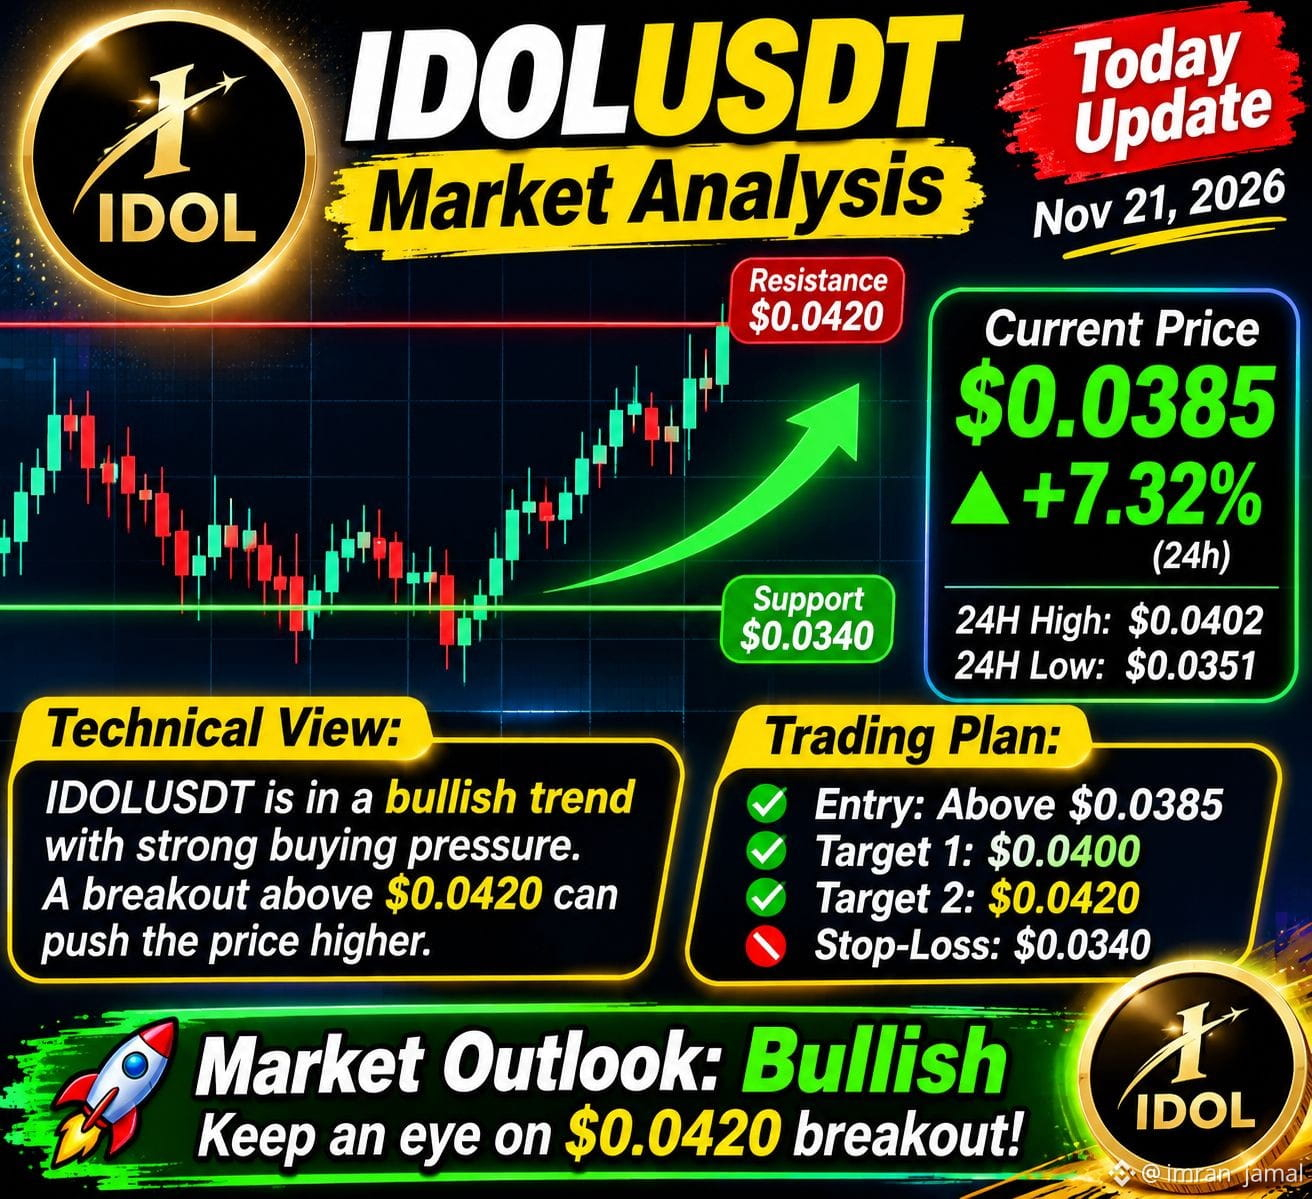
IDOLUSDT Market Analysis – Today 🪙
$0.026657
▲ +21.75% in 24 hours
Market snapshot – November 21, 2026
24H volume: $47.7M
24H high: $0.026701
24H low: $0.020182
Key level: $0.022855
Support: $0.022855
Trend invalidation level (4H): $0.017312
Market outlook
Bullish: Breakout above $0.026701 with strong volume.
Neutral: Consolidation around current levels.
Bearish: A breakdown below $0.022855 could weaken momentum.
Trading strategy: Avoid chasing a sudden pump. Wait for a confirmed breakout or a healthy pullback before considering an entry.
#idolusdt #MEET48 #CryptoTradingTips #ALTCOİNS #MarketAnalysis
{future}(IDOLUSDT)
$IDOL
IDOLUSDT Market Analysis – Today 🪙
$0.026657
▲ +21.75% in 24 hours
Market snapshot – November 21, 2026
24H volume: $47.7M
24H high: $0.026701
24H low: $0.020182
Key level: $0.022855
Support: $0.022855
Trend invalidation level (4H): $0.017312
Market outlook
Bullish: Breakout above $0.026701 with strong volume.
Neutral: Consolidation around current levels.
Bearish: A breakdown below $0.022855 could weaken momentum.
Trading strategy: Avoid chasing a sudden pump. Wait for a confirmed breakout or a healthy pullback before considering an entry.
#idolusdt #MEET48 #CryptoTradingTips #ALTCOİNS #MarketAnalysis
IDOLUSDT Market Analysis – Today 🪙
$0.026657
▲ +21.75% in 24 hours
Market snapshot – November 21, 2026
24H volume: $47.7M
24H high: $0.026701
24H low: $0.020182
Key level: $0.022855
Support: $0.022855
Trend invalidation level (4H): $0.017312
Market outlook
Bullish: Breakout above $0.026701 with strong volume.
Neutral: Consolidation around current levels.
Bearish: A breakdown below $0.022855 could weaken momentum.
Trading strategy: Avoid chasing a sudden pump. Wait for a confirmed breakout or a healthy pullback before considering an entry.
#idolusdt #MEET48 #CryptoTradingTips #ALTCOİNS #MarketAnalysis
177
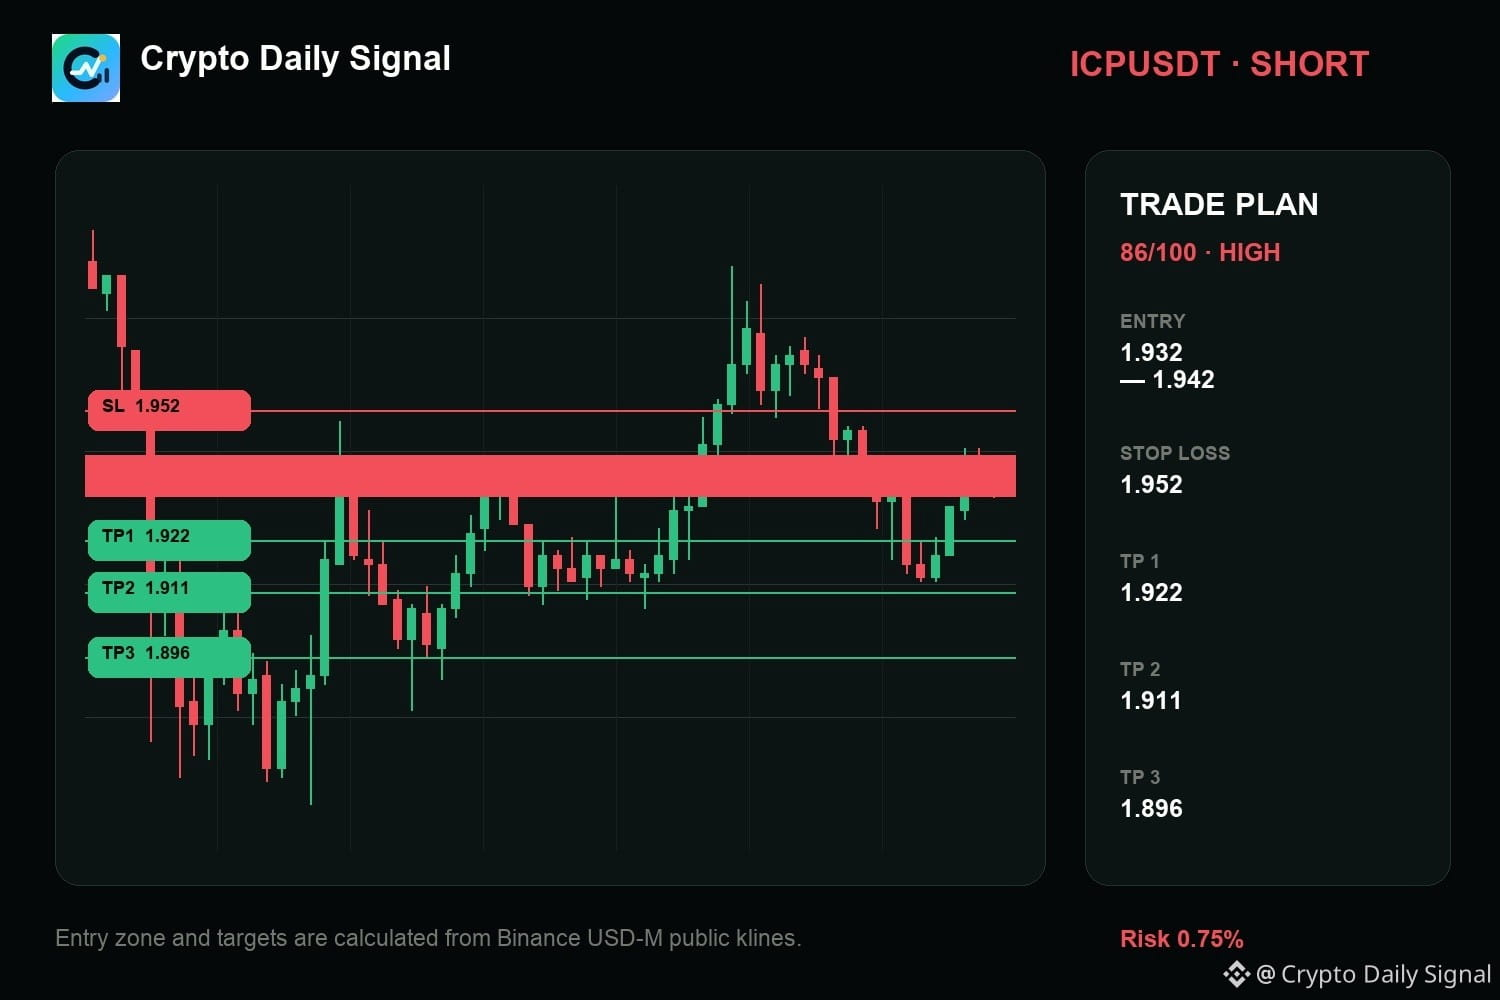
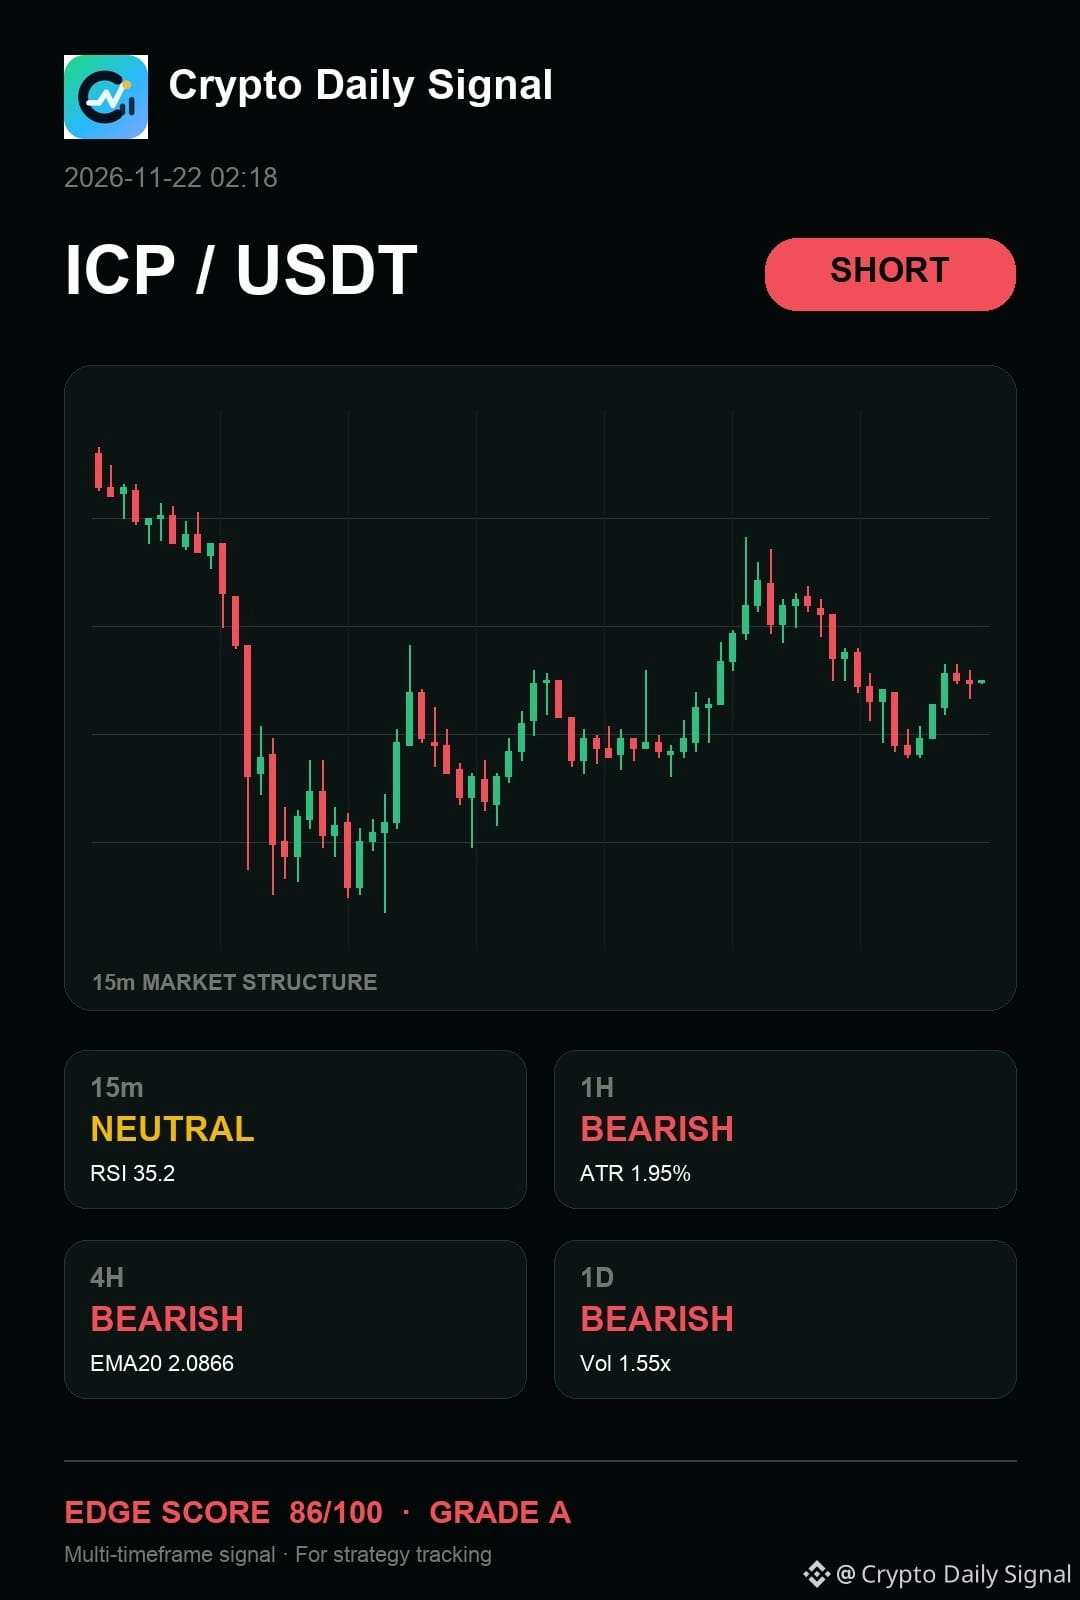
$ICP still has a valid bearish path as price stays contained in a volatile range. The recent high failed to breach resistance, and longer-term momentum remains down. A decisive drop past support would strengthen the thesis.
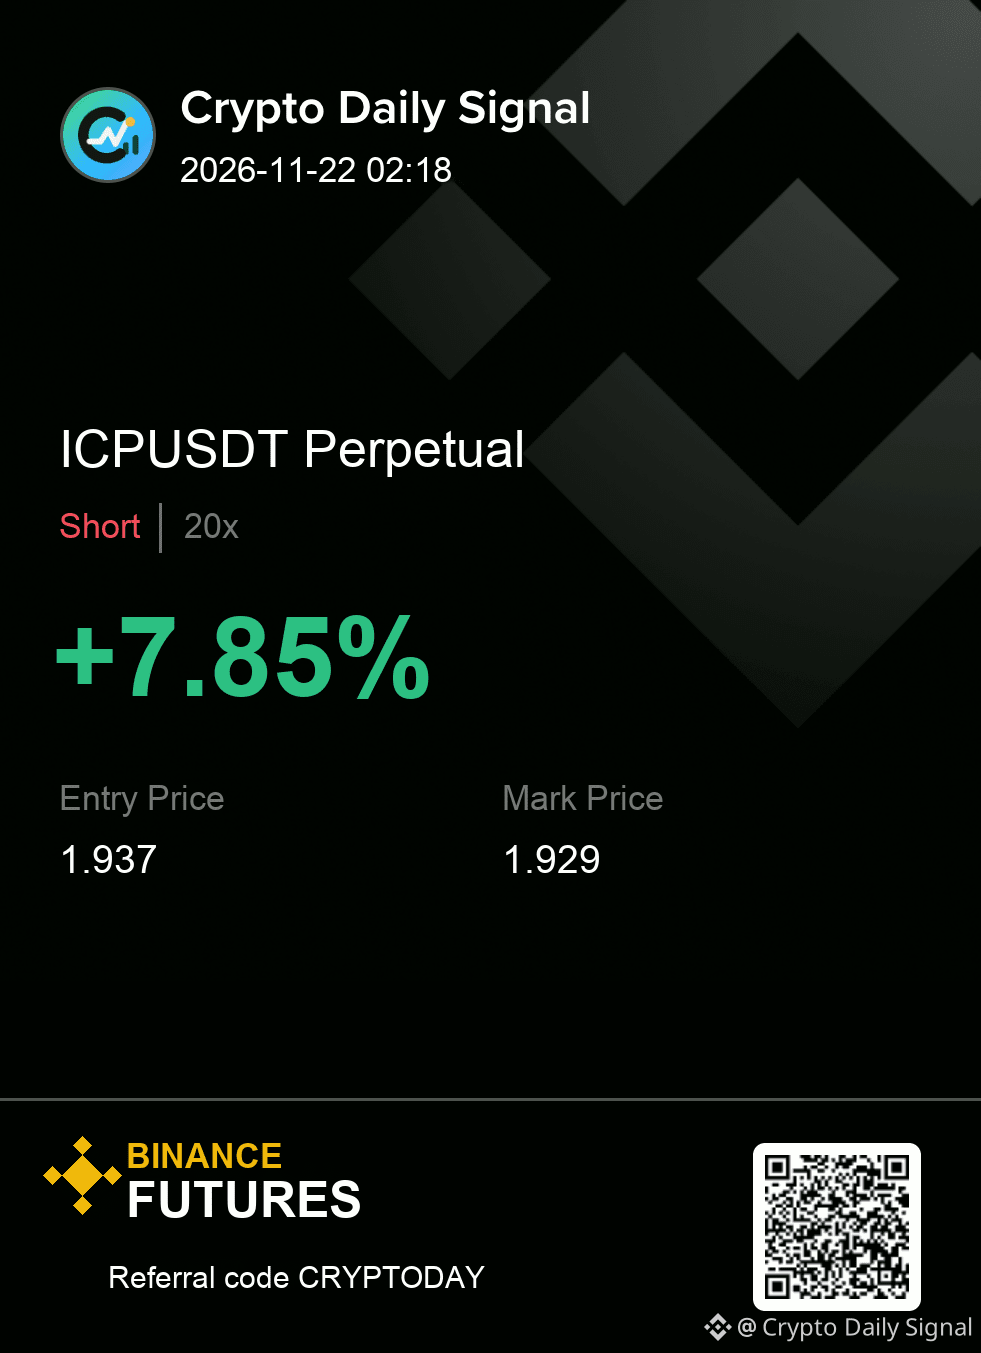
My levels for ICPUSDT — SHORT
Entry zone 1.932 - 1.942
Risk line 1.952
Targets 1.922 / 1.911 / 1.896
#MarketAnalysis
{future}(ICPUSDT)
$ICP still has a valid bearish path as price stays contained in a volatile range. The recent high failed to breach resistance, and longer-term momentum remains down. A decisive drop past support would strengthen the thesis.
My levels for ICPUSDT — SHORT
Entry zone 1.932 - 1.942
Risk line 1.952
Targets 1.922 / 1.911 / 1.896
#MarketAnalysis
My levels for ICPUSDT — SHORT
Entry zone 1.932 - 1.942
Risk line 1.952
Targets 1.922 / 1.911 / 1.896
#MarketAnalysis
10

·
--
Bearish
📊 $BTC / $USDT Market Outlook
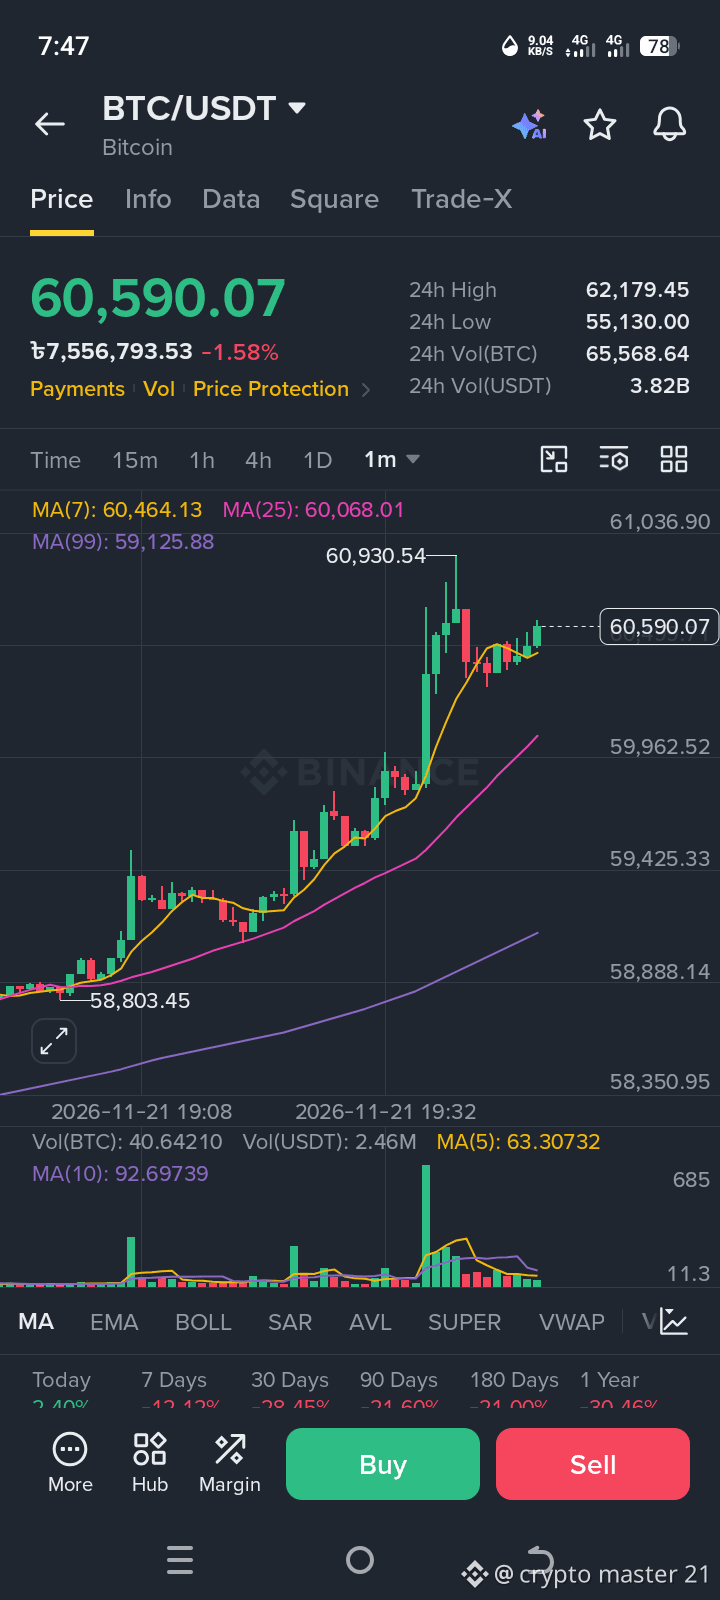
BTC recently faced selling pressure after a sharp rise toward $60,930, as short-term profit-taking may have triggered a pullback. However, the price is still holding above key moving averages, suggesting the overall structure remains relatively strong.
$USDT
If buying volume returns, an upward recovery may be possible. For now, consolidation and volatility remain important to watch.
Key focus: Buyer momentum, volume, and resistance levels. 🔍
#Bitcoin #BTC #CryptoMarket #Binance #MarketAnalysis
📊 $BTC / $USDT Market Outlook
BTC recently faced selling pressure after a sharp rise toward $60,930, as short-term profit-taking may have triggered a pullback. However, the price is still holding above key moving averages, suggesting the overall structure remains relatively strong.
$USDT
If buying volume returns, an upward recovery may be possible. For now, consolidation and volatility remain important to watch.
Key focus: Buyer momentum, volume, and resistance levels. 🔍
#Bitcoin #BTC #CryptoMarket #Binance #MarketAnalysis
BTC recently faced selling pressure after a sharp rise toward $60,930, as short-term profit-taking may have triggered a pullback. However, the price is still holding above key moving averages, suggesting the overall structure remains relatively strong.
$USDT
If buying volume returns, an upward recovery may be possible. For now, consolidation and volatility remain important to watch.
Key focus: Buyer momentum, volume, and resistance levels. 🔍
#Bitcoin #BTC #CryptoMarket #Binance #MarketAnalysis
1
91

🌍 THE ENTIRE MARKET IS TURNING RED. BUT IS THIS THE END OF THE BULL RUN OR THE START OF A BIGGER OPPORTUNITY?
Crypto, stocks and other risk assets are facing heavy selling pressure. Fear is spreading, investors are becoming impatient, and everyone seems to be searching for the bottom.
But markets don't move in one direction forever.
Bitcoin is testing major lows, altcoins are under pressure, and investors are becoming increasingly defensive.
Here's how I'm looking at the bigger picture:
Bitcoin: A recovery could restore confidence across crypto. Another breakdown could bring more selling.
Altcoins: Weak projects may struggle, while fundamentally strong assets could attract attention when sentiment improves.
Stocks: If risk appetite remains weak, recovery could take longer than expected.
My opinion: I'm not treating every red candle as the end of the market. Corrections can create opportunities, but patience and capital preservation matter.
The real question is: Are we witnessing a temporary correction or the beginning of a much bigger market reset?
#Crypto #stockmarket #trading #MarketAnalysis #TwentyOneCapitalAdds172.25BTC
🌍 THE ENTIRE MARKET IS TURNING RED. BUT IS THIS THE END OF THE BULL RUN OR THE START OF A BIGGER OPPORTUNITY?
Crypto, stocks and other risk assets are facing heavy selling pressure. Fear is spreading, investors are becoming impatient, and everyone seems to be searching for the bottom.
But markets don't move in one direction forever.
Bitcoin is testing major lows, altcoins are under pressure, and investors are becoming increasingly defensive.
Here's how I'm looking at the bigger picture:
Bitcoin: A recovery could restore confidence across crypto. Another breakdown could bring more selling.
Altcoins: Weak projects may struggle, while fundamentally strong assets could attract attention when sentiment improves.
Stocks: If risk appetite remains weak, recovery could take longer than expected.
My opinion: I'm not treating every red candle as the end of the market. Corrections can create opportunities, but patience and capital preservation matter.
The real question is: Are we witnessing a temporary correction or the beginning of a much bigger market reset?
#Crypto #stockmarket #trading #MarketAnalysis #TwentyOneCapitalAdds172.25BTC
Crypto, stocks and other risk assets are facing heavy selling pressure. Fear is spreading, investors are becoming impatient, and everyone seems to be searching for the bottom.
But markets don't move in one direction forever.
Bitcoin is testing major lows, altcoins are under pressure, and investors are becoming increasingly defensive.
Here's how I'm looking at the bigger picture:
Bitcoin: A recovery could restore confidence across crypto. Another breakdown could bring more selling.
Altcoins: Weak projects may struggle, while fundamentally strong assets could attract attention when sentiment improves.
Stocks: If risk appetite remains weak, recovery could take longer than expected.
My opinion: I'm not treating every red candle as the end of the market. Corrections can create opportunities, but patience and capital preservation matter.
The real question is: Are we witnessing a temporary correction or the beginning of a much bigger market reset?
#Crypto #stockmarket #trading #MarketAnalysis #TwentyOneCapitalAdds172.25BTC
1
1
232
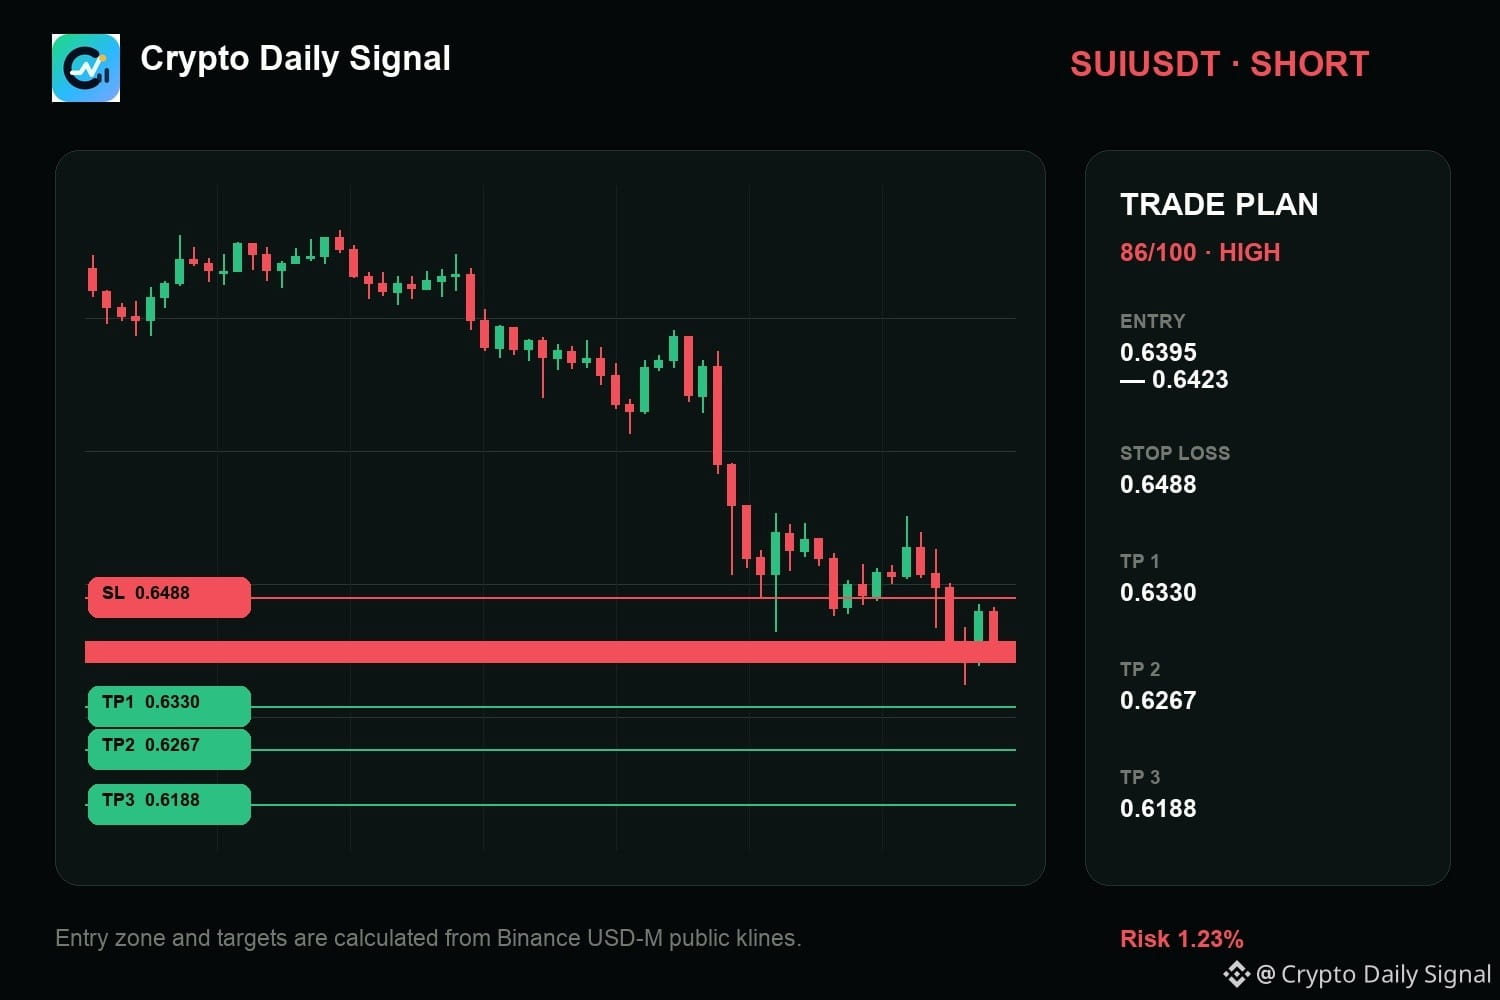
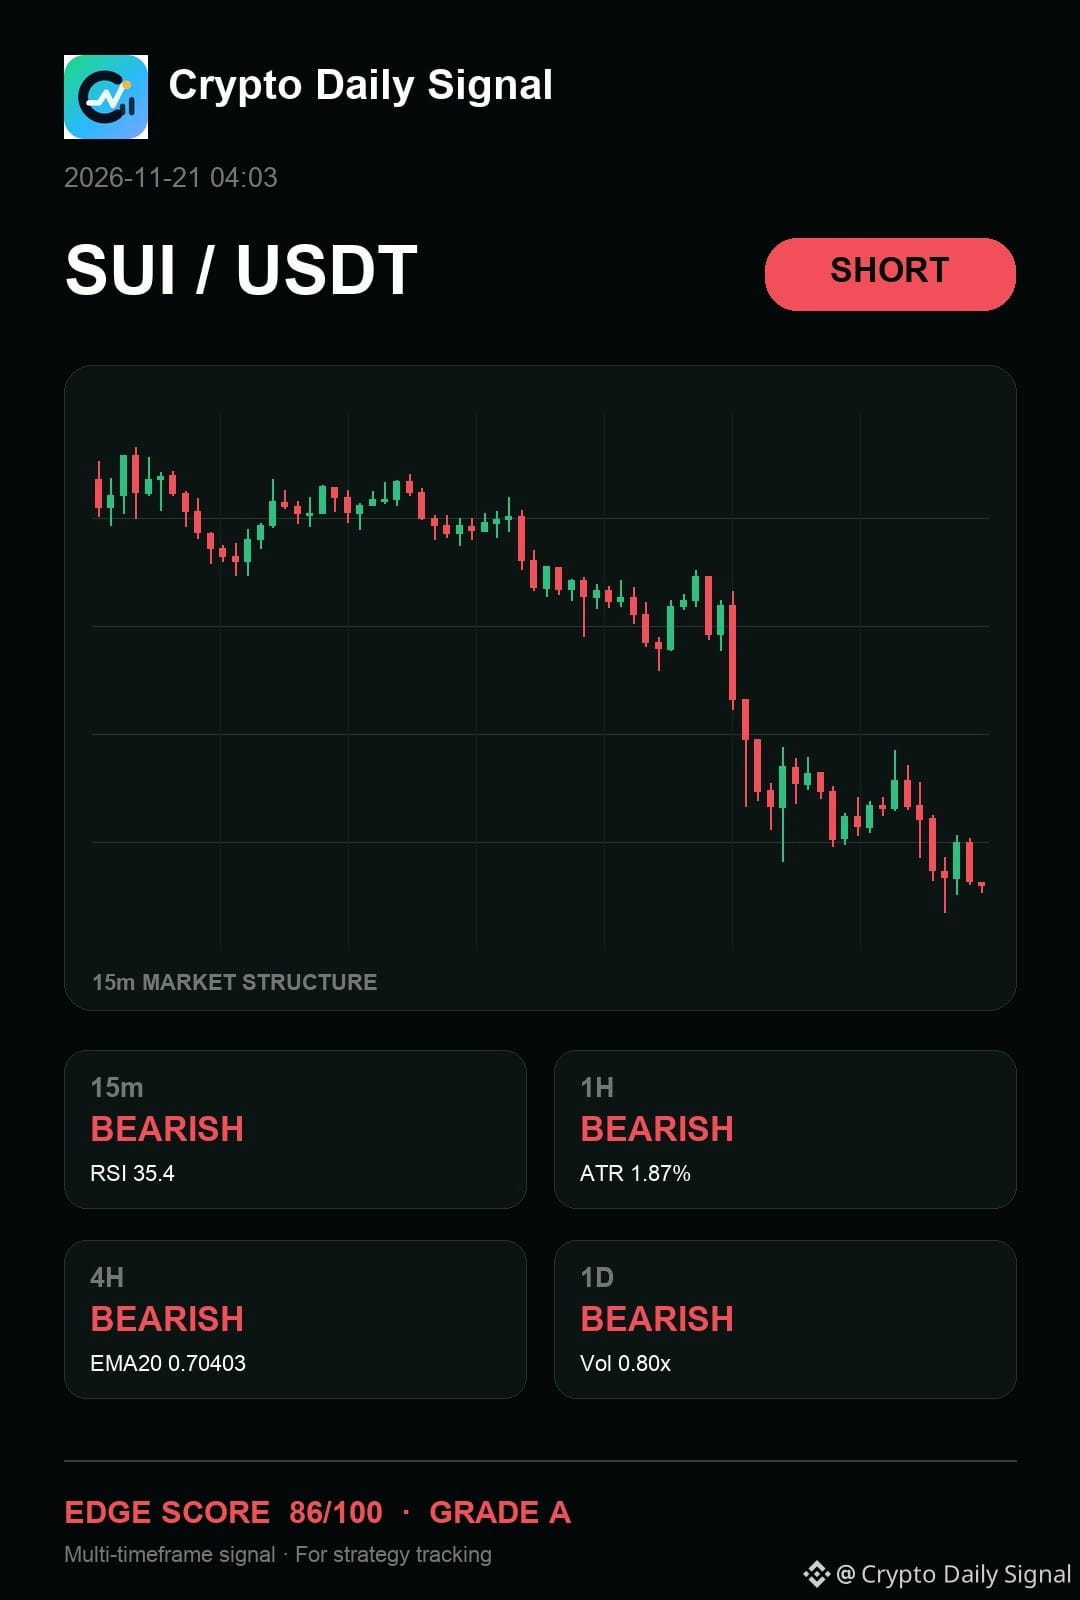
$SUI — honestly, the chart still says it still has a valid bearish path as it prints lower highs on the fifteen-minute chart, aligning with the wider bearish trends on the four-hour and daily views. Weak volume suggests selling pressure remains persistent, so a clean drop below the last swing low is needed for confirmation.
The map is useful only while the invalidation remains intact.
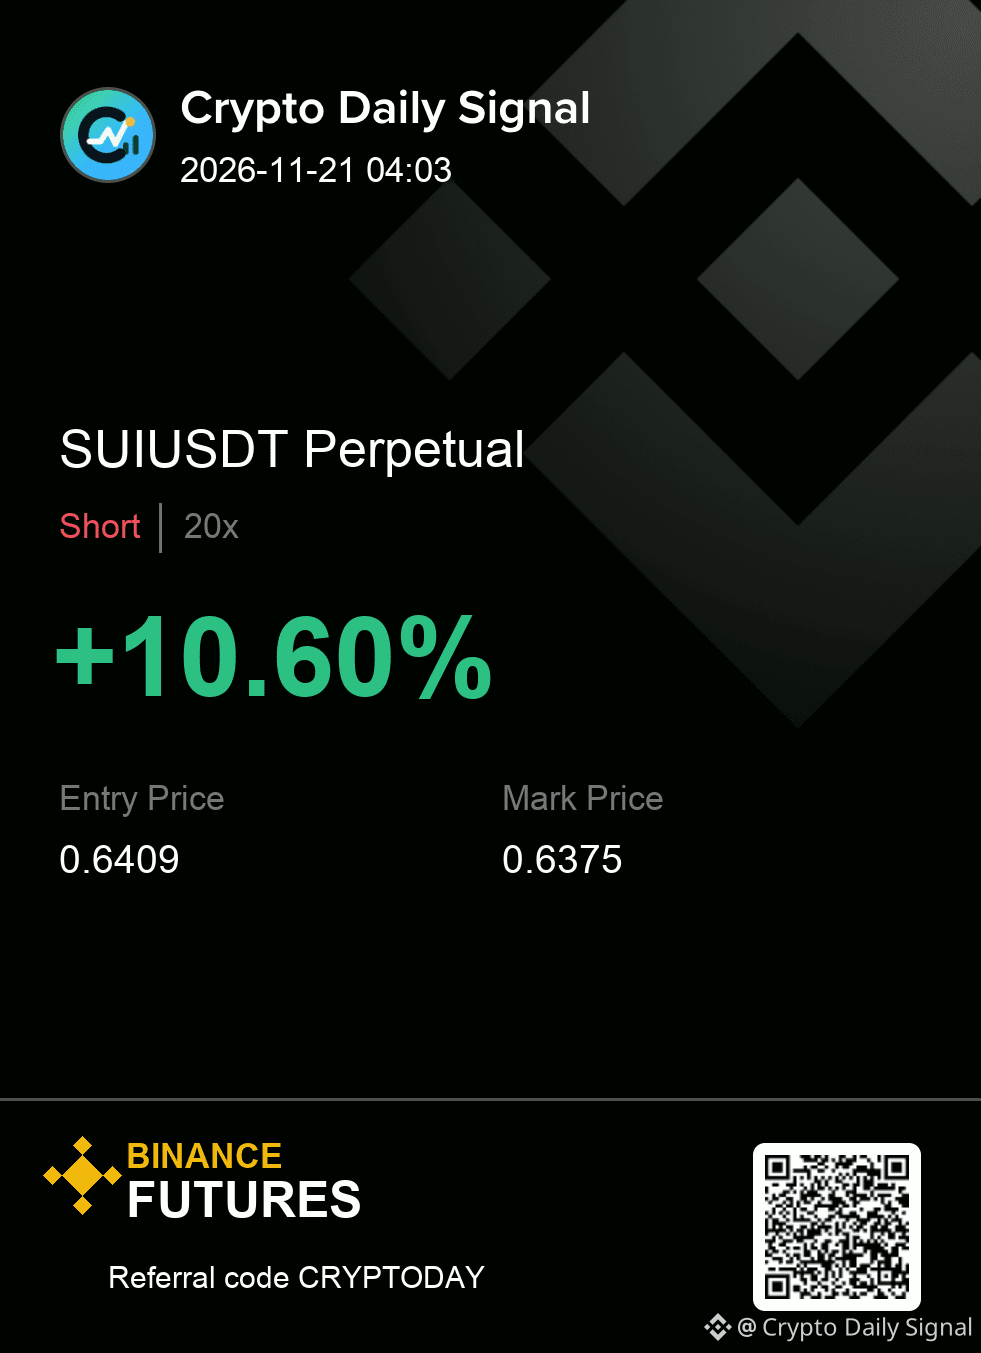
SHORT plan for SUIUSDT
0.6395 - 0.6423 entry | 0.6488 stop
0.6330 → 0.6267 → 0.6188
#MarketAnalysis
{future}(SUIUSDT)
$SUI — honestly, the chart still says it still has a valid bearish path as it prints lower highs on the fifteen-minute chart, aligning with the wider bearish trends on the four-hour and daily views. Weak volume suggests selling pressure remains persistent, so a clean drop below the last swing low is needed for confirmation.
The map is useful only while the invalidation remains intact.
SHORT plan for SUIUSDT
0.6395 - 0.6423 entry | 0.6488 stop
0.6330 → 0.6267 → 0.6188
#MarketAnalysis
The map is useful only while the invalidation remains intact.
SHORT plan for SUIUSDT
0.6395 - 0.6423 entry | 0.6488 stop
0.6330 → 0.6267 → 0.6188
#MarketAnalysis
7

·
--
Bullish
Crypto Just Had a Brutal Week. What Really Happened? 📉
$BTC and $ETH experienced significant declines during the week of November 9–15, 2026.
But what were the major factors behind the market weakness?
Here's a breakdown 👇
📊 THE NUMBERS
Bitcoin ($BTC)
- Weekly opening: Approximately $74,800
- Weekly low: Approximately $62,612
- Weekly decline: Around 13.1%
Ethereum ($ETH)
- Weekly opening: Approximately $2,128
- Weekly low: Approximately $1,729
- Weekly decline: Around 14.5%
Historical figures based on the cited November 17 market report.
🔍 WHY DID THE MARKET DECLINE?
1. ETF Outflows
Bitcoin investment funds experienced substantial withdrawals, reflecting weaker institutional fund flows.
2. Rising Bond Yields
Higher US bond yields can make risk-sensitive assets less attractive to investors.
3. Interest Rate Expectations
Changing expectations about Federal Reserve policy added uncertainty to financial markets.
4. MSCI Index Decision
MSCI announced that Strategy would be removed from relevant indexes after November 30.
🧠 KEY TAKEAWAY
Crypto markets are influenced by more than just cryptocurrency news.
Macroeconomic conditions, institutional fund flows and market sentiment can all affect price movements.
Understanding these factors helps beginners interpret market developments more objectively.
⚠️ Disclaimer: This content is for educational purposes only, not financial advice. Cryptocurrency markets are highly volatile.
💬 YOUR THOUGHTS
Which factor do you think had the biggest influence on this week's crypto market decline?
$BTC $ETH
#bitcoin
{spot}(BTCUSDT)
{spot}(ETHUSDT)
#Ethereum #cryptoeducation #MarketAnalysis
Crypto Just Had a Brutal Week. What Really Happened? 📉
$BTC and $ETH experienced significant declines during the week of November 9–15, 2026.
But what were the major factors behind the market weakness?
Here's a breakdown 👇
📊 THE NUMBERS
Bitcoin ($BTC )
- Weekly opening: Approximately $74,800
- Weekly low: Approximately $62,612
- Weekly decline: Around 13.1%
Ethereum ($ETH )
- Weekly opening: Approximately $2,128
- Weekly low: Approximately $1,729
- Weekly decline: Around 14.5%
Historical figures based on the cited November 17 market report.
🔍 WHY DID THE MARKET DECLINE?
1. ETF Outflows
Bitcoin investment funds experienced substantial withdrawals, reflecting weaker institutional fund flows.
2. Rising Bond Yields
Higher US bond yields can make risk-sensitive assets less attractive to investors.
3. Interest Rate Expectations
Changing expectations about Federal Reserve policy added uncertainty to financial markets.
4. MSCI Index Decision
MSCI announced that Strategy would be removed from relevant indexes after November 30.
🧠 KEY TAKEAWAY
Crypto markets are influenced by more than just cryptocurrency news.
Macroeconomic conditions, institutional fund flows and market sentiment can all affect price movements.
Understanding these factors helps beginners interpret market developments more objectively.
⚠️ Disclaimer: This content is for educational purposes only, not financial advice. Cryptocurrency markets are highly volatile.
💬 YOUR THOUGHTS
Which factor do you think had the biggest influence on this week's crypto market decline?
$BTC $ETH
#bitcoin
#Ethereum #cryptoeducation #MarketAnalysis
$BTC and $ETH experienced significant declines during the week of November 9–15, 2026.
But what were the major factors behind the market weakness?
Here's a breakdown 👇
📊 THE NUMBERS
Bitcoin ($BTC )
- Weekly opening: Approximately $74,800
- Weekly low: Approximately $62,612
- Weekly decline: Around 13.1%
Ethereum ($ETH )
- Weekly opening: Approximately $2,128
- Weekly low: Approximately $1,729
- Weekly decline: Around 14.5%
Historical figures based on the cited November 17 market report.
🔍 WHY DID THE MARKET DECLINE?
1. ETF Outflows
Bitcoin investment funds experienced substantial withdrawals, reflecting weaker institutional fund flows.
2. Rising Bond Yields
Higher US bond yields can make risk-sensitive assets less attractive to investors.
3. Interest Rate Expectations
Changing expectations about Federal Reserve policy added uncertainty to financial markets.
4. MSCI Index Decision
MSCI announced that Strategy would be removed from relevant indexes after November 30.
🧠 KEY TAKEAWAY
Crypto markets are influenced by more than just cryptocurrency news.
Macroeconomic conditions, institutional fund flows and market sentiment can all affect price movements.
Understanding these factors helps beginners interpret market developments more objectively.
⚠️ Disclaimer: This content is for educational purposes only, not financial advice. Cryptocurrency markets are highly volatile.
💬 YOUR THOUGHTS
Which factor do you think had the biggest influence on this week's crypto market decline?
$BTC $ETH
#bitcoin
#Ethereum #cryptoeducation #MarketAnalysis
1
269

·
--
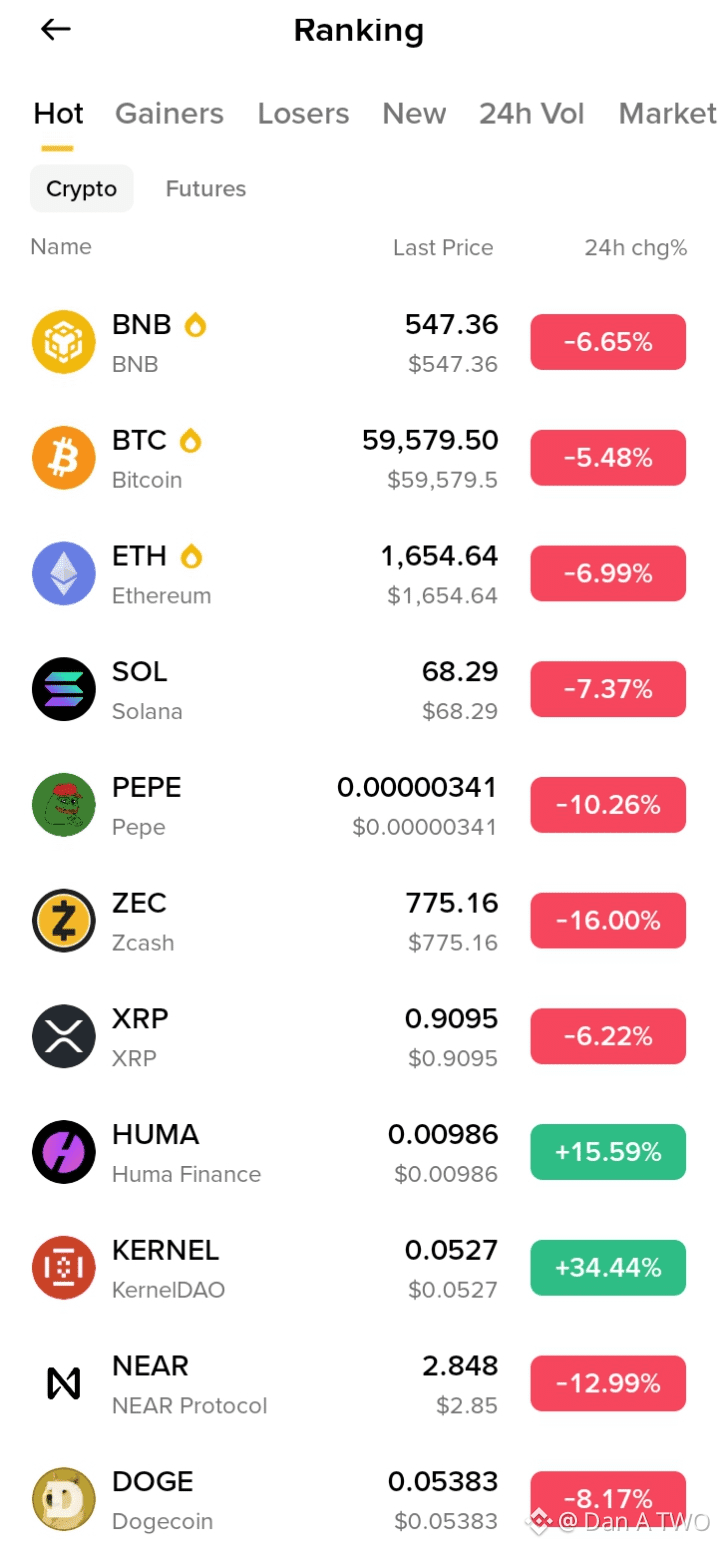
📉 Crypto Market Analysis: Today's Drop
The crypto market saw a sharp decline over the last 24 hours:
• $BTC: -5.48% (~$59,580)
• $ETH: -6.99% (~$1,655)
• $BNB: -6.65% (~$547)
• $SOL: -7.37% (~$68)
• $XRP: -6.22% (~$0.91)
• $NEAR: -12.99%, $ZEC: -16.00%
Most likely drivers:
1. Risk-off sentiment: Investors are cutting exposure and moving money out of volatile assets.
2. Liquidation cascade: Forced closures of leveraged positions are adding pressure on prices.
3. Altcoins hit harder: When Bitcoin weakens, altcoins and meme coins tend to fall even further.
What to watch:
• BTC and ETH support levels
• Funding rates and open interest
• Trading volume to confirm whether the move has real strength
Takeaway: Stick to solid risk management, avoid heavy leverage, and wait for confirmation of a reversal before taking large positions.
Patience and a plan are what protect an investor. 💪
Not financial advice. Do your own research (DYOR).
#crypto #DanATWO #bnb #MarketAnalysis #dyor
📉 Crypto Market Analysis: Today's Drop
The crypto market saw a sharp decline over the last 24 hours:
• $BTC: -5.48% (~$59,580)
• $ETH: -6.99% (~$1,655)
• $BNB: -6.65% (~$547)
• $SOL: -7.37% (~$68)
• $XRP: -6.22% (~$0.91)
• $NEAR: -12.99%, $ZEC: -16.00%
Most likely drivers:
1. Risk-off sentiment: Investors are cutting exposure and moving money out of volatile assets.
2. Liquidation cascade: Forced closures of leveraged positions are adding pressure on prices.
3. Altcoins hit harder: When Bitcoin weakens, altcoins and meme coins tend to fall even further.
What to watch:
• BTC and ETH support levels
• Funding rates and open interest
• Trading volume to confirm whether the move has real strength
Takeaway: Stick to solid risk management, avoid heavy leverage, and wait for confirmation of a reversal before taking large positions.
Patience and a plan are what protect an investor. 💪
Not financial advice. Do your own research (DYOR).
#crypto #DanATWO #bnb #MarketAnalysis #dyor
The crypto market saw a sharp decline over the last 24 hours:
• $BTC: -5.48% (~$59,580)
• $ETH: -6.99% (~$1,655)
• $BNB: -6.65% (~$547)
• $SOL: -7.37% (~$68)
• $XRP: -6.22% (~$0.91)
• $NEAR: -12.99%, $ZEC: -16.00%
Most likely drivers:
1. Risk-off sentiment: Investors are cutting exposure and moving money out of volatile assets.
2. Liquidation cascade: Forced closures of leveraged positions are adding pressure on prices.
3. Altcoins hit harder: When Bitcoin weakens, altcoins and meme coins tend to fall even further.
What to watch:
• BTC and ETH support levels
• Funding rates and open interest
• Trading volume to confirm whether the move has real strength
Takeaway: Stick to solid risk management, avoid heavy leverage, and wait for confirmation of a reversal before taking large positions.
Patience and a plan are what protect an investor. 💪
Not financial advice. Do your own research (DYOR).
#crypto #DanATWO #bnb #MarketAnalysis #dyor
1
407
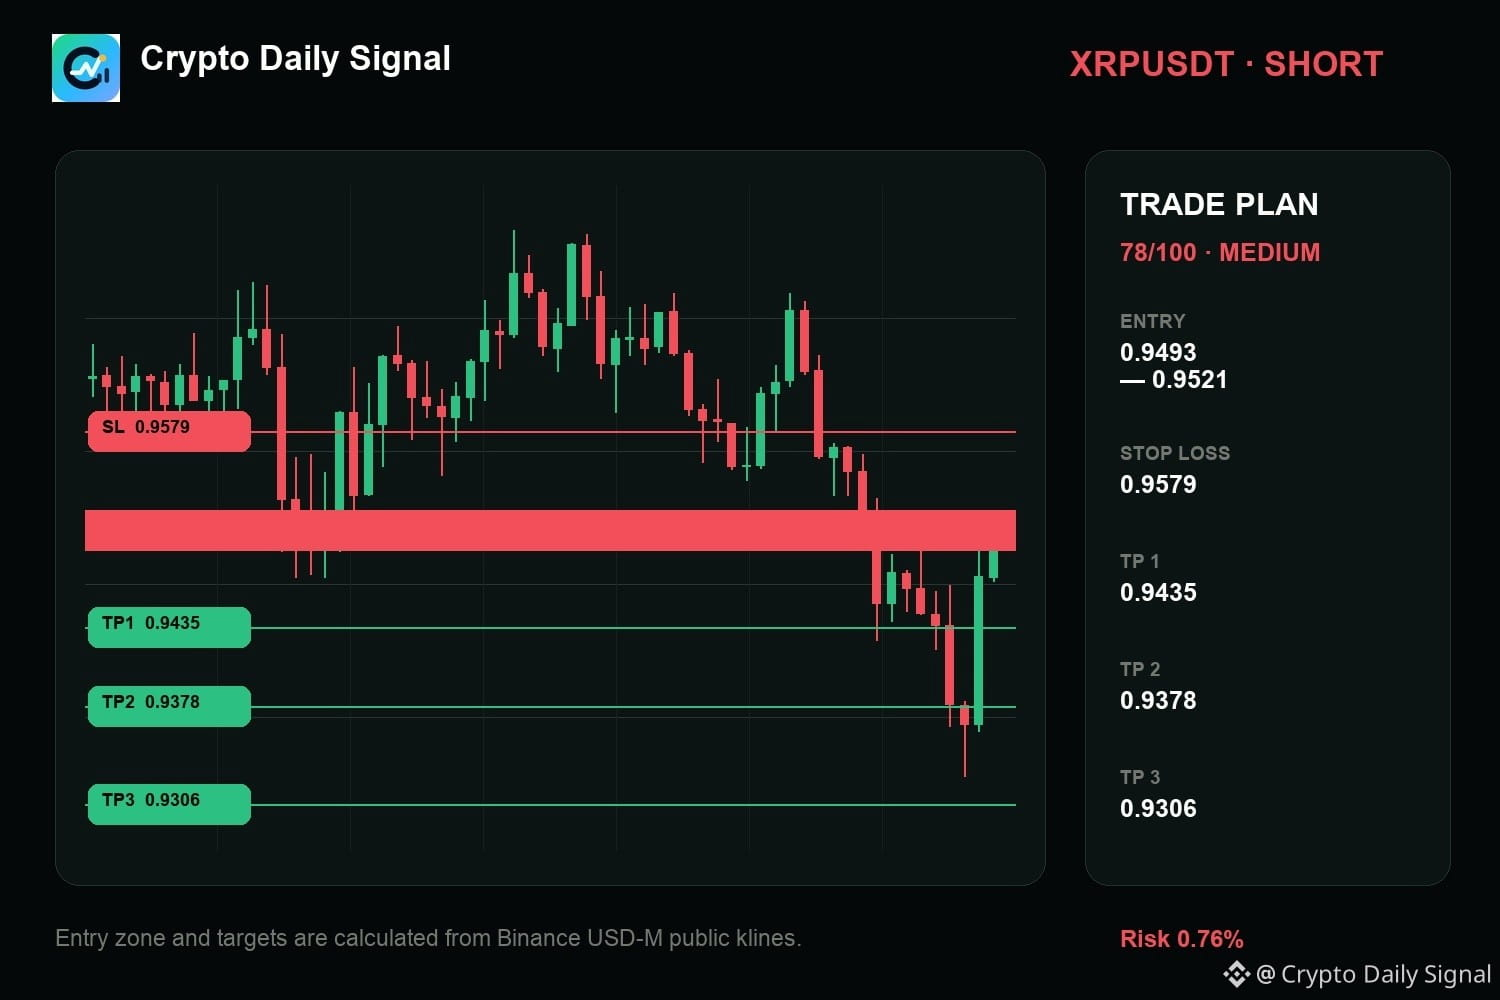
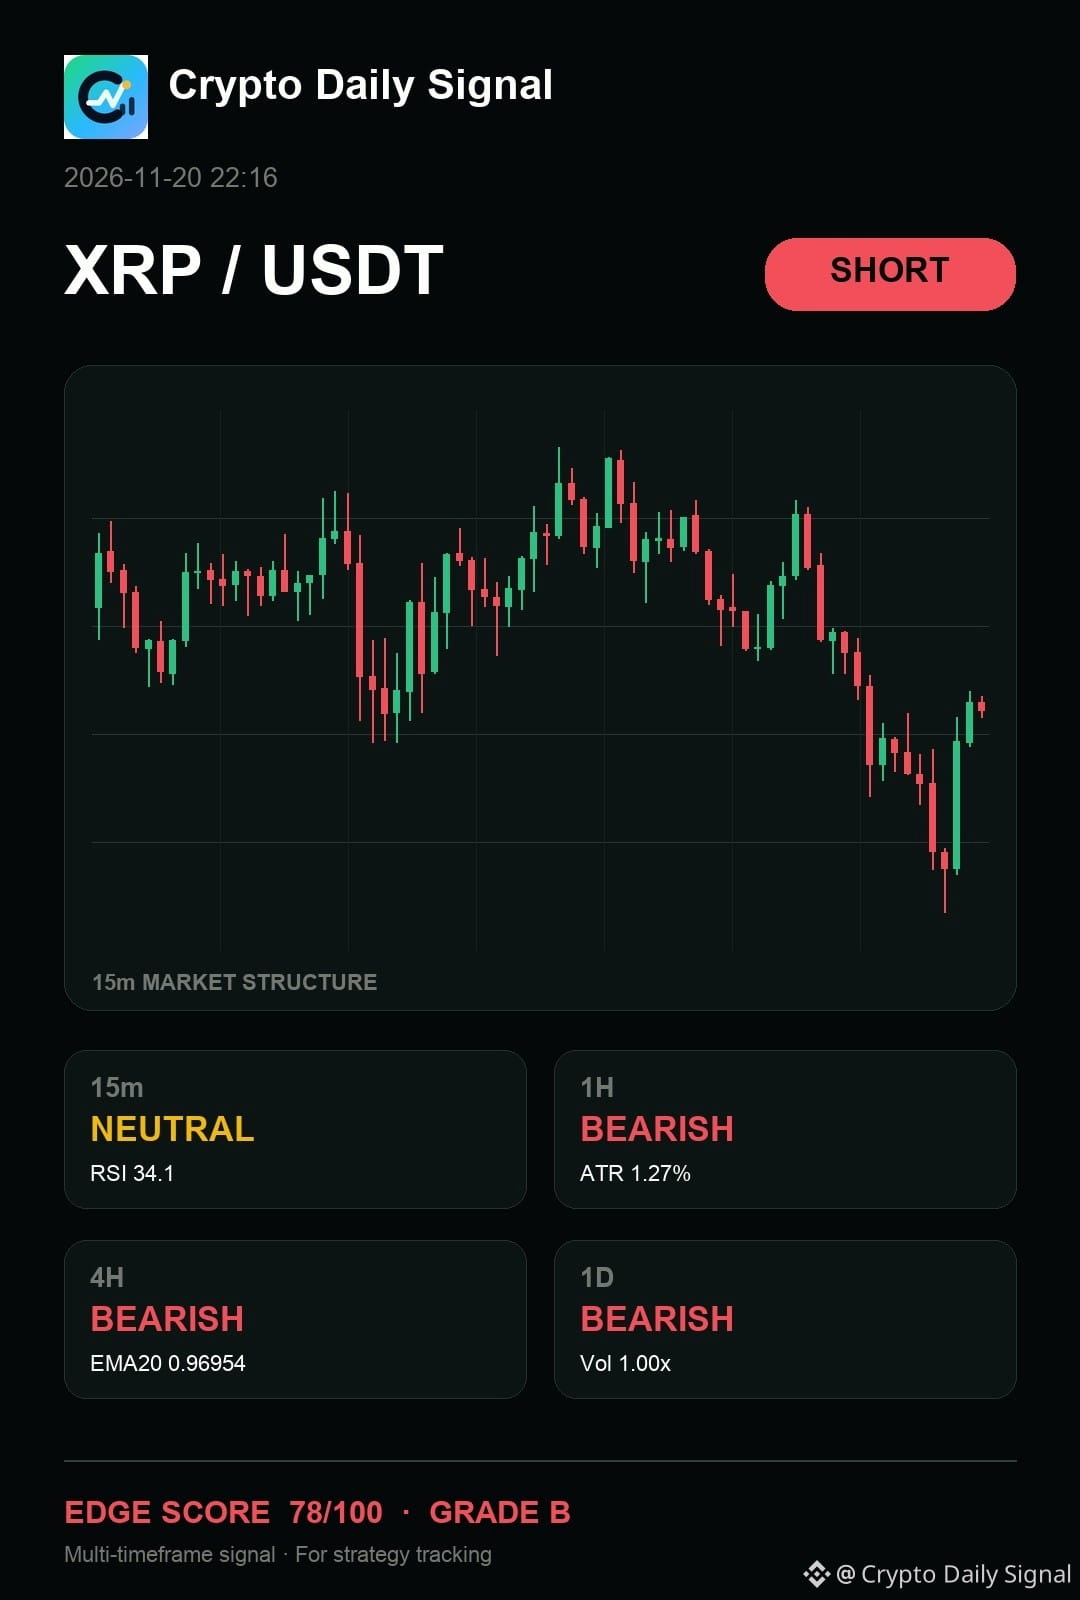
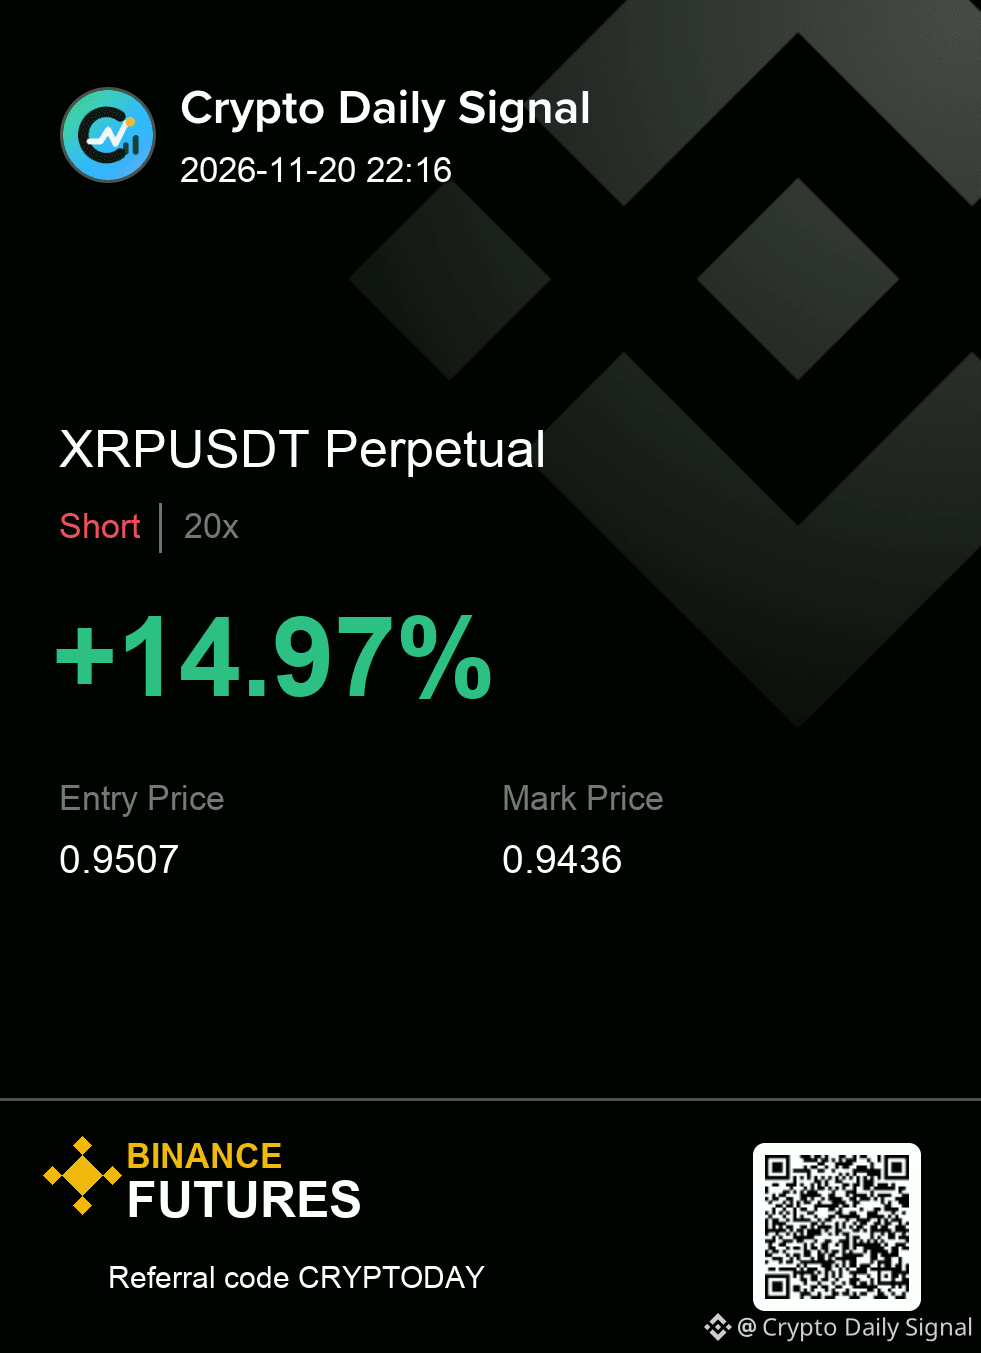
$XRP needs confirmation before I press the short because the recent push saw a clear rejection from that upper level. The price is trading below the trendline formed by prior swings, and the broader direction across the daily and four-hour views remains down. For this to play out cleanly, we need a definitive close below the immediate support area.
The map is useful only while the invalidation remains intact.
Levels — XRPUSDT
Zone: 0.9493 - 0.9521
Cut: 0.9579
Scale: 0.9435 | 0.9378 | 0.9306
#MarketAnalysis
{future}(XRPUSDT)
$XRP needs confirmation before I press the short because the recent push saw a clear rejection from that upper level. The price is trading below the trendline formed by prior swings, and the broader direction across the daily and four-hour views remains down. For this to play out cleanly, we need a definitive close below the immediate support area.
The map is useful only while the invalidation remains intact.
Levels — XRPUSDT
Zone: 0.9493 - 0.9521
Cut: 0.9579
Scale: 0.9435 | 0.9378 | 0.9306
#MarketAnalysis
The map is useful only while the invalidation remains intact.
Levels — XRPUSDT
Zone: 0.9493 - 0.9521
Cut: 0.9579
Scale: 0.9435 | 0.9378 | 0.9306
#MarketAnalysis
10

$BTC Full Market Analysis
{future}(BTCUSDT)
Bitcoin is showing a short-term recovery, but its previous weekly performance remains negative. This creates an important difference between daily momentum and the broader trend.
Trading volume is around 2.7% of market capitalization. That provides useful activity context, but volume alone cannot confirm a sustainable reversal.
Recent ETF outflows and Federal Reserve uncertainty have also contributed to cautious market sentiment.
Trade on $BTC
What to Watch: ETF flows, BTC dominance, trading volume and Federal Reserve developments.
#Bitcoin #BTC #CryptoMarket #MarketAnalysis #cryptoeducation
$BTC Full Market Analysis
Bitcoin is showing a short-term recovery, but its previous weekly performance remains negative. This creates an important difference between daily momentum and the broader trend.
Trading volume is around 2.7% of market capitalization. That provides useful activity context, but volume alone cannot confirm a sustainable reversal.
Recent ETF outflows and Federal Reserve uncertainty have also contributed to cautious market sentiment.
Trade on $BTC
What to Watch: ETF flows, BTC dominance, trading volume and Federal Reserve developments.
#Bitcoin #BTC #CryptoMarket #MarketAnalysis #cryptoeducation
Bitcoin is showing a short-term recovery, but its previous weekly performance remains negative. This creates an important difference between daily momentum and the broader trend.
Trading volume is around 2.7% of market capitalization. That provides useful activity context, but volume alone cannot confirm a sustainable reversal.
Recent ETF outflows and Federal Reserve uncertainty have also contributed to cautious market sentiment.
Trade on $BTC
What to Watch: ETF flows, BTC dominance, trading volume and Federal Reserve developments.
#Bitcoin #BTC #CryptoMarket #MarketAnalysis #cryptoeducation
111
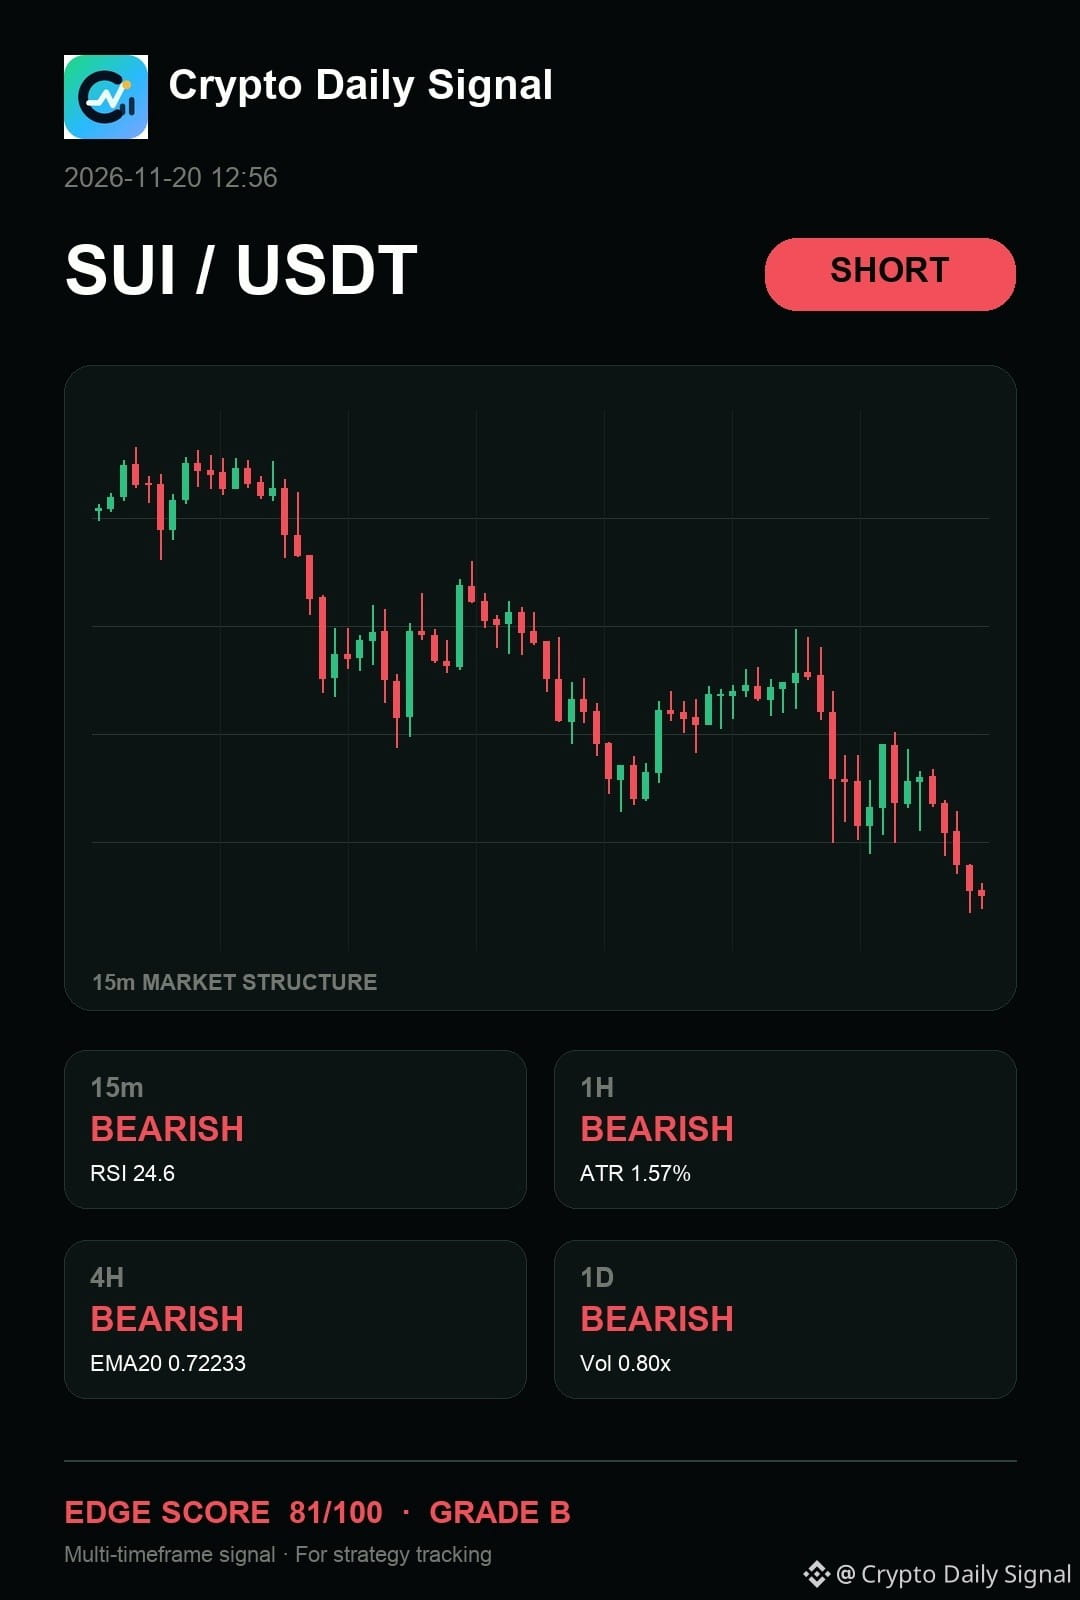
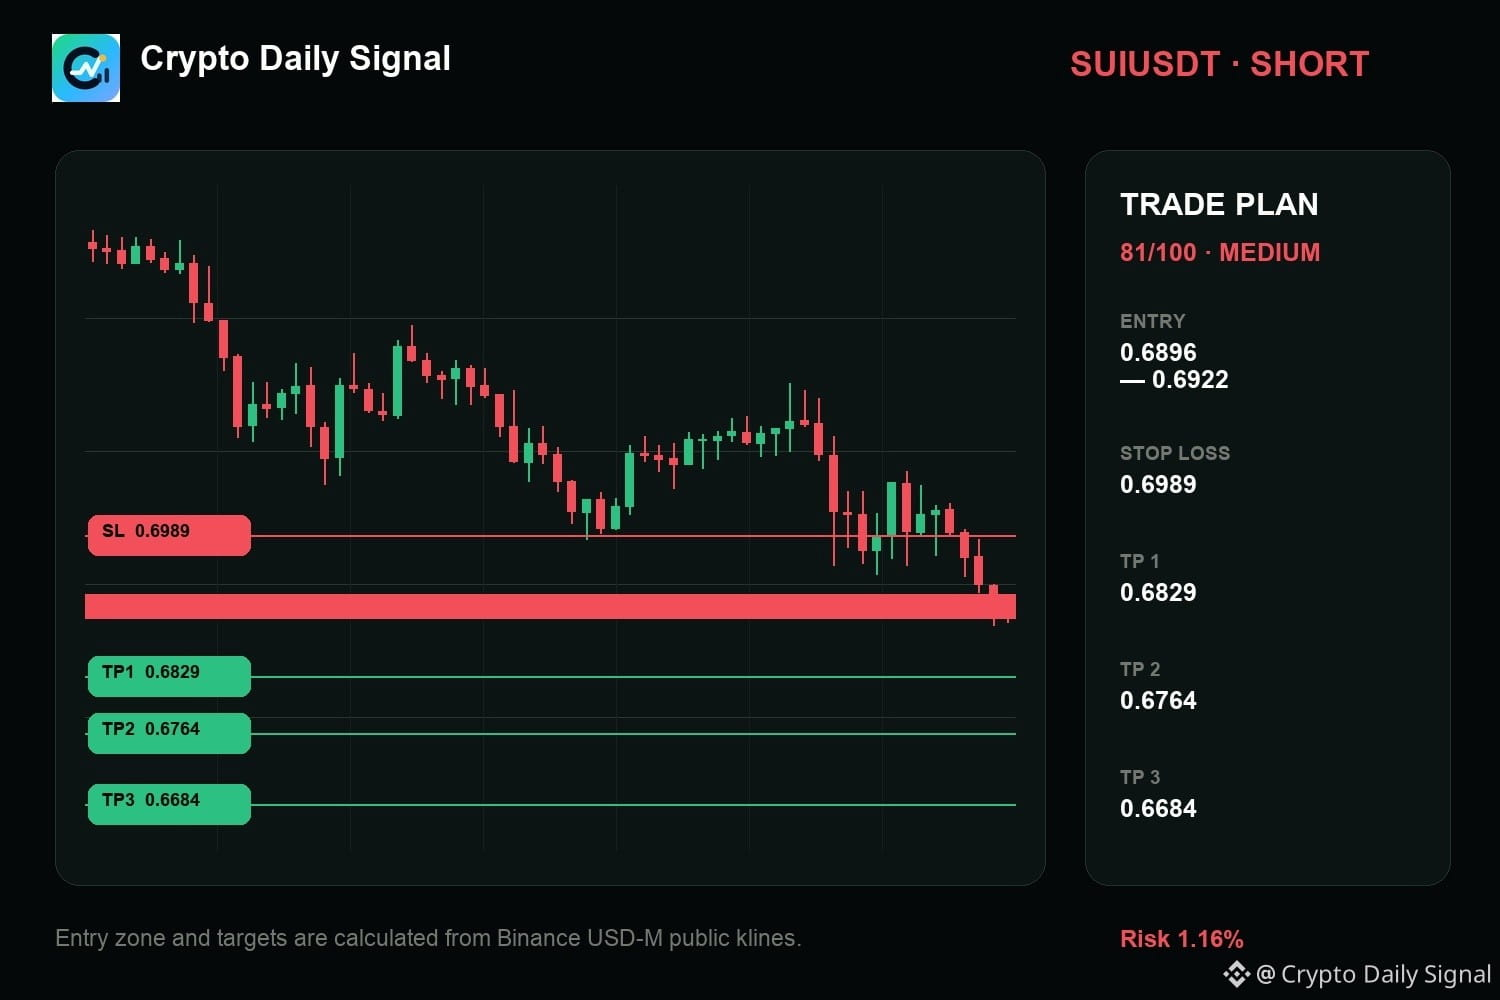
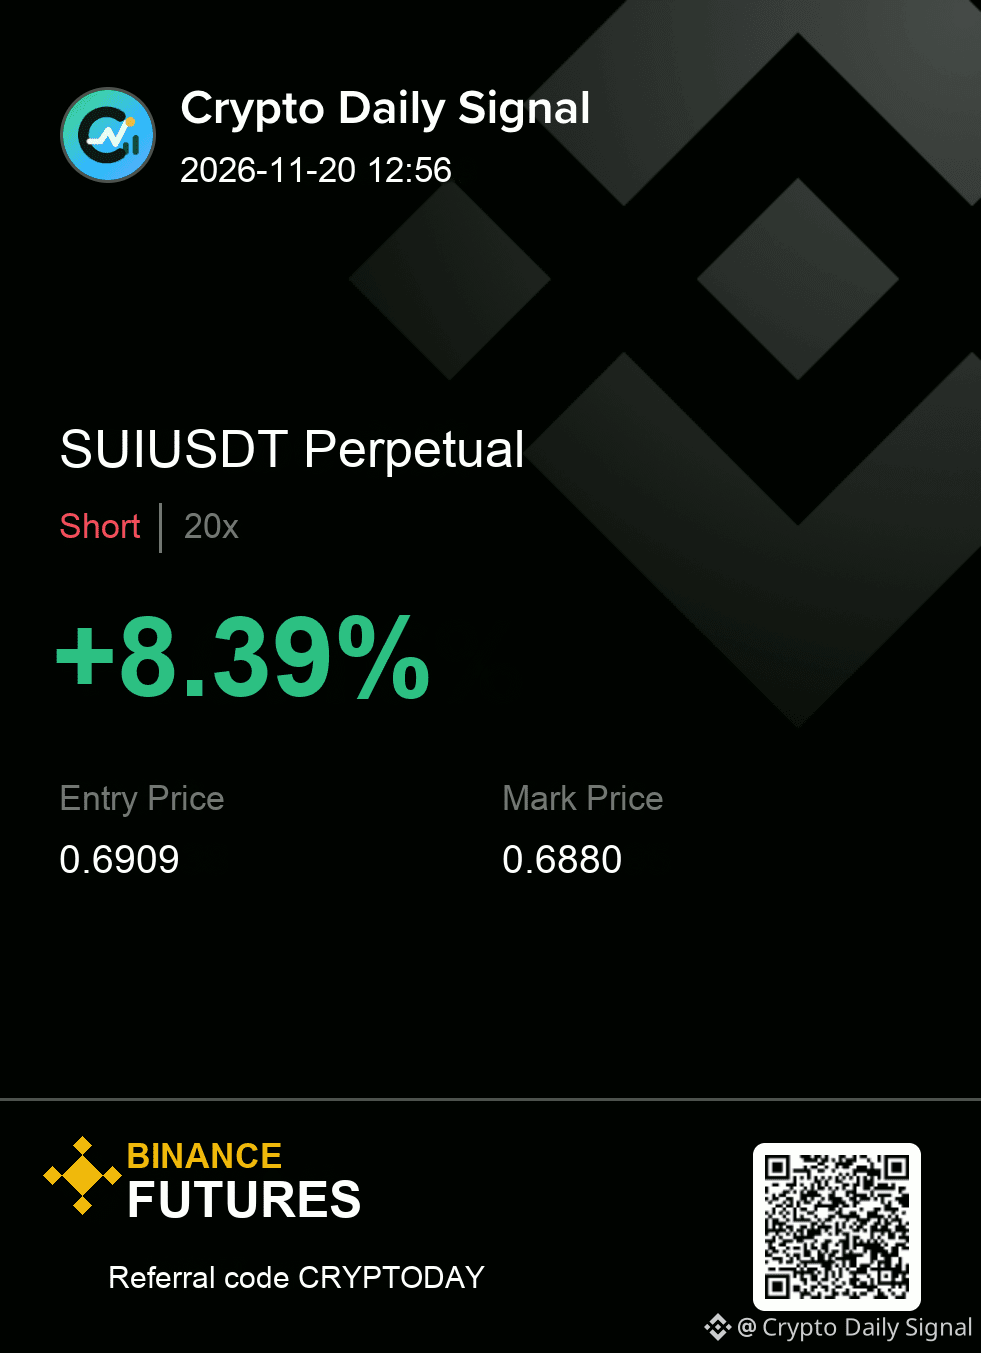
$SUI — honestly, the chart still says it still gives sellers the cleaner argument despite some watching for a bounce off the range bottom. The sequence of lower highs and lower lows across shorter periods confirms the established bearish trend visible on the daily chart. Weakness here would be a decisive break above the recent swing high, but the current positioning below the range floor holds the bearish view.
SUIUSDT SHORT map
Entry → 0.6896 - 0.6922
SL → 0.6989
TP → 0.6829 · 0.6764 · 0.6684
Clean enough to execute, or still too early for you?
#MarketAnalysis
{future}(SUIUSDT)
$SUI — honestly, the chart still says it still gives sellers the cleaner argument despite some watching for a bounce off the range bottom. The sequence of lower highs and lower lows across shorter periods confirms the established bearish trend visible on the daily chart. Weakness here would be a decisive break above the recent swing high, but the current positioning below the range floor holds the bearish view.
SUIUSDT SHORT map
Entry → 0.6896 - 0.6922
SL → 0.6989
TP → 0.6829 · 0.6764 · 0.6684
Clean enough to execute, or still too early for you?
#MarketAnalysis
SUIUSDT SHORT map
Entry → 0.6896 - 0.6922
SL → 0.6989
TP → 0.6829 · 0.6764 · 0.6684
Clean enough to execute, or still too early for you?
#MarketAnalysis
16
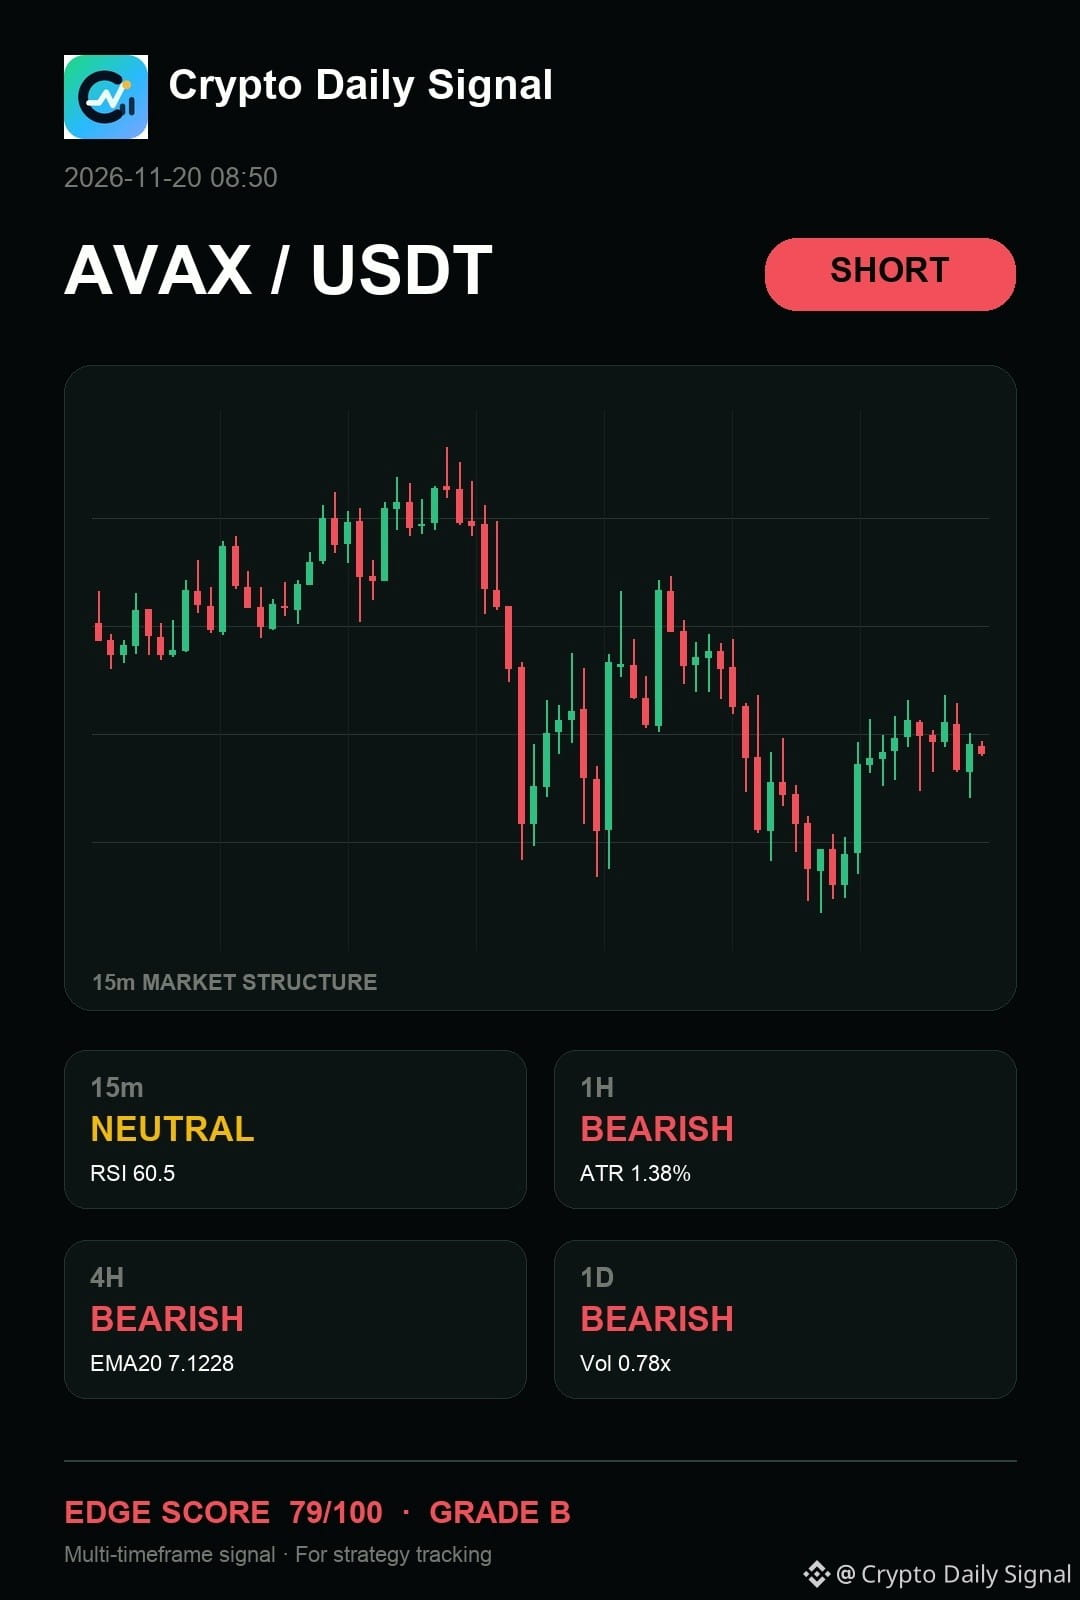
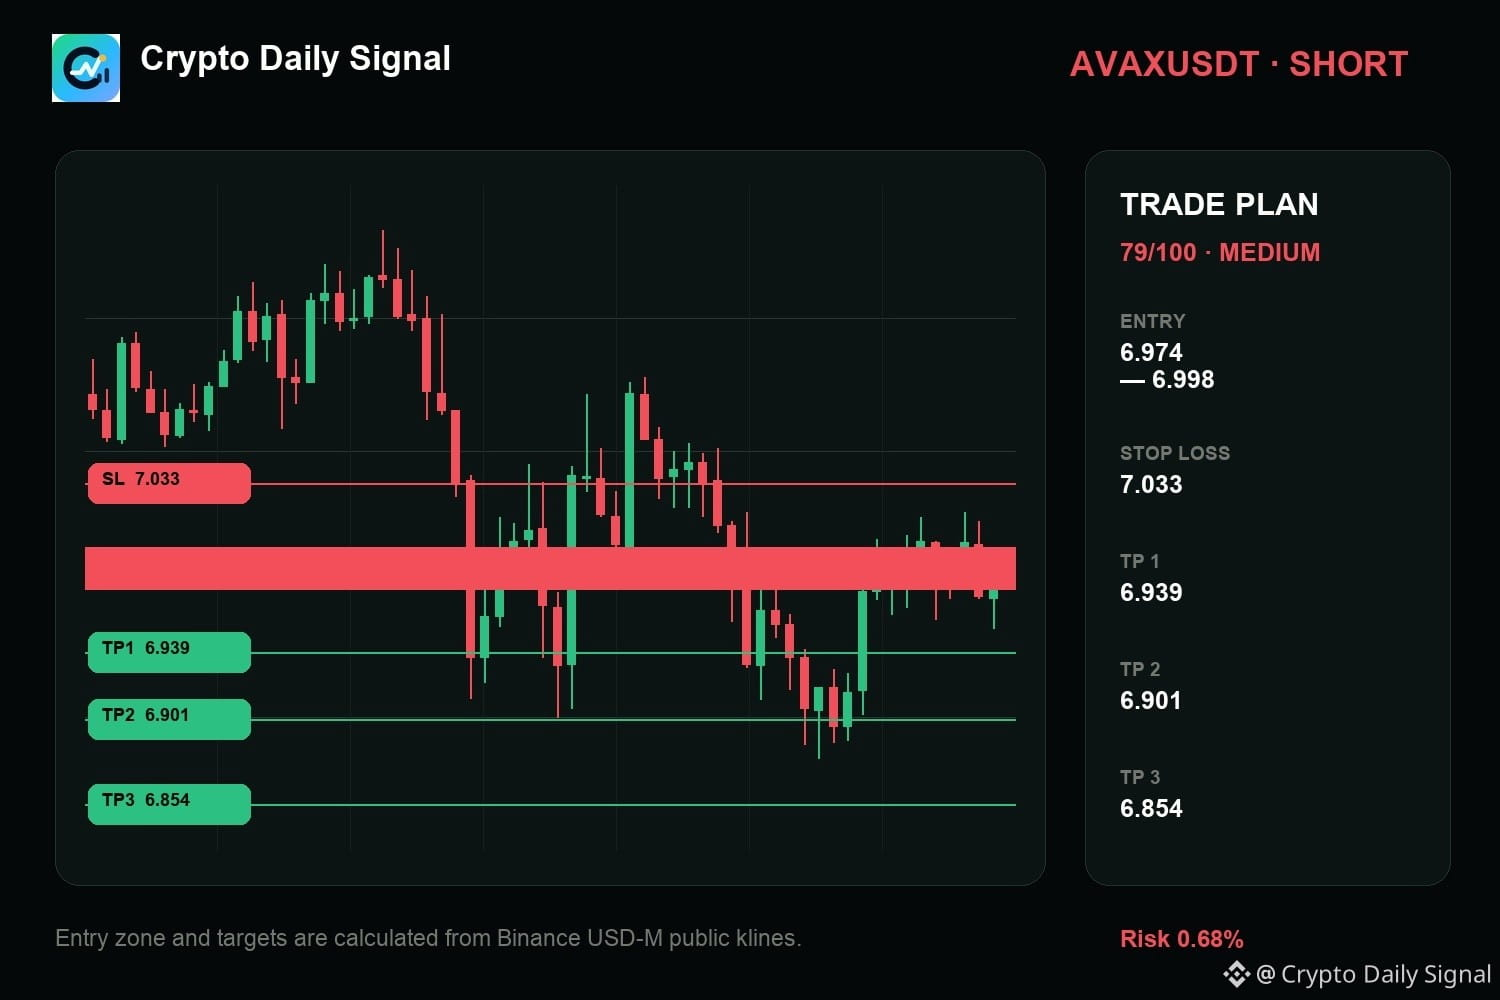
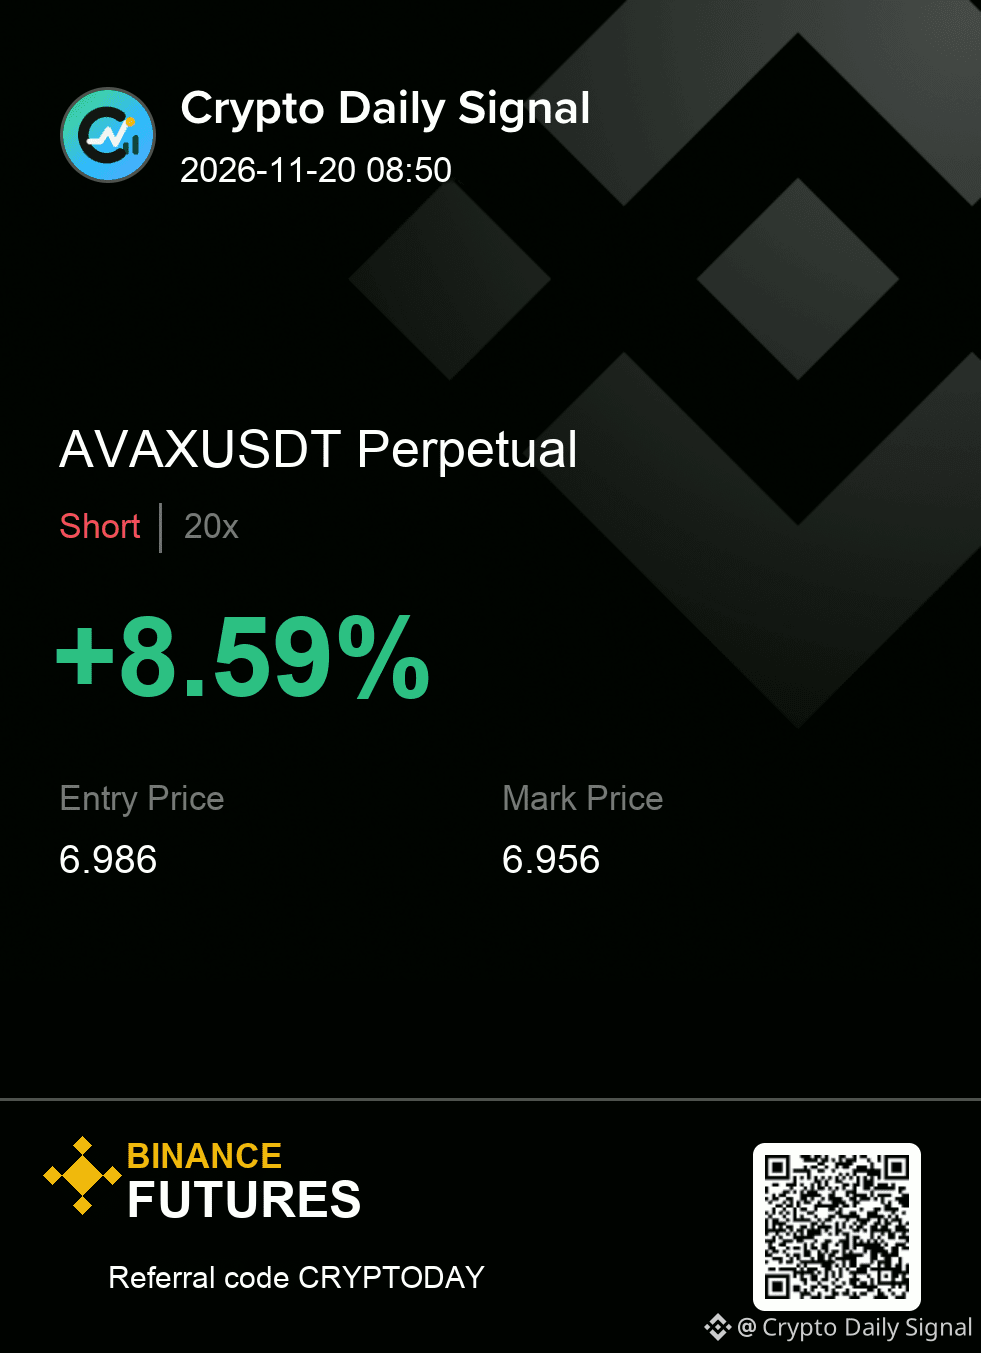
$AVAX has not invalidated the short case because although some short-term momentum appears weak, the price action is showing a solid pattern of lower highs and lower lows. The bigger picture remains bearish across the daily and four-hour charts, holding firm against the established resistance level. For this trade to look weak, we'd need a real break above that prior swing high on a strong volume day.
SHORT plan for AVAXUSDT
6.974 - 6.998 entry | 7.033 stop
6.939 → 6.901 → 6.854
Worth tracking from here, or does the range still need more time?
#MarketAnalysis
{future}(AVAXUSDT)
$AVAX has not invalidated the short case because although some short-term momentum appears weak, the price action is showing a solid pattern of lower highs and lower lows. The bigger picture remains bearish across the daily and four-hour charts, holding firm against the established resistance level. For this trade to look weak, we'd need a real break above that prior swing high on a strong volume day.
SHORT plan for AVAXUSDT
6.974 - 6.998 entry | 7.033 stop
6.939 → 6.901 → 6.854
Worth tracking from here, or does the range still need more time?
#MarketAnalysis
SHORT plan for AVAXUSDT
6.974 - 6.998 entry | 7.033 stop
6.939 → 6.901 → 6.854
Worth tracking from here, or does the range still need more time?
#MarketAnalysis
11
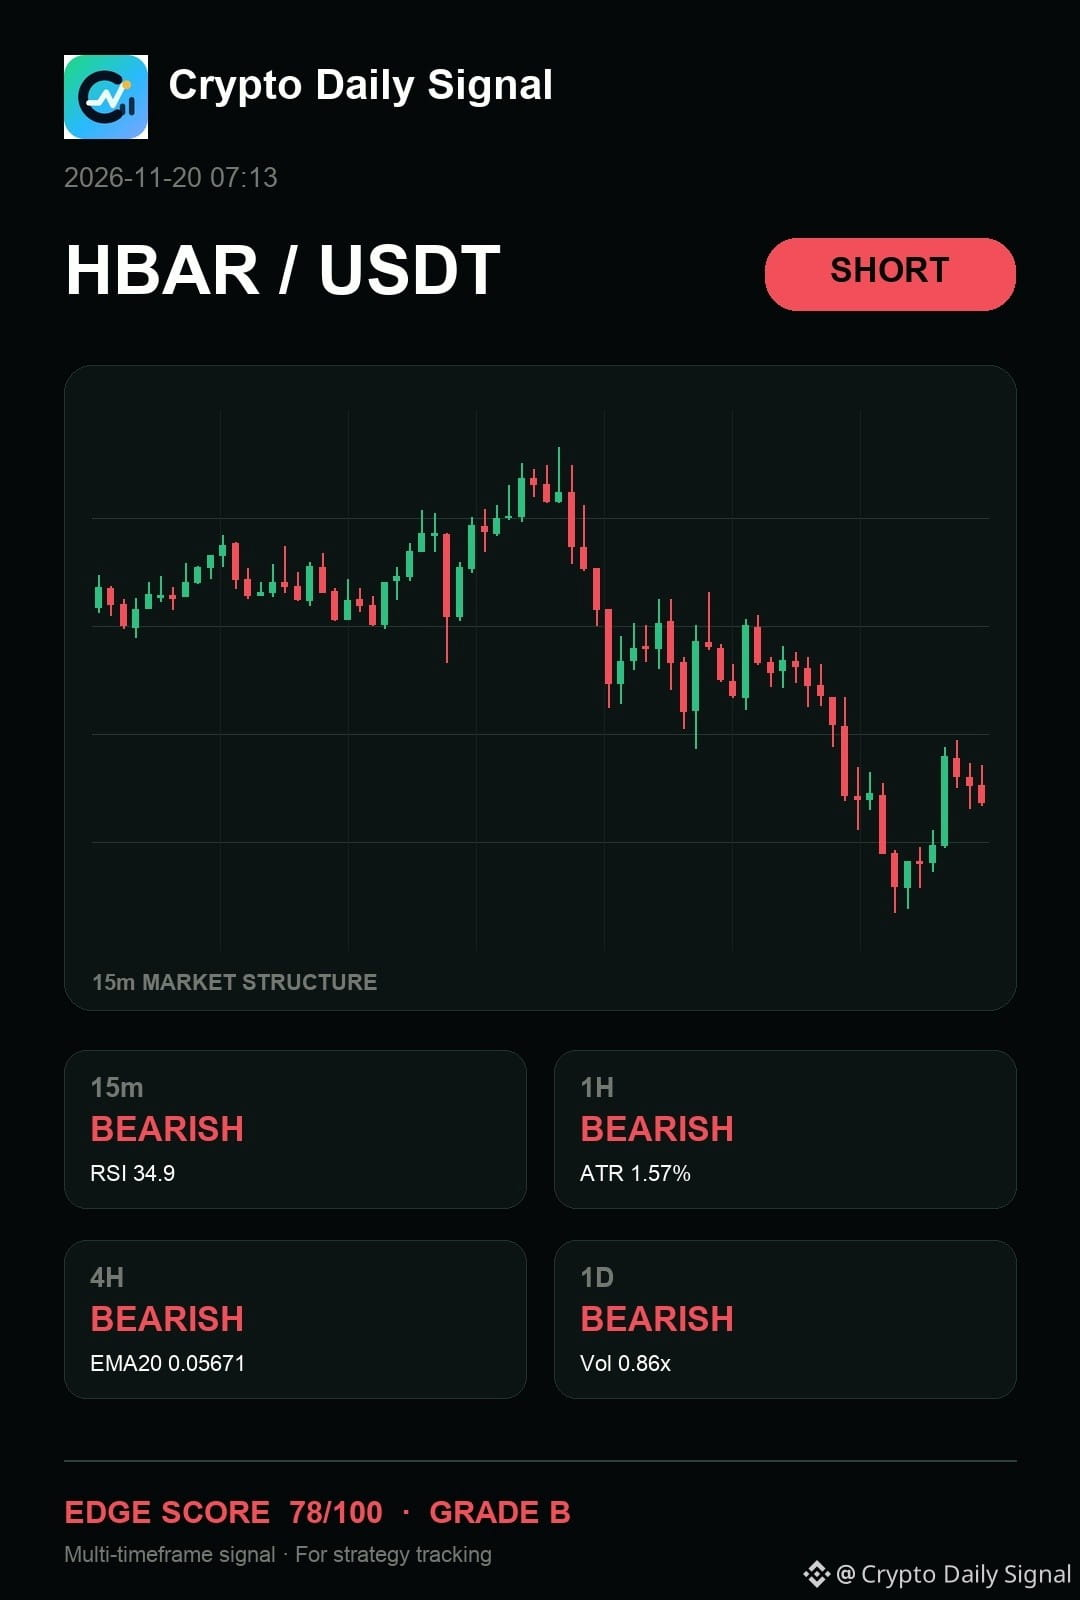
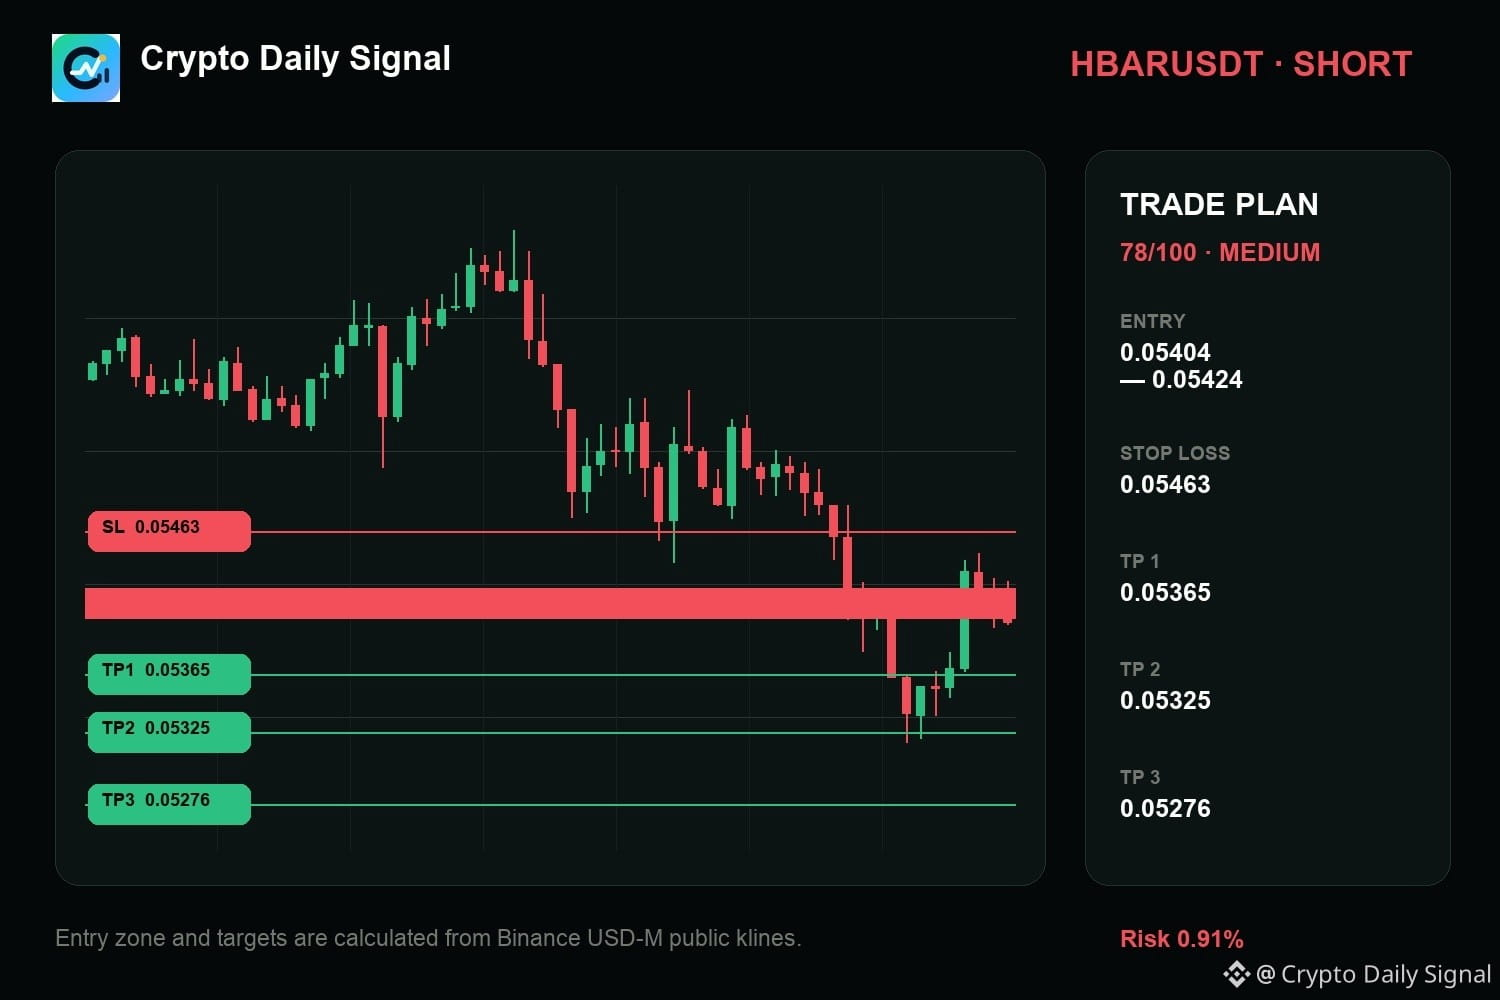
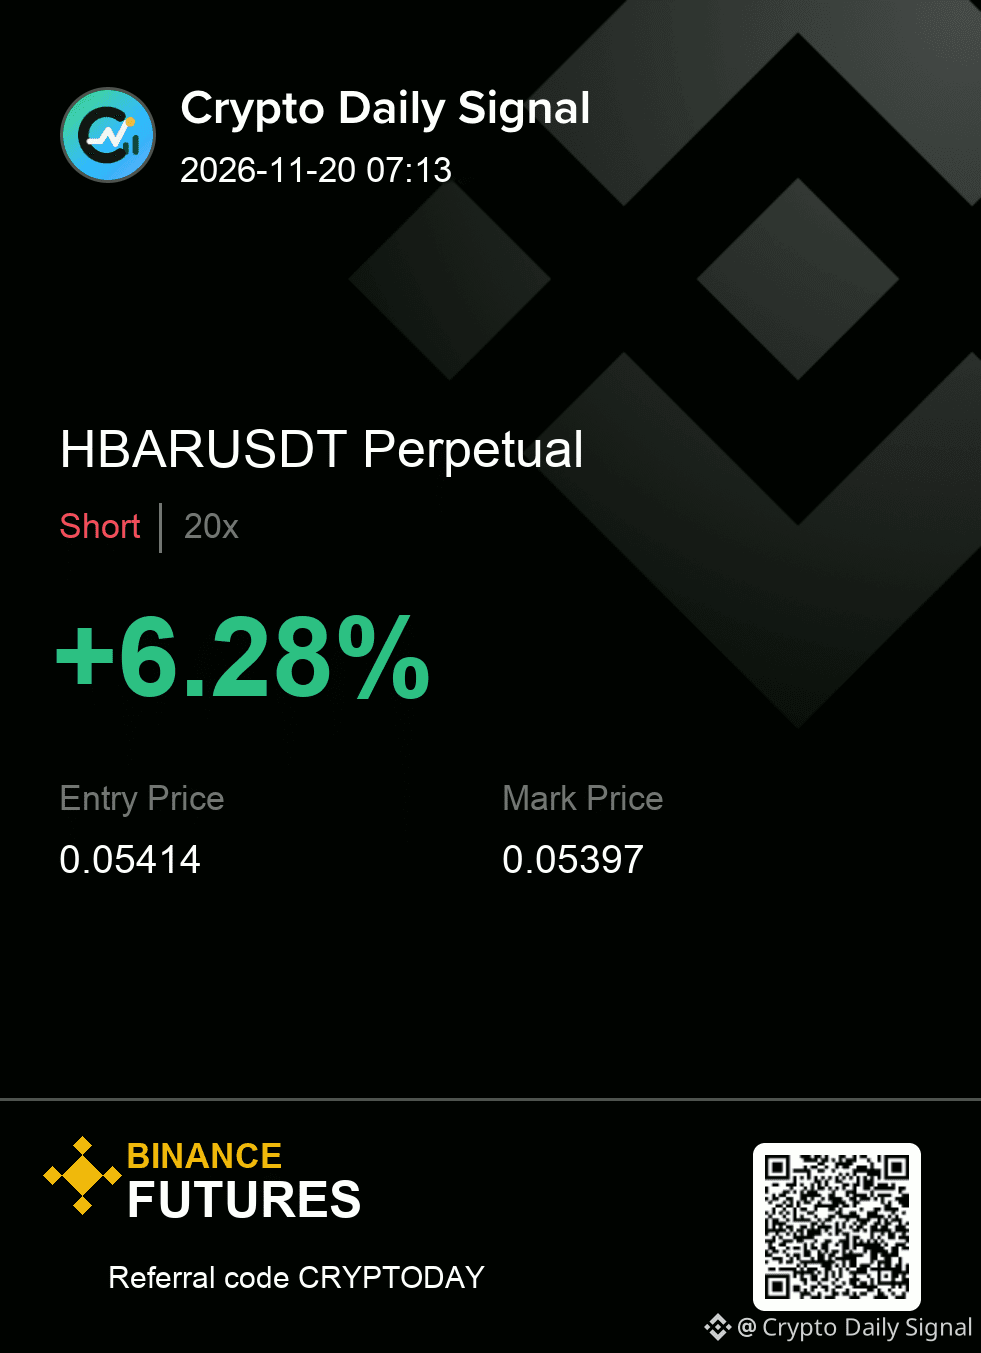
$HBAR still offers the cleaner bearish argument because the price action is tracking lower highs across the visible range, matching the bearish trend seen on the daily chart. The market is showing clear lower lows despite the tight consolidation. A decisive drop below the range floor would solidify the short thesis; a strong push past the recent swing high would invalidate the move.
My levels for HBARUSDT — SHORT
Entry zone 0.05404 - 0.05424
Risk line 0.05463
Targets 0.05365 / 0.05325 / 0.05276
#MarketAnalysis
{future}(HBARUSDT)
$HBAR still offers the cleaner bearish argument because the price action is tracking lower highs across the visible range, matching the bearish trend seen on the daily chart. The market is showing clear lower lows despite the tight consolidation. A decisive drop below the range floor would solidify the short thesis; a strong push past the recent swing high would invalidate the move.
My levels for HBARUSDT — SHORT
Entry zone 0.05404 - 0.05424
Risk line 0.05463
Targets 0.05365 / 0.05325 / 0.05276
#MarketAnalysis
My levels for HBARUSDT — SHORT
Entry zone 0.05404 - 0.05424
Risk line 0.05463
Targets 0.05365 / 0.05325 / 0.05276
#MarketAnalysis
5
·
--
Bearish
Verified
$ANT
🚀 ANTUSDT Market Analysis – November 19
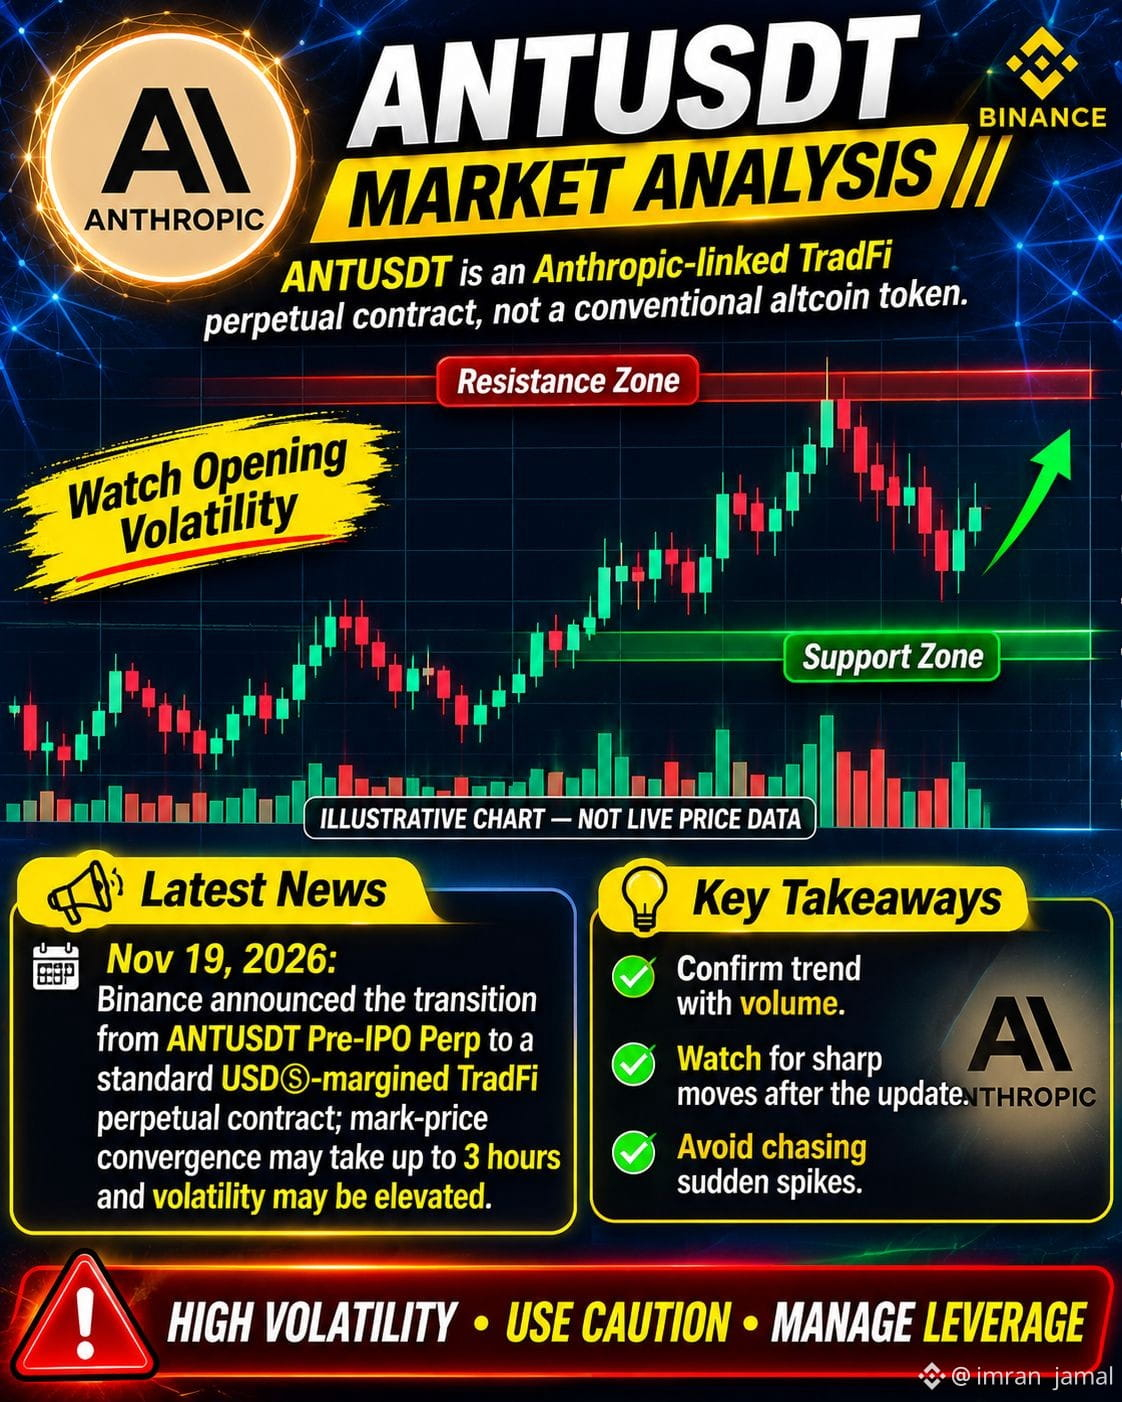
ANTUSDT is attracting attention following Anthropic's IPO. This is an Anthropic-linked TradFi perpetual contract, not a conventional altcoin.
Latest Market News:
Binance announced the transition of ANTUSDT from Pre-IPO perpetual to standard TradFi perpetual.
Mark-price adjustment may take up to 3 hours.
Significant volatility is possible during the transition.
Technical Analysis:
Watch resistance for a confirmed breakout.
Monitor support for signs of buying strength.
Confirm price direction with volume.
Avoid entering during sudden price spikes.
Market Outlook: ANTUSDT could experience sharp movements as the underlying stock begins regular trading. Wait for price stability before taking a position.
Trading Advice: Use low leverage, proper stop-loss protection and careful position sizing.
#ANTUSDT #AnthropicAI #CryptoTrading. #Benince #MarketAnalysis
{future}(ANTUSDT)
$ANT
🚀 ANTUSDT Market Analysis – November 19
ANTUSDT is attracting attention following Anthropic's IPO. This is an Anthropic-linked TradFi perpetual contract, not a conventional altcoin.
Latest Market News:
Binance announced the transition of ANTUSDT from Pre-IPO perpetual to standard TradFi perpetual.
Mark-price adjustment may take up to 3 hours.
Significant volatility is possible during the transition.
Technical Analysis:
Watch resistance for a confirmed breakout.
Monitor support for signs of buying strength.
Confirm price direction with volume.
Avoid entering during sudden price spikes.
Market Outlook: ANTUSDT could experience sharp movements as the underlying stock begins regular trading. Wait for price stability before taking a position.
Trading Advice: Use low leverage, proper stop-loss protection and careful position sizing.
#ANTUSDT #AnthropicAI #CryptoTrading. #Benince #MarketAnalysis
🚀 ANTUSDT Market Analysis – November 19
ANTUSDT is attracting attention following Anthropic's IPO. This is an Anthropic-linked TradFi perpetual contract, not a conventional altcoin.
Latest Market News:
Binance announced the transition of ANTUSDT from Pre-IPO perpetual to standard TradFi perpetual.
Mark-price adjustment may take up to 3 hours.
Significant volatility is possible during the transition.
Technical Analysis:
Watch resistance for a confirmed breakout.
Monitor support for signs of buying strength.
Confirm price direction with volume.
Avoid entering during sudden price spikes.
Market Outlook: ANTUSDT could experience sharp movements as the underlying stock begins regular trading. Wait for price stability before taking a position.
Trading Advice: Use low leverage, proper stop-loss protection and careful position sizing.
#ANTUSDT #AnthropicAI #CryptoTrading. #Benince #MarketAnalysis
869

·
--
BTC at $59,300: Midday rebound loses steam despite funding just turning positive
As of 12:00, $BTC was trading around $59,307.80, up 5.4% over 24 hours but down about $858 from the $60,165.80 recorded at 08:00. $ETH was at $1,663.94, up 6.6%, also edging down from $1,682.77. The Fear & Greed Index remained at 11, in the extreme fear zone.
The rebound from the two-year low of $55,127 is losing steam mid-session. According to a report from CryptoQuant, investors realized more than $11.3 billion in losses over seven days, around eight times the gains realized over the same period; QCP Capital believes this was mainly short-covering, not necessarily fresh buying demand. Spot BTC ETFs continued to see net outflows for a third consecutive session, at around $582 million per session, according to SoSoValue.
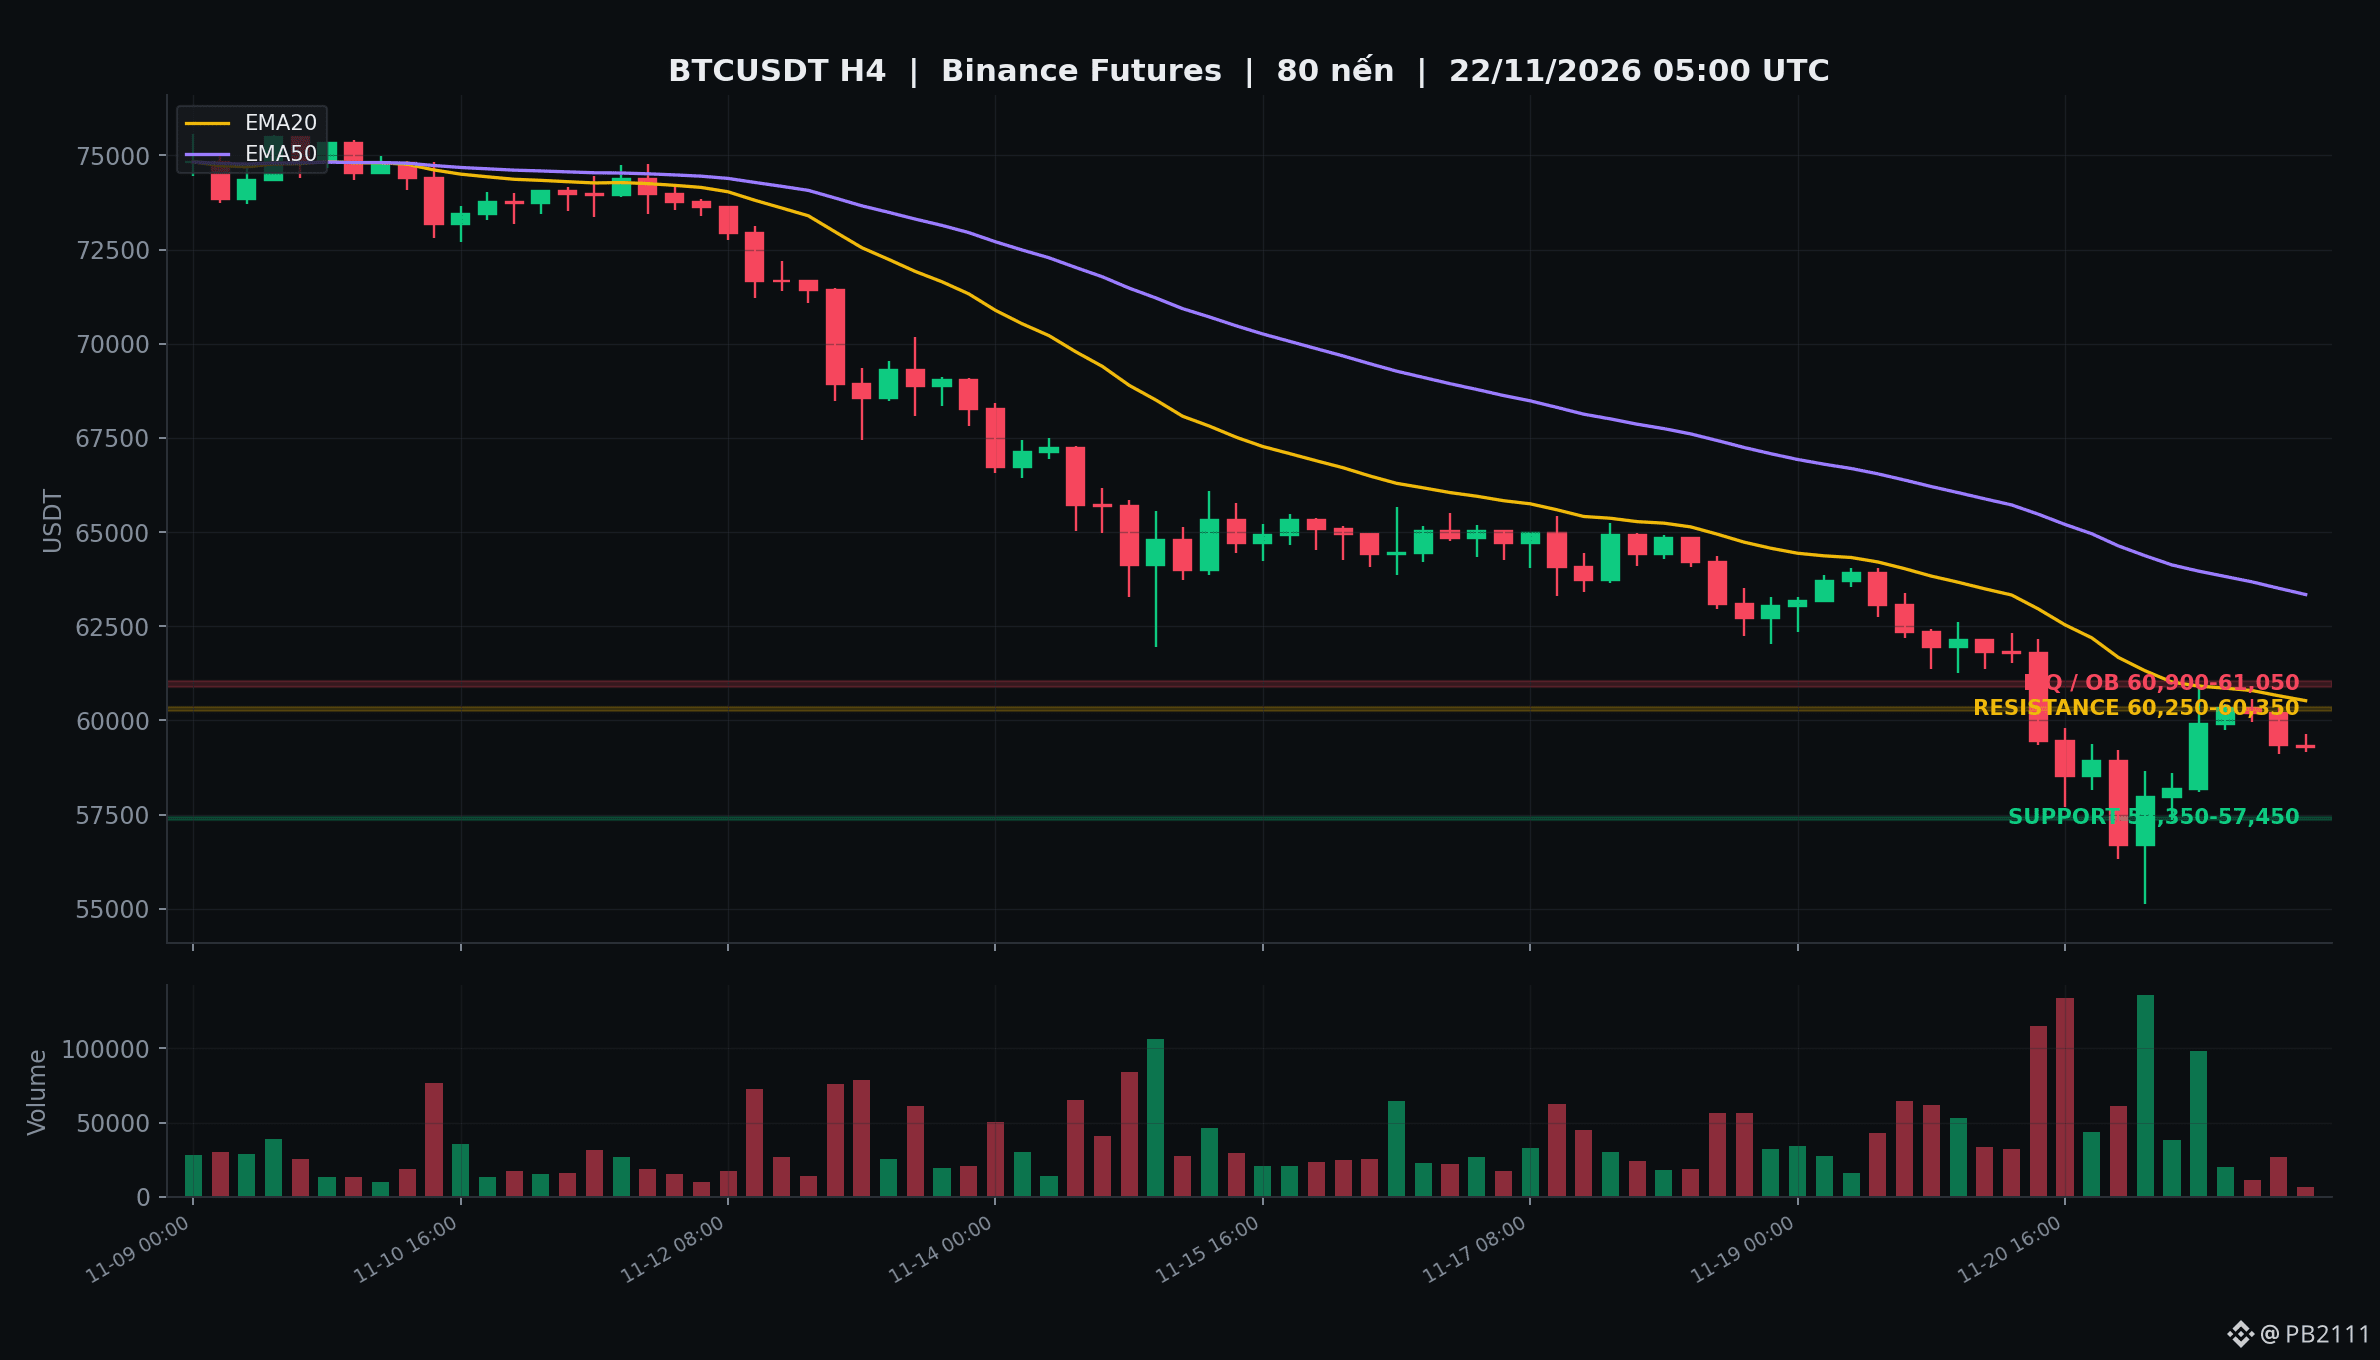
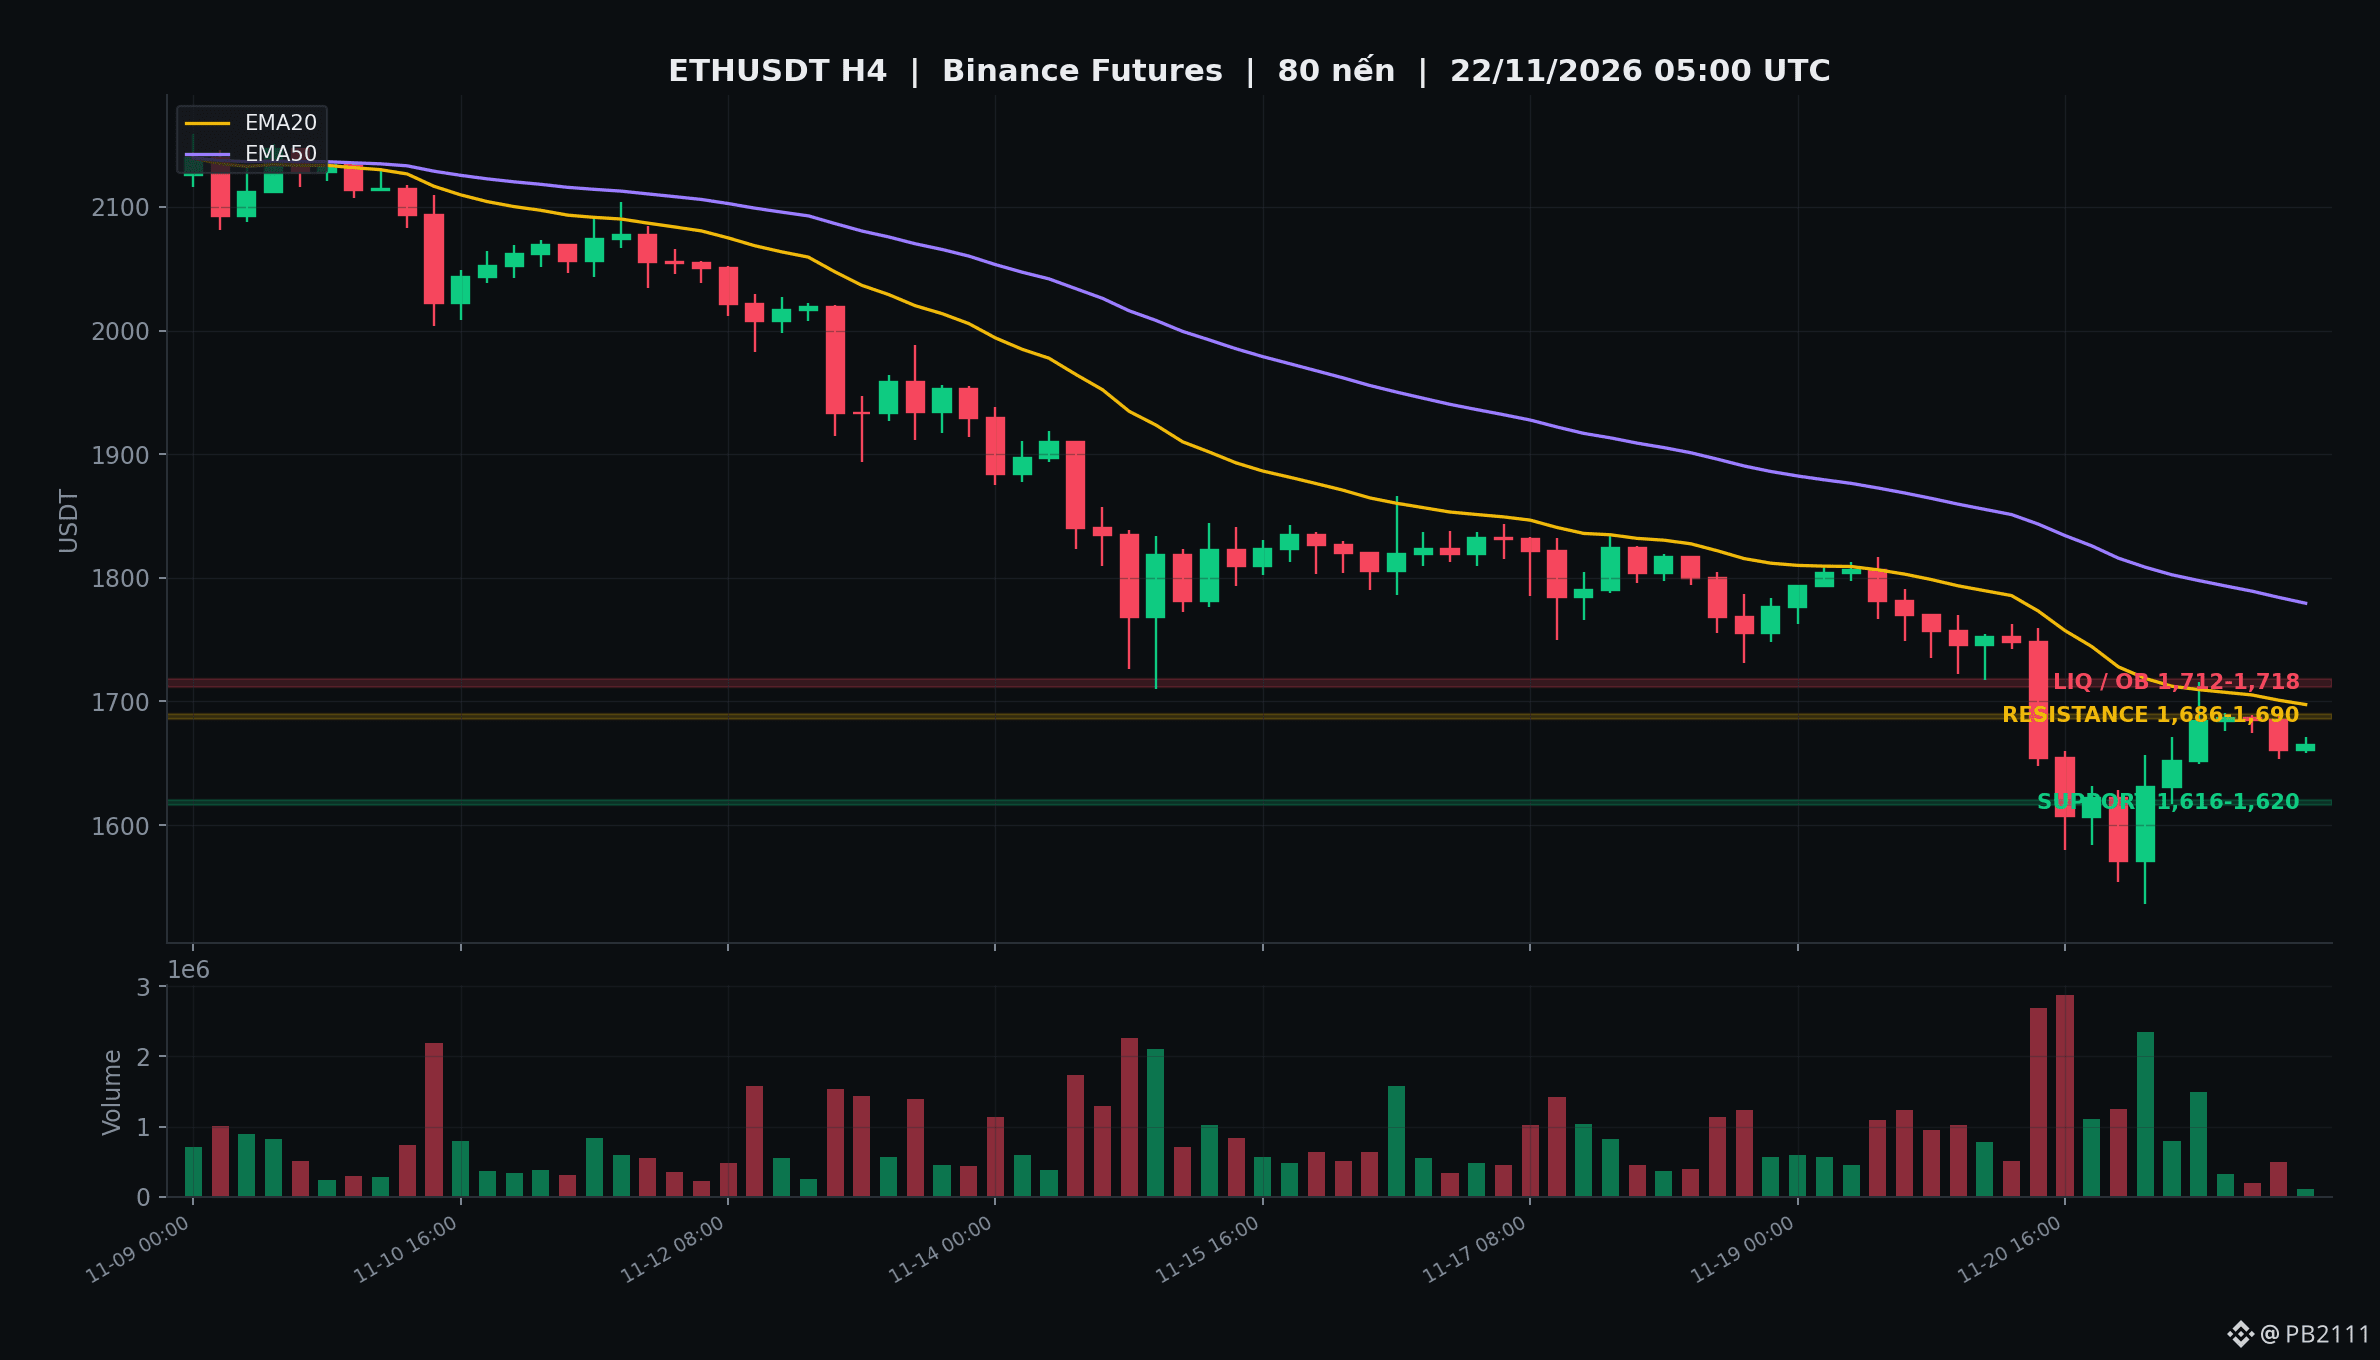
For BTC, 8-hour funding flipped from -0.0010% this morning to +0.0070%, with OI at 91,338 BTC. A notable signal is that the cost of holding positions has turned positive again. If support at 57,350–57,450 holds, the recovery structure remains intact; resistance at 60,250–60,350 coincides with the 60,978 high, with liquidity above at 60,900–61,050. For ETH, funding is +0.0003%, OI is around 2.32 million ETH, support is at 1,616–1,620, resistance at 1,686–1,690, and liquidity at 1,712–1,718.
Attached are H4 charts for BTCUSDT and ETHUSDT: EMA20/50, volume, the support zones at 57,350–57,450 (1,616–1,620 for ETH), resistance at 60,250–60,350 (1,686–1,690), and liquidity at 60,900–61,050 (1,712–1,718) are all clearly shown on the H4 timeframe.
Hold scenario: If BTC holds 57,350–57,450, it still has room to move toward 60,250–60,350. Breakdown scenario: A drop below 57,350 could lead to a retest of the 55,127 low; if ETH falls below 1,616, it could return to 1,543.
As long as ETF flows remain net negative, the recovery is still vulnerable to breaking down. Which scenario do you lean toward: holding or breaking down? $BTC $ETH #Bitcoin #Crypto #MarketAnalysis
BTC at $59,300: Midday rebound loses steam despite funding just turning positive
As of 12:00, $BTC was trading around $59,307.80, up 5.4% over 24 hours but down about $858 from the $60,165.80 recorded at 08:00. $ETH was at $1,663.94, up 6.6%, also edging down from $1,682.77. The Fear & Greed Index remained at 11, in the extreme fear zone.
The rebound from the two-year low of $55,127 is losing steam mid-session. According to a report from CryptoQuant, investors realized more than $11.3 billion in losses over seven days, around eight times the gains realized over the same period; QCP Capital believes this was mainly short-covering, not necessarily fresh buying demand. Spot BTC ETFs continued to see net outflows for a third consecutive session, at around $582 million per session, according to SoSoValue.
For BTC, 8-hour funding flipped from -0.0010% this morning to +0.0070%, with OI at 91,338 BTC. A notable signal is that the cost of holding positions has turned positive again. If support at 57,350–57,450 holds, the recovery structure remains intact; resistance at 60,250–60,350 coincides with the 60,978 high, with liquidity above at 60,900–61,050. For ETH, funding is +0.0003%, OI is around 2.32 million ETH, support is at 1,616–1,620, resistance at 1,686–1,690, and liquidity at 1,712–1,718.
Attached are H4 charts for BTCUSDT and ETHUSDT: EMA20/50, volume, the support zones at 57,350–57,450 (1,616–1,620 for ETH), resistance at 60,250–60,350 (1,686–1,690), and liquidity at 60,900–61,050 (1,712–1,718) are all clearly shown on the H4 timeframe.
Hold scenario: If BTC holds 57,350–57,450, it still has room to move toward 60,250–60,350. Breakdown scenario: A drop below 57,350 could lead to a retest of the 55,127 low; if ETH falls below 1,616, it could return to 1,543.
As long as ETF flows remain net negative, the recovery is still vulnerable to breaking down. Which scenario do you lean toward: holding or breaking down? $BTC $ETH #Bitcoin #Crypto #MarketAnalysis
As of 12:00, $BTC was trading around $59,307.80, up 5.4% over 24 hours but down about $858 from the $60,165.80 recorded at 08:00. $ETH was at $1,663.94, up 6.6%, also edging down from $1,682.77. The Fear & Greed Index remained at 11, in the extreme fear zone.
The rebound from the two-year low of $55,127 is losing steam mid-session. According to a report from CryptoQuant, investors realized more than $11.3 billion in losses over seven days, around eight times the gains realized over the same period; QCP Capital believes this was mainly short-covering, not necessarily fresh buying demand. Spot BTC ETFs continued to see net outflows for a third consecutive session, at around $582 million per session, according to SoSoValue.
For BTC, 8-hour funding flipped from -0.0010% this morning to +0.0070%, with OI at 91,338 BTC. A notable signal is that the cost of holding positions has turned positive again. If support at 57,350–57,450 holds, the recovery structure remains intact; resistance at 60,250–60,350 coincides with the 60,978 high, with liquidity above at 60,900–61,050. For ETH, funding is +0.0003%, OI is around 2.32 million ETH, support is at 1,616–1,620, resistance at 1,686–1,690, and liquidity at 1,712–1,718.
Attached are H4 charts for BTCUSDT and ETHUSDT: EMA20/50, volume, the support zones at 57,350–57,450 (1,616–1,620 for ETH), resistance at 60,250–60,350 (1,686–1,690), and liquidity at 60,900–61,050 (1,712–1,718) are all clearly shown on the H4 timeframe.
Hold scenario: If BTC holds 57,350–57,450, it still has room to move toward 60,250–60,350. Breakdown scenario: A drop below 57,350 could lead to a retest of the 55,127 low; if ETH falls below 1,616, it could return to 1,543.
As long as ETF flows remain net negative, the recovery is still vulnerable to breaking down. Which scenario do you lean toward: holding or breaking down? $BTC $ETH #Bitcoin #Crypto #MarketAnalysis
338

🚨 BITCOIN BELOW $63,000! IS THE MARKET HEADING LOWER?
Crypto traders are watching closely as Bitcoin faces renewed selling pressure.
📉 Market Update — November 19:
- $BTC dropped below the $63K level.
- $ETH slipped below $1,800.
- The market is reacting to hawkish Federal Reserve signals.
- BTC's key support zone: $62,000.
- Important recovery zone: $65,000–$66,000.
⚠️ If Bitcoin fails to hold support, further downside pressure may follow. A recovery above resistance could improve short-term sentiment.
The next move could set the tone for the broader crypto market.
👇 What do you think?
Will BTC recover above $65K, or fall toward $60K?
#Bitcoin #CryptoNews #MarketAnalysis #CryptoTitans #BinanceSquare
DYOR. Not financial advice.
🚨 BITCOIN BELOW $63,000! IS THE MARKET HEADING LOWER?
Crypto traders are watching closely as Bitcoin faces renewed selling pressure.
📉 Market Update — November 19:
- $BTC dropped below the $63K level.
- $ETH slipped below $1,800.
- The market is reacting to hawkish Federal Reserve signals.
- BTC's key support zone: $62,000.
- Important recovery zone: $65,000–$66,000.
⚠️ If Bitcoin fails to hold support, further downside pressure may follow. A recovery above resistance could improve short-term sentiment.
The next move could set the tone for the broader crypto market.
👇 What do you think?
Will BTC recover above $65K, or fall toward $60K?
#Bitcoin #CryptoNews #MarketAnalysis #CryptoTitans #BinanceSquare
DYOR. Not financial advice.
Crypto traders are watching closely as Bitcoin faces renewed selling pressure.
📉 Market Update — November 19:
- $BTC dropped below the $63K level.
- $ETH slipped below $1,800.
- The market is reacting to hawkish Federal Reserve signals.
- BTC's key support zone: $62,000.
- Important recovery zone: $65,000–$66,000.
⚠️ If Bitcoin fails to hold support, further downside pressure may follow. A recovery above resistance could improve short-term sentiment.
The next move could set the tone for the broader crypto market.
👇 What do you think?
Will BTC recover above $65K, or fall toward $60K?
#Bitcoin #CryptoNews #MarketAnalysis #CryptoTitans #BinanceSquare
DYOR. Not financial advice.

Moolish:
Daily TD 13 already printed. I'd watch 62k on the close
2
1
100

·
--
Bullish
🚨 $BTC BITCOIN MARKET UPDATE | NOVEMBER 19, 2026
📉 BITCOIN BELOW $63,000 — BEARS ARE TAKING CONTROL!
Bitcoin is facing renewed selling pressure as macroeconomic uncertainty and market weakness continue to affect investor sentiment.
📊 MARKET OVERVIEW:
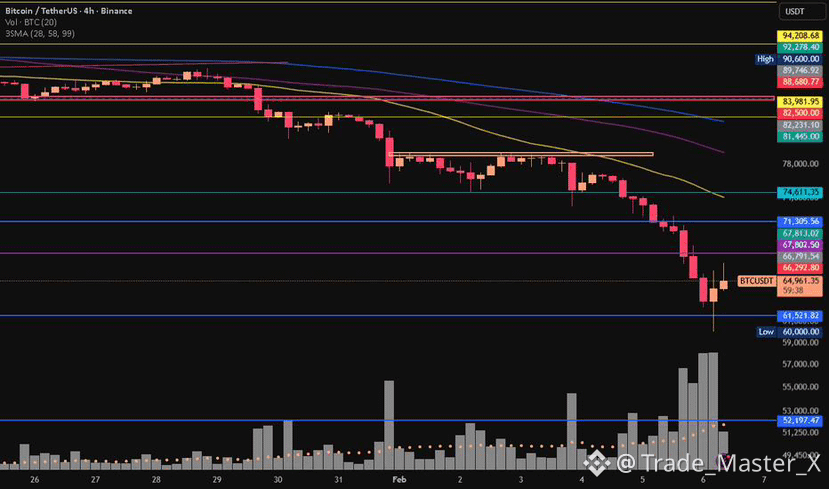
💰 BTC Price: Around $62,700
🔻 24H Change: -3.42%
📉 Market Sentiment: Bearish
🔴 WHY IS BITCOIN FALLING?
1️⃣ Hawkish Federal Reserve expectations are putting pressure on risk assets.
2️⃣ Bitcoin miners are adding selling pressure to the market.
3️⃣ Weak market sentiment is limiting buying momentum.
📍 IMPORTANT PRICE LEVELS:
🟢 SUPPORT ZONES:
$62,000
$60,400
🔴 RESISTANCE ZONES:
$63,300
$63,900
$64,700
📉 BEARISH SCENARIO:
If BTC fails to reclaim $63,300 and breaks below $62,000, further downside pressure could develop.
📈 BULLISH SCENARIO:
If buyers reclaim $63,300 and maintain momentum, BTC could attempt a recovery toward $63,900–$64,700.
🎯 MY MARKET BIAS: BEARISH
I will be watching the $62,000 support zone very closely.
💬 LET’S DISCUSS!
Do you think Bitcoin will:
🔴 Drop toward $60,400?
🟢 Recover above $64,000?
Share your prediction in the comments!
Follow @Trade_Master_X for daily Bitcoin updates and professional crypto market analysis.
⚠️ Educational content only. Not financial advice. Always do your own research.
#bitcoin #BTC #CryptoNews #MarketAnalysis #BinanceSquare
{spot}(BTCUSDT)
🚨 $BTC BITCOIN MARKET UPDATE | NOVEMBER 19, 2026
📉 BITCOIN BELOW $63,000 — BEARS ARE TAKING CONTROL!
Bitcoin is facing renewed selling pressure as macroeconomic uncertainty and market weakness continue to affect investor sentiment.
📊 MARKET OVERVIEW:
💰 BTC Price: Around $62,700
🔻 24H Change: -3.42%
📉 Market Sentiment: Bearish
🔴 WHY IS BITCOIN FALLING?
1️⃣ Hawkish Federal Reserve expectations are putting pressure on risk assets.
2️⃣ Bitcoin miners are adding selling pressure to the market.
3️⃣ Weak market sentiment is limiting buying momentum.
📍 IMPORTANT PRICE LEVELS:
🟢 SUPPORT ZONES:
$62,000
$60,400
🔴 RESISTANCE ZONES:
$63,300
$63,900
$64,700
📉 BEARISH SCENARIO:
If BTC fails to reclaim $63,300 and breaks below $62,000, further downside pressure could develop.
📈 BULLISH SCENARIO:
If buyers reclaim $63,300 and maintain momentum, BTC could attempt a recovery toward $63,900–$64,700.
🎯 MY MARKET BIAS: BEARISH
I will be watching the $62,000 support zone very closely.
💬 LET’S DISCUSS!
Do you think Bitcoin will:
🔴 Drop toward $60,400?
🟢 Recover above $64,000?
Share your prediction in the comments!
Follow @Trade_Master_X for daily Bitcoin updates and professional crypto market analysis.
⚠️ Educational content only. Not financial advice. Always do your own research.
#bitcoin #BTC #CryptoNews #MarketAnalysis #BinanceSquare
📉 BITCOIN BELOW $63,000 — BEARS ARE TAKING CONTROL!
Bitcoin is facing renewed selling pressure as macroeconomic uncertainty and market weakness continue to affect investor sentiment.
📊 MARKET OVERVIEW:
💰 BTC Price: Around $62,700
🔻 24H Change: -3.42%
📉 Market Sentiment: Bearish
🔴 WHY IS BITCOIN FALLING?
1️⃣ Hawkish Federal Reserve expectations are putting pressure on risk assets.
2️⃣ Bitcoin miners are adding selling pressure to the market.
3️⃣ Weak market sentiment is limiting buying momentum.
📍 IMPORTANT PRICE LEVELS:
🟢 SUPPORT ZONES:
$62,000
$60,400
🔴 RESISTANCE ZONES:
$63,300
$63,900
$64,700
📉 BEARISH SCENARIO:
If BTC fails to reclaim $63,300 and breaks below $62,000, further downside pressure could develop.
📈 BULLISH SCENARIO:
If buyers reclaim $63,300 and maintain momentum, BTC could attempt a recovery toward $63,900–$64,700.
🎯 MY MARKET BIAS: BEARISH
I will be watching the $62,000 support zone very closely.
💬 LET’S DISCUSS!
Do you think Bitcoin will:
🔴 Drop toward $60,400?
🟢 Recover above $64,000?
Share your prediction in the comments!
Follow @Trade_Master_X for daily Bitcoin updates and professional crypto market analysis.
⚠️ Educational content only. Not financial advice. Always do your own research.
#bitcoin #BTC #CryptoNews #MarketAnalysis #BinanceSquare
1
162

·
--
🚨 BITCOIN AT A CRITICAL TURNING POINT: RECOVERY OR ANOTHER DROP?
Bitcoin has fallen from $87,400 toward $62,000, facing significant selling pressure.
Several factors are increasing market uncertainty:
🔴 Institutional ETF outflows are weakening demand.
🔴 Large-holder exchange inflows are raising potential selling concerns.
🔴 Fed rate uncertainty is putting pressure on risk assets.
🔴 Declining stablecoin liquidity is making market recovery more difficult.
KEY BTC LEVELS:
Support: $62,000 / $60,000 / $58,500
Resistance: $66,300 / $68,000 / $74,100
A recovery above $66,300 could improve market sentiment. However, losing $62,000 on a daily closing basis could expose Bitcoin to further downside.
MY VIEW:
Bitcoin is approaching a critical decision point. The next major move will depend on institutional demand, market liquidity and whether buyers can defend current support levels.
Is this a potential market bottom, or are we facing another wave of selling?
#Bitcoin #BTC #CryptoMarket #Binance #MarketAnalysis
🚨 BITCOIN AT A CRITICAL TURNING POINT: RECOVERY OR ANOTHER DROP?
Bitcoin has fallen from $87,400 toward $62,000, facing significant selling pressure.
Several factors are increasing market uncertainty:
🔴 Institutional ETF outflows are weakening demand.
🔴 Large-holder exchange inflows are raising potential selling concerns.
🔴 Fed rate uncertainty is putting pressure on risk assets.
🔴 Declining stablecoin liquidity is making market recovery more difficult.
KEY BTC LEVELS:
Support: $62,000 / $60,000 / $58,500
Resistance: $66,300 / $68,000 / $74,100
A recovery above $66,300 could improve market sentiment. However, losing $62,000 on a daily closing basis could expose Bitcoin to further downside.
MY VIEW:
Bitcoin is approaching a critical decision point. The next major move will depend on institutional demand, market liquidity and whether buyers can defend current support levels.
Is this a potential market bottom, or are we facing another wave of selling?
#Bitcoin #BTC #CryptoMarket #Binance #MarketAnalysis
Bitcoin has fallen from $87,400 toward $62,000, facing significant selling pressure.
Several factors are increasing market uncertainty:
🔴 Institutional ETF outflows are weakening demand.
🔴 Large-holder exchange inflows are raising potential selling concerns.
🔴 Fed rate uncertainty is putting pressure on risk assets.
🔴 Declining stablecoin liquidity is making market recovery more difficult.
KEY BTC LEVELS:
Support: $62,000 / $60,000 / $58,500
Resistance: $66,300 / $68,000 / $74,100
A recovery above $66,300 could improve market sentiment. However, losing $62,000 on a daily closing basis could expose Bitcoin to further downside.
MY VIEW:
Bitcoin is approaching a critical decision point. The next major move will depend on institutional demand, market liquidity and whether buyers can defend current support levels.
Is this a potential market bottom, or are we facing another wave of selling?
#Bitcoin #BTC #CryptoMarket #Binance #MarketAnalysis

3
186

·
--
Bearish
#CryptoTradingInsights #BTC #marketanalysis
🔴 BITCOIN FALLS TO $60,185: Psychological fear or technical test? ⚠️
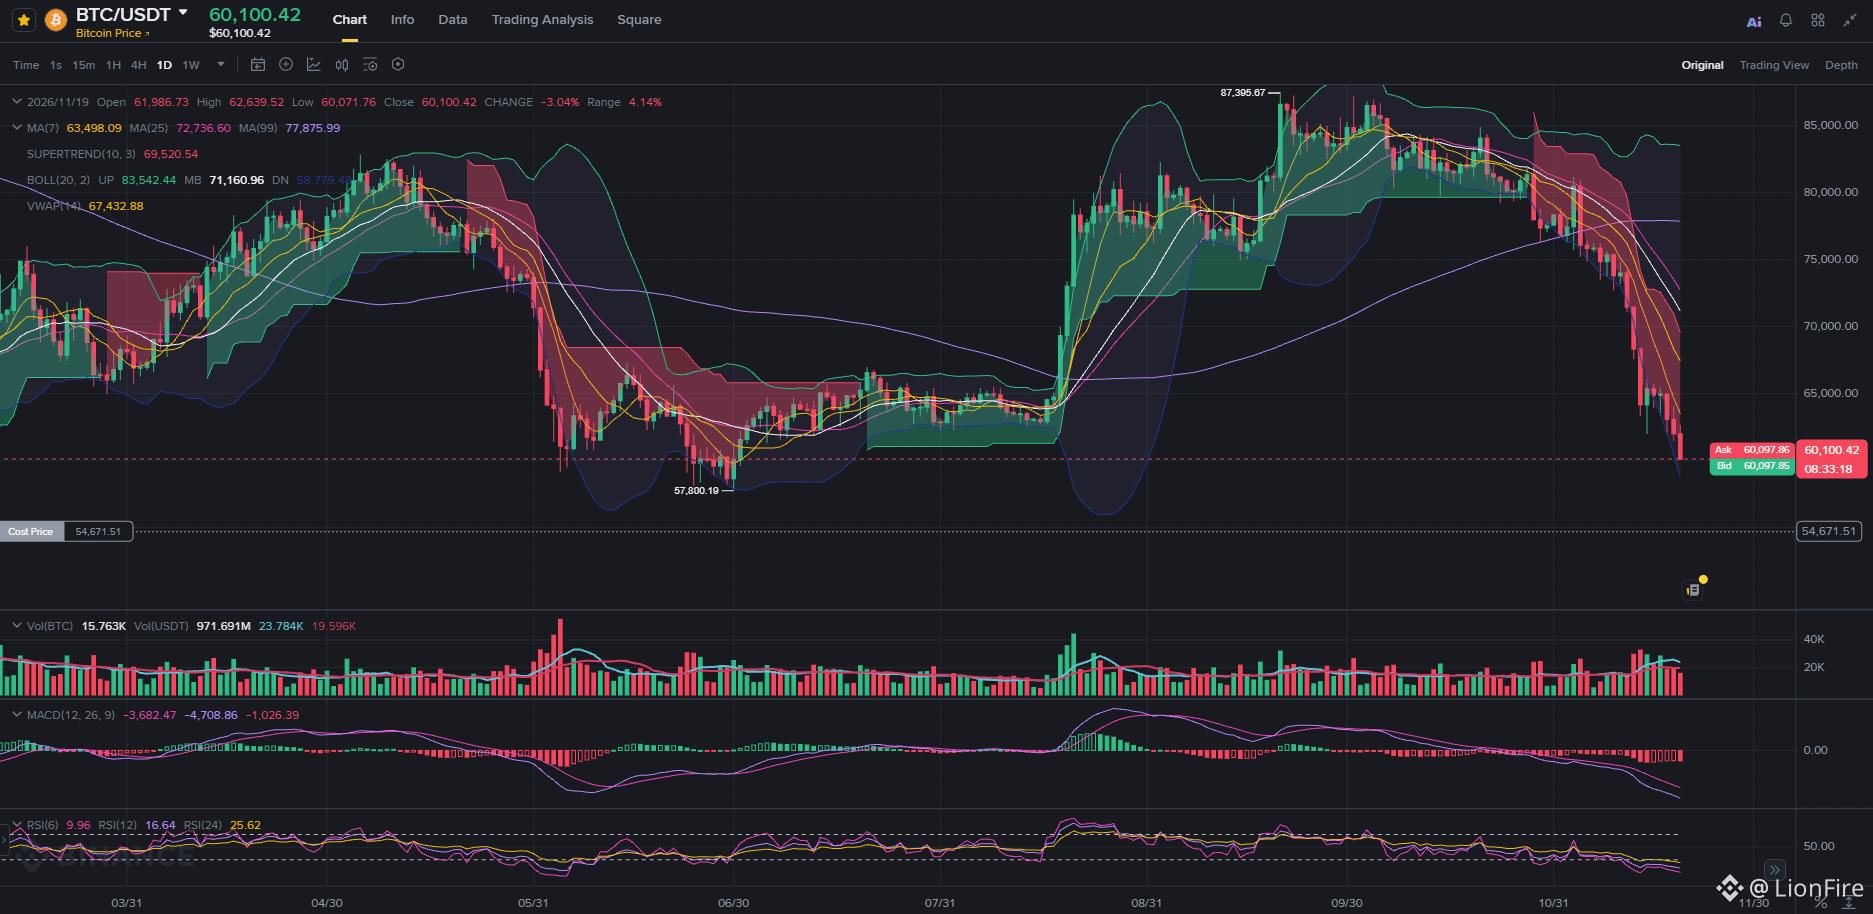
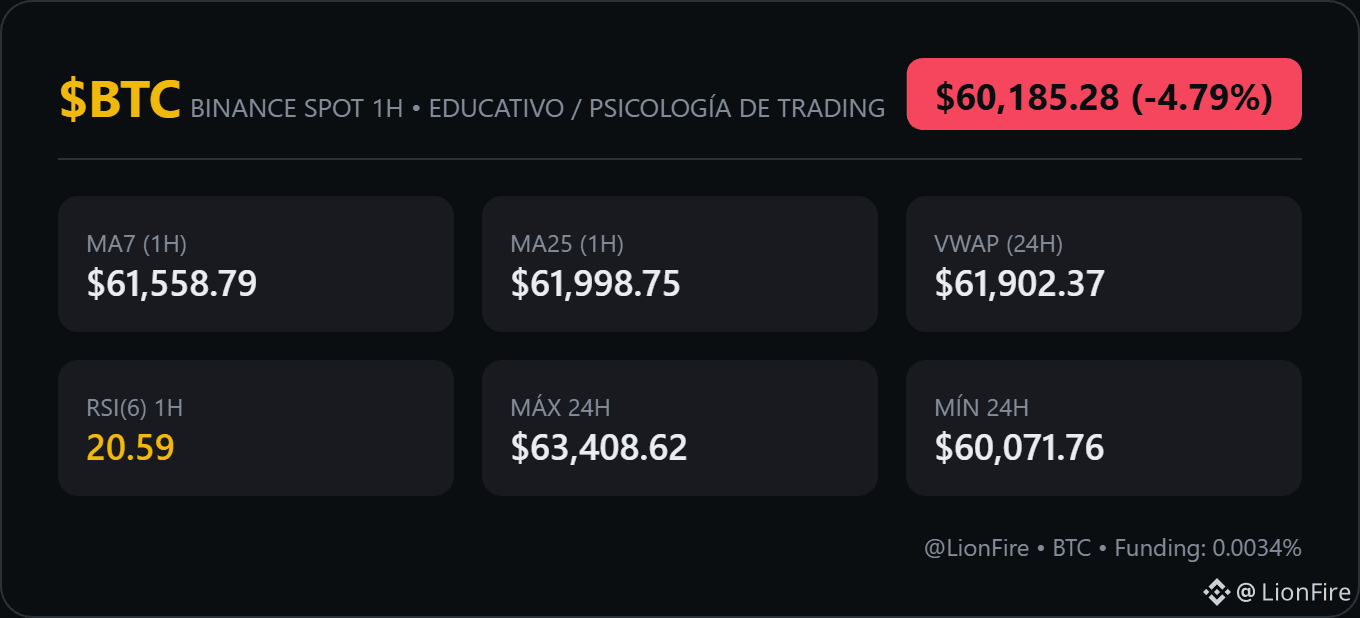
Bitcoin ($BTC) has been steadily declining after reaching a high of $63,408.62 in the past 24 hours, and is now at $60,185.28, putting immediate support at the 24-hour low ($60,071.76) under pressure. This decline reflects psychological tension among traders who, following Anthropic's initial public offering, see a potential technical test for the market.
📊 1. 1H technical breakdown:
🟢 Price compressed: The price is below the MA7 ($61,558.79) and the MA25 ($61,998.75), suggesting downward pressure beyond the usual movement.
🛡️ RSI in technical oversold territory: The 1H RSI(6) is at 20.59, marking a classic oversold zone, which could be a turning point if the price finds solid support.
⚖️ VWAP as a key reference: The 24h VWAP ($61,902.37) serves as an important reference for traders looking for entry points within the market structure.
⚠️ 2. The psychological fear behind the decline:
Bitcoin's decline is not just a technical correction, but a sign of emotional tension in the market. Traders are nervous, and volatility is rising, which could lead to impulsive liquidations if the price breaks 24-hour support.
🔥And the question remains: will it keep falling to the average price, or will it stop and trade sideways around 56K?
💡 The key to making the most of this moment isn't chasing the declines, but recognizing them as opportunities with a clear structure. Be patient and avoid catching falling knives.
#CryptoTradingInsights #BTC #marketanalysis
🔴 BITCOIN FALLS TO $60,185: Psychological fear or technical test? ⚠️
Bitcoin ($BTC) has been steadily declining after reaching a high of $63,408.62 in the past 24 hours, and is now at $60,185.28, putting immediate support at the 24-hour low ($60,071.76) under pressure. This decline reflects psychological tension among traders who, following Anthropic's initial public offering, see a potential technical test for the market.
📊 1. 1H technical breakdown:
🟢 Price compressed: The price is below the MA7 ($61,558.79) and the MA25 ($61,998.75), suggesting downward pressure beyond the usual movement.
🛡️ RSI in technical oversold territory: The 1H RSI(6) is at 20.59, marking a classic oversold zone, which could be a turning point if the price finds solid support.
⚖️ VWAP as a key reference: The 24h VWAP ($61,902.37) serves as an important reference for traders looking for entry points within the market structure.
⚠️ 2. The psychological fear behind the decline:
Bitcoin's decline is not just a technical correction, but a sign of emotional tension in the market. Traders are nervous, and volatility is rising, which could lead to impulsive liquidations if the price breaks 24-hour support.
🔥And the question remains: will it keep falling to the average price, or will it stop and trade sideways around 56K?
💡 The key to making the most of this moment isn't chasing the declines, but recognizing them as opportunities with a clear structure. Be patient and avoid catching falling knives.
🔴 BITCOIN FALLS TO $60,185: Psychological fear or technical test? ⚠️
Bitcoin ($BTC) has been steadily declining after reaching a high of $63,408.62 in the past 24 hours, and is now at $60,185.28, putting immediate support at the 24-hour low ($60,071.76) under pressure. This decline reflects psychological tension among traders who, following Anthropic's initial public offering, see a potential technical test for the market.
📊 1. 1H technical breakdown:
🟢 Price compressed: The price is below the MA7 ($61,558.79) and the MA25 ($61,998.75), suggesting downward pressure beyond the usual movement.
🛡️ RSI in technical oversold territory: The 1H RSI(6) is at 20.59, marking a classic oversold zone, which could be a turning point if the price finds solid support.
⚖️ VWAP as a key reference: The 24h VWAP ($61,902.37) serves as an important reference for traders looking for entry points within the market structure.
⚠️ 2. The psychological fear behind the decline:
Bitcoin's decline is not just a technical correction, but a sign of emotional tension in the market. Traders are nervous, and volatility is rising, which could lead to impulsive liquidations if the price breaks 24-hour support.
🔥And the question remains: will it keep falling to the average price, or will it stop and trade sideways around 56K?
💡 The key to making the most of this moment isn't chasing the declines, but recognizing them as opportunities with a clear structure. Be patient and avoid catching falling knives.
1
78
Log in to explore more content
Join global crypto users on Binance Square
⚡️ Get latest and useful information about crypto.
💬 Trusted by the world’s largest crypto exchange.
👍 Discover real insights from verified creators.
Email / Phone number
Trending Topics
1
#BTCReboundsAbove$60KAmidWhaleDipBuying
31,465 views
181 Discussing
2
#SolanaSets2027RoadmapToDoubleComputeCapacity
15,737 views
426 Discussing
3
#CaliforniaNvidiaProbeExaminesPotentialCriminalViolations
4,617 views
61 Discussing
4
#BlackRockLaunchesHKDollarDigitalLiquidityFund
11,377 views
346 Discussing
5
#NvidiaLoses$2.7TrillionInMonthAndAHalf
58,939 views
263 Discussing
6
#GlobalStocksFaceLongestLosingStreakSince2023
483,441 views
3,076 Discussing
7
#BlackRockIBITPostsRecord$541MSingleDayOutflow
76,921 views
159 Discussing
8
#AnthropicPlungesTowardIPOPriceonDay2
263,483 views
2,047 Discussing
9
#TwentyOneCapitalAdds172.25BTC
131,625 views
1,376 Discussing
10
#HKBillWouldExcludeTokenizedDepositsFromVirtualAssets
16,220 views
95 Discussing