
#marketanalysis
marketanalysis
10.8M views
70,633 Discussing
Hot
Latest

🌍 THE ENTIRE MARKET IS TURNING RED. BUT IS THIS THE END OF THE BULL RUN OR THE START OF A BIGGER OPPORTUNITY?
Crypto, stocks and other risk assets are facing heavy selling pressure. Fear is spreading, investors are becoming impatient, and everyone seems to be searching for the bottom.
But markets don't move in one direction forever.
Bitcoin is testing major lows, altcoins are under pressure, and investors are becoming increasingly defensive.
Here's how I'm looking at the bigger picture:
Bitcoin: A recovery could restore confidence across crypto. Another breakdown could bring more selling.
Altcoins: Weak projects may struggle, while fundamentally strong assets could attract attention when sentiment improves.
Stocks: If risk appetite remains weak, recovery could take longer than expected.
My opinion: I'm not treating every red candle as the end of the market. Corrections can create opportunities, but patience and capital preservation matter.
The real question is: Are we witnessing a temporary correction or the beginning of a much bigger market reset?
#Crypto #stockmarket #trading #MarketAnalysis #TwentyOneCapitalAdds172.25BTC
🌍 THE ENTIRE MARKET IS TURNING RED. BUT IS THIS THE END OF THE BULL RUN OR THE START OF A BIGGER OPPORTUNITY?
Crypto, stocks and other risk assets are facing heavy selling pressure. Fear is spreading, investors are becoming impatient, and everyone seems to be searching for the bottom.
But markets don't move in one direction forever.
Bitcoin is testing major lows, altcoins are under pressure, and investors are becoming increasingly defensive.
Here's how I'm looking at the bigger picture:
Bitcoin: A recovery could restore confidence across crypto. Another breakdown could bring more selling.
Altcoins: Weak projects may struggle, while fundamentally strong assets could attract attention when sentiment improves.
Stocks: If risk appetite remains weak, recovery could take longer than expected.
My opinion: I'm not treating every red candle as the end of the market. Corrections can create opportunities, but patience and capital preservation matter.
The real question is: Are we witnessing a temporary correction or the beginning of a much bigger market reset?
#Crypto #stockmarket #trading #MarketAnalysis #TwentyOneCapitalAdds172.25BTC
Crypto, stocks and other risk assets are facing heavy selling pressure. Fear is spreading, investors are becoming impatient, and everyone seems to be searching for the bottom.
But markets don't move in one direction forever.
Bitcoin is testing major lows, altcoins are under pressure, and investors are becoming increasingly defensive.
Here's how I'm looking at the bigger picture:
Bitcoin: A recovery could restore confidence across crypto. Another breakdown could bring more selling.
Altcoins: Weak projects may struggle, while fundamentally strong assets could attract attention when sentiment improves.
Stocks: If risk appetite remains weak, recovery could take longer than expected.
My opinion: I'm not treating every red candle as the end of the market. Corrections can create opportunities, but patience and capital preservation matter.
The real question is: Are we witnessing a temporary correction or the beginning of a much bigger market reset?
#Crypto #stockmarket #trading #MarketAnalysis #TwentyOneCapitalAdds172.25BTC
1
1
231

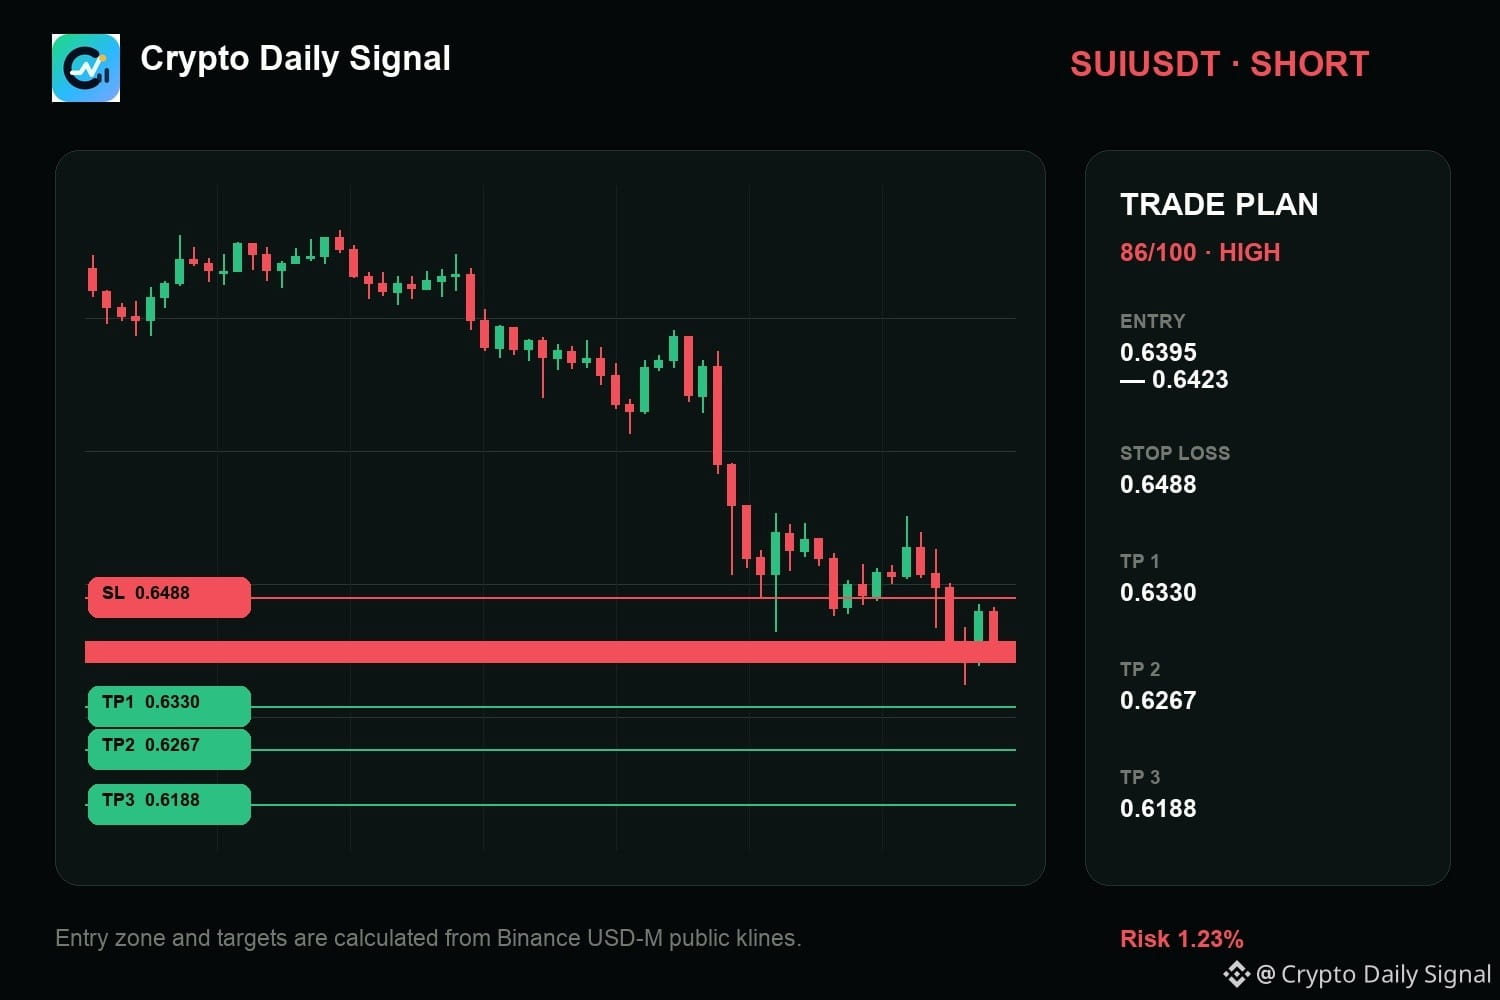
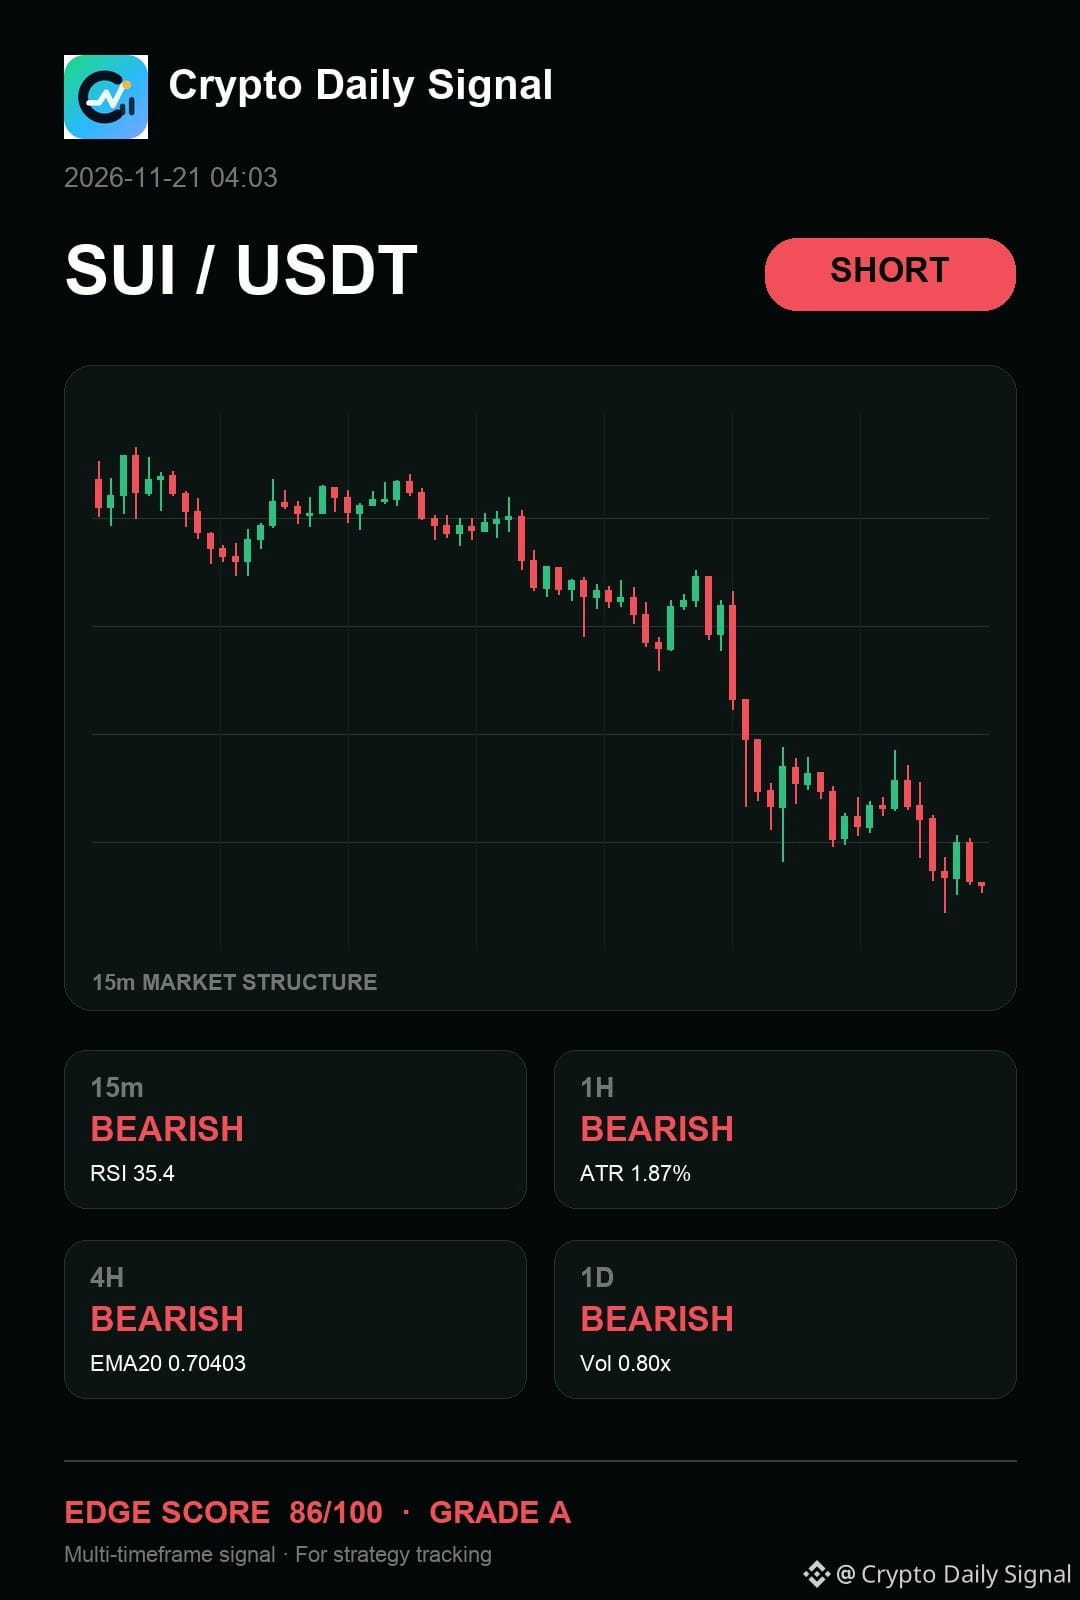
$SUI — honestly, the chart still says it still has a valid bearish path as it prints lower highs on the fifteen-minute chart, aligning with the wider bearish trends on the four-hour and daily views. Weak volume suggests selling pressure remains persistent, so a clean drop below the last swing low is needed for confirmation.
The map is useful only while the invalidation remains intact.
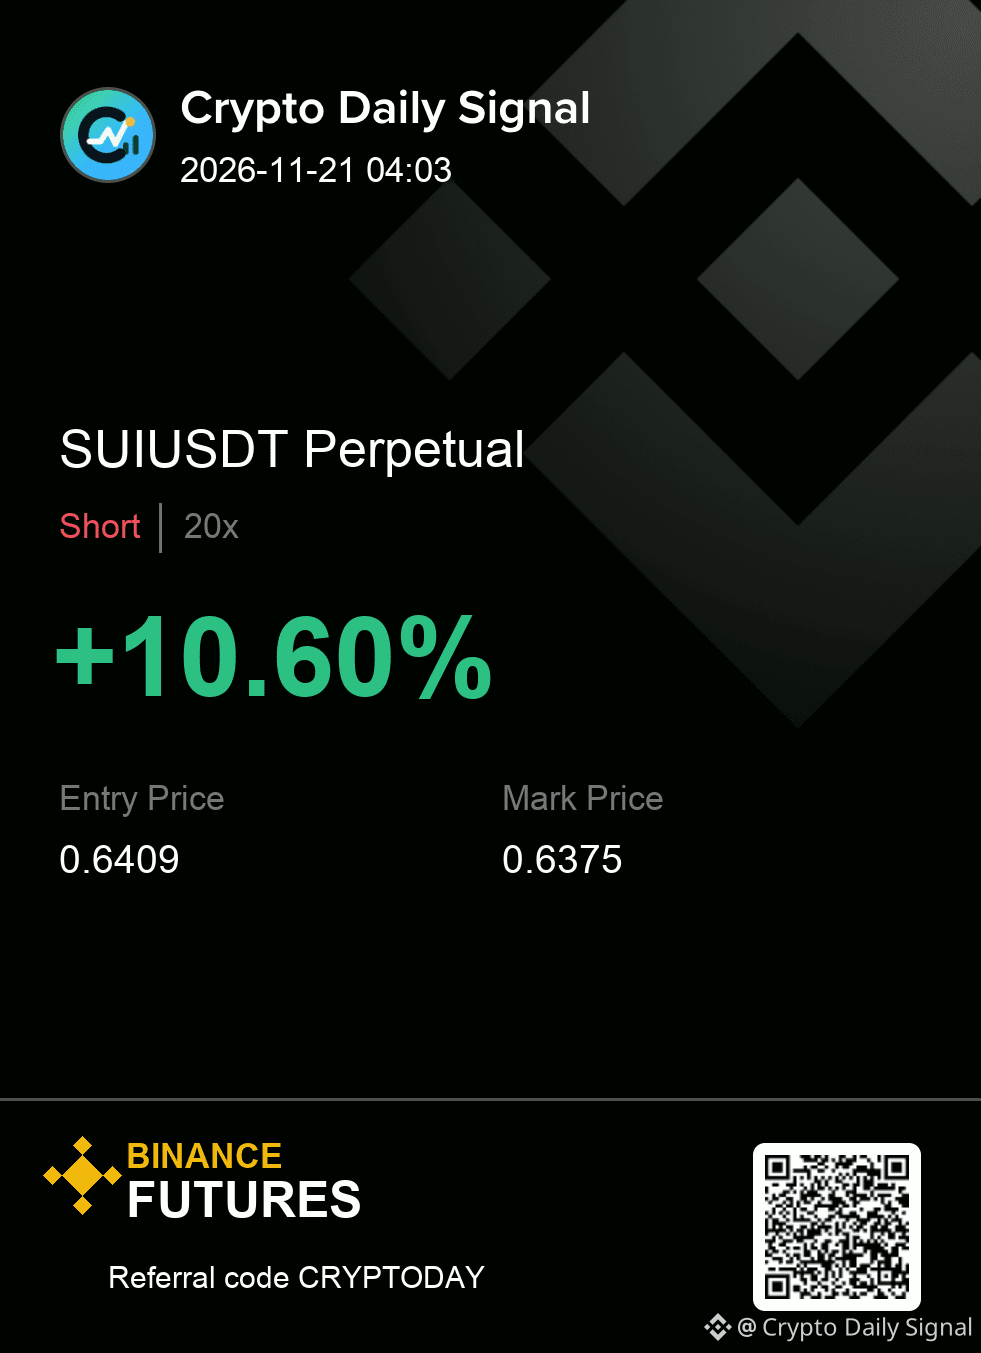
SHORT plan for SUIUSDT
0.6395 - 0.6423 entry | 0.6488 stop
0.6330 → 0.6267 → 0.6188
#MarketAnalysis
{future}(SUIUSDT)
$SUI — honestly, the chart still says it still has a valid bearish path as it prints lower highs on the fifteen-minute chart, aligning with the wider bearish trends on the four-hour and daily views. Weak volume suggests selling pressure remains persistent, so a clean drop below the last swing low is needed for confirmation.
The map is useful only while the invalidation remains intact.
SHORT plan for SUIUSDT
0.6395 - 0.6423 entry | 0.6488 stop
0.6330 → 0.6267 → 0.6188
#MarketAnalysis
The map is useful only while the invalidation remains intact.
SHORT plan for SUIUSDT
0.6395 - 0.6423 entry | 0.6488 stop
0.6330 → 0.6267 → 0.6188
#MarketAnalysis
6

·
--
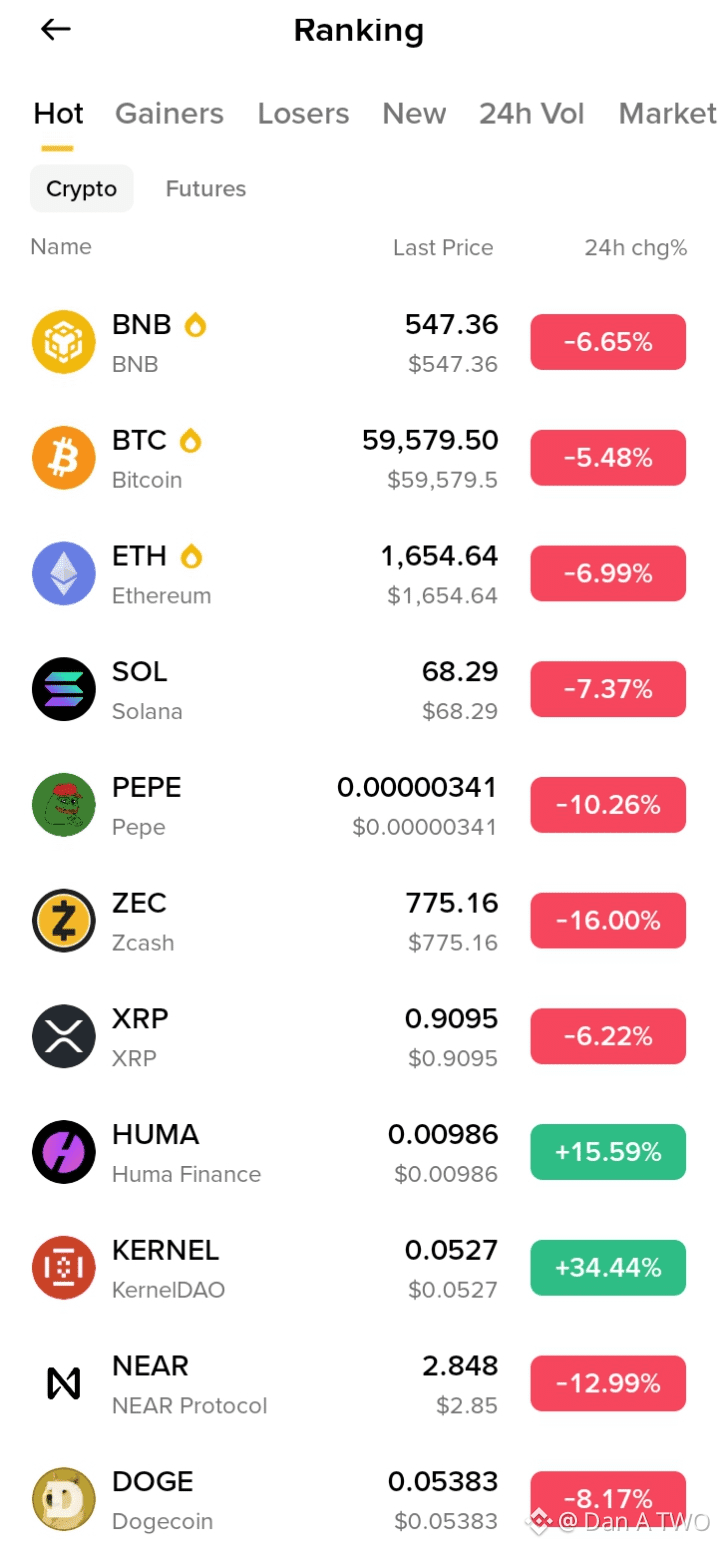
📉 Crypto Market Analysis: Today's Drop
The crypto market saw a sharp decline over the last 24 hours:
• $BTC: -5.48% (~$59,580)
• $ETH: -6.99% (~$1,655)
• $BNB: -6.65% (~$547)
• $SOL: -7.37% (~$68)
• $XRP: -6.22% (~$0.91)
• $NEAR: -12.99%, $ZEC: -16.00%
Most likely drivers:
1. Risk-off sentiment: Investors are cutting exposure and moving money out of volatile assets.
2. Liquidation cascade: Forced closures of leveraged positions are adding pressure on prices.
3. Altcoins hit harder: When Bitcoin weakens, altcoins and meme coins tend to fall even further.
What to watch:
• BTC and ETH support levels
• Funding rates and open interest
• Trading volume to confirm whether the move has real strength
Takeaway: Stick to solid risk management, avoid heavy leverage, and wait for confirmation of a reversal before taking large positions.
Patience and a plan are what protect an investor. 💪
Not financial advice. Do your own research (DYOR).
#crypto #DanATWO #bnb #MarketAnalysis #dyor
📉 Crypto Market Analysis: Today's Drop
The crypto market saw a sharp decline over the last 24 hours:
• $BTC: -5.48% (~$59,580)
• $ETH: -6.99% (~$1,655)
• $BNB: -6.65% (~$547)
• $SOL: -7.37% (~$68)
• $XRP: -6.22% (~$0.91)
• $NEAR: -12.99%, $ZEC: -16.00%
Most likely drivers:
1. Risk-off sentiment: Investors are cutting exposure and moving money out of volatile assets.
2. Liquidation cascade: Forced closures of leveraged positions are adding pressure on prices.
3. Altcoins hit harder: When Bitcoin weakens, altcoins and meme coins tend to fall even further.
What to watch:
• BTC and ETH support levels
• Funding rates and open interest
• Trading volume to confirm whether the move has real strength
Takeaway: Stick to solid risk management, avoid heavy leverage, and wait for confirmation of a reversal before taking large positions.
Patience and a plan are what protect an investor. 💪
Not financial advice. Do your own research (DYOR).
#crypto #DanATWO #bnb #MarketAnalysis #dyor
The crypto market saw a sharp decline over the last 24 hours:
• $BTC: -5.48% (~$59,580)
• $ETH: -6.99% (~$1,655)
• $BNB: -6.65% (~$547)
• $SOL: -7.37% (~$68)
• $XRP: -6.22% (~$0.91)
• $NEAR: -12.99%, $ZEC: -16.00%
Most likely drivers:
1. Risk-off sentiment: Investors are cutting exposure and moving money out of volatile assets.
2. Liquidation cascade: Forced closures of leveraged positions are adding pressure on prices.
3. Altcoins hit harder: When Bitcoin weakens, altcoins and meme coins tend to fall even further.
What to watch:
• BTC and ETH support levels
• Funding rates and open interest
• Trading volume to confirm whether the move has real strength
Takeaway: Stick to solid risk management, avoid heavy leverage, and wait for confirmation of a reversal before taking large positions.
Patience and a plan are what protect an investor. 💪
Not financial advice. Do your own research (DYOR).
#crypto #DanATWO #bnb #MarketAnalysis #dyor
1
402

·
--
Bullish
Crypto Just Had a Brutal Week. What Really Happened? 📉
$BTC and $ETH experienced significant declines during the week of November 9–15, 2026.
But what were the major factors behind the market weakness?
Here's a breakdown 👇
📊 THE NUMBERS
Bitcoin ($BTC)
- Weekly opening: Approximately $74,800
- Weekly low: Approximately $62,612
- Weekly decline: Around 13.1%
Ethereum ($ETH)
- Weekly opening: Approximately $2,128
- Weekly low: Approximately $1,729
- Weekly decline: Around 14.5%
Historical figures based on the cited November 17 market report.
🔍 WHY DID THE MARKET DECLINE?
1. ETF Outflows
Bitcoin investment funds experienced substantial withdrawals, reflecting weaker institutional fund flows.
2. Rising Bond Yields
Higher US bond yields can make risk-sensitive assets less attractive to investors.
3. Interest Rate Expectations
Changing expectations about Federal Reserve policy added uncertainty to financial markets.
4. MSCI Index Decision
MSCI announced that Strategy would be removed from relevant indexes after November 30.
🧠 KEY TAKEAWAY
Crypto markets are influenced by more than just cryptocurrency news.
Macroeconomic conditions, institutional fund flows and market sentiment can all affect price movements.
Understanding these factors helps beginners interpret market developments more objectively.
⚠️ Disclaimer: This content is for educational purposes only, not financial advice. Cryptocurrency markets are highly volatile.
💬 YOUR THOUGHTS
Which factor do you think had the biggest influence on this week's crypto market decline?
$BTC $ETH
#bitcoin
{spot}(BTCUSDT)
{spot}(ETHUSDT)
#Ethereum #cryptoeducation #MarketAnalysis
Crypto Just Had a Brutal Week. What Really Happened? 📉
$BTC and $ETH experienced significant declines during the week of November 9–15, 2026.
But what were the major factors behind the market weakness?
Here's a breakdown 👇
📊 THE NUMBERS
Bitcoin ($BTC )
- Weekly opening: Approximately $74,800
- Weekly low: Approximately $62,612
- Weekly decline: Around 13.1%
Ethereum ($ETH )
- Weekly opening: Approximately $2,128
- Weekly low: Approximately $1,729
- Weekly decline: Around 14.5%
Historical figures based on the cited November 17 market report.
🔍 WHY DID THE MARKET DECLINE?
1. ETF Outflows
Bitcoin investment funds experienced substantial withdrawals, reflecting weaker institutional fund flows.
2. Rising Bond Yields
Higher US bond yields can make risk-sensitive assets less attractive to investors.
3. Interest Rate Expectations
Changing expectations about Federal Reserve policy added uncertainty to financial markets.
4. MSCI Index Decision
MSCI announced that Strategy would be removed from relevant indexes after November 30.
🧠 KEY TAKEAWAY
Crypto markets are influenced by more than just cryptocurrency news.
Macroeconomic conditions, institutional fund flows and market sentiment can all affect price movements.
Understanding these factors helps beginners interpret market developments more objectively.
⚠️ Disclaimer: This content is for educational purposes only, not financial advice. Cryptocurrency markets are highly volatile.
💬 YOUR THOUGHTS
Which factor do you think had the biggest influence on this week's crypto market decline?
$BTC $ETH
#bitcoin
#Ethereum #cryptoeducation #MarketAnalysis
$BTC and $ETH experienced significant declines during the week of November 9–15, 2026.
But what were the major factors behind the market weakness?
Here's a breakdown 👇
📊 THE NUMBERS
Bitcoin ($BTC )
- Weekly opening: Approximately $74,800
- Weekly low: Approximately $62,612
- Weekly decline: Around 13.1%
Ethereum ($ETH )
- Weekly opening: Approximately $2,128
- Weekly low: Approximately $1,729
- Weekly decline: Around 14.5%
Historical figures based on the cited November 17 market report.
🔍 WHY DID THE MARKET DECLINE?
1. ETF Outflows
Bitcoin investment funds experienced substantial withdrawals, reflecting weaker institutional fund flows.
2. Rising Bond Yields
Higher US bond yields can make risk-sensitive assets less attractive to investors.
3. Interest Rate Expectations
Changing expectations about Federal Reserve policy added uncertainty to financial markets.
4. MSCI Index Decision
MSCI announced that Strategy would be removed from relevant indexes after November 30.
🧠 KEY TAKEAWAY
Crypto markets are influenced by more than just cryptocurrency news.
Macroeconomic conditions, institutional fund flows and market sentiment can all affect price movements.
Understanding these factors helps beginners interpret market developments more objectively.
⚠️ Disclaimer: This content is for educational purposes only, not financial advice. Cryptocurrency markets are highly volatile.
💬 YOUR THOUGHTS
Which factor do you think had the biggest influence on this week's crypto market decline?
$BTC $ETH
#bitcoin
#Ethereum #cryptoeducation #MarketAnalysis
1
244
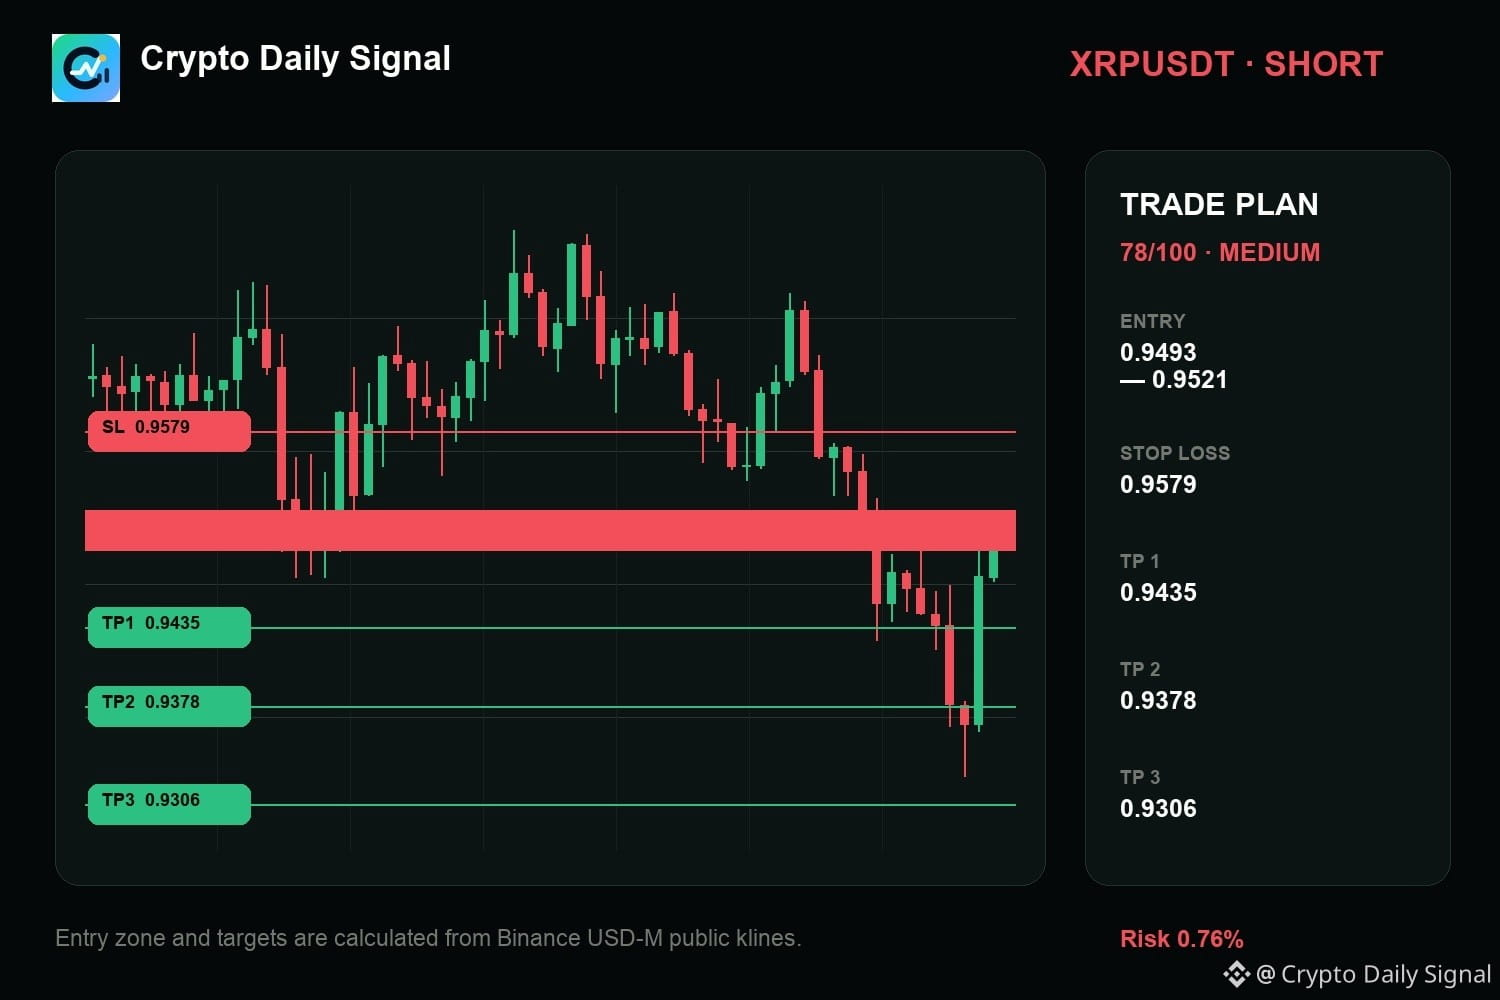
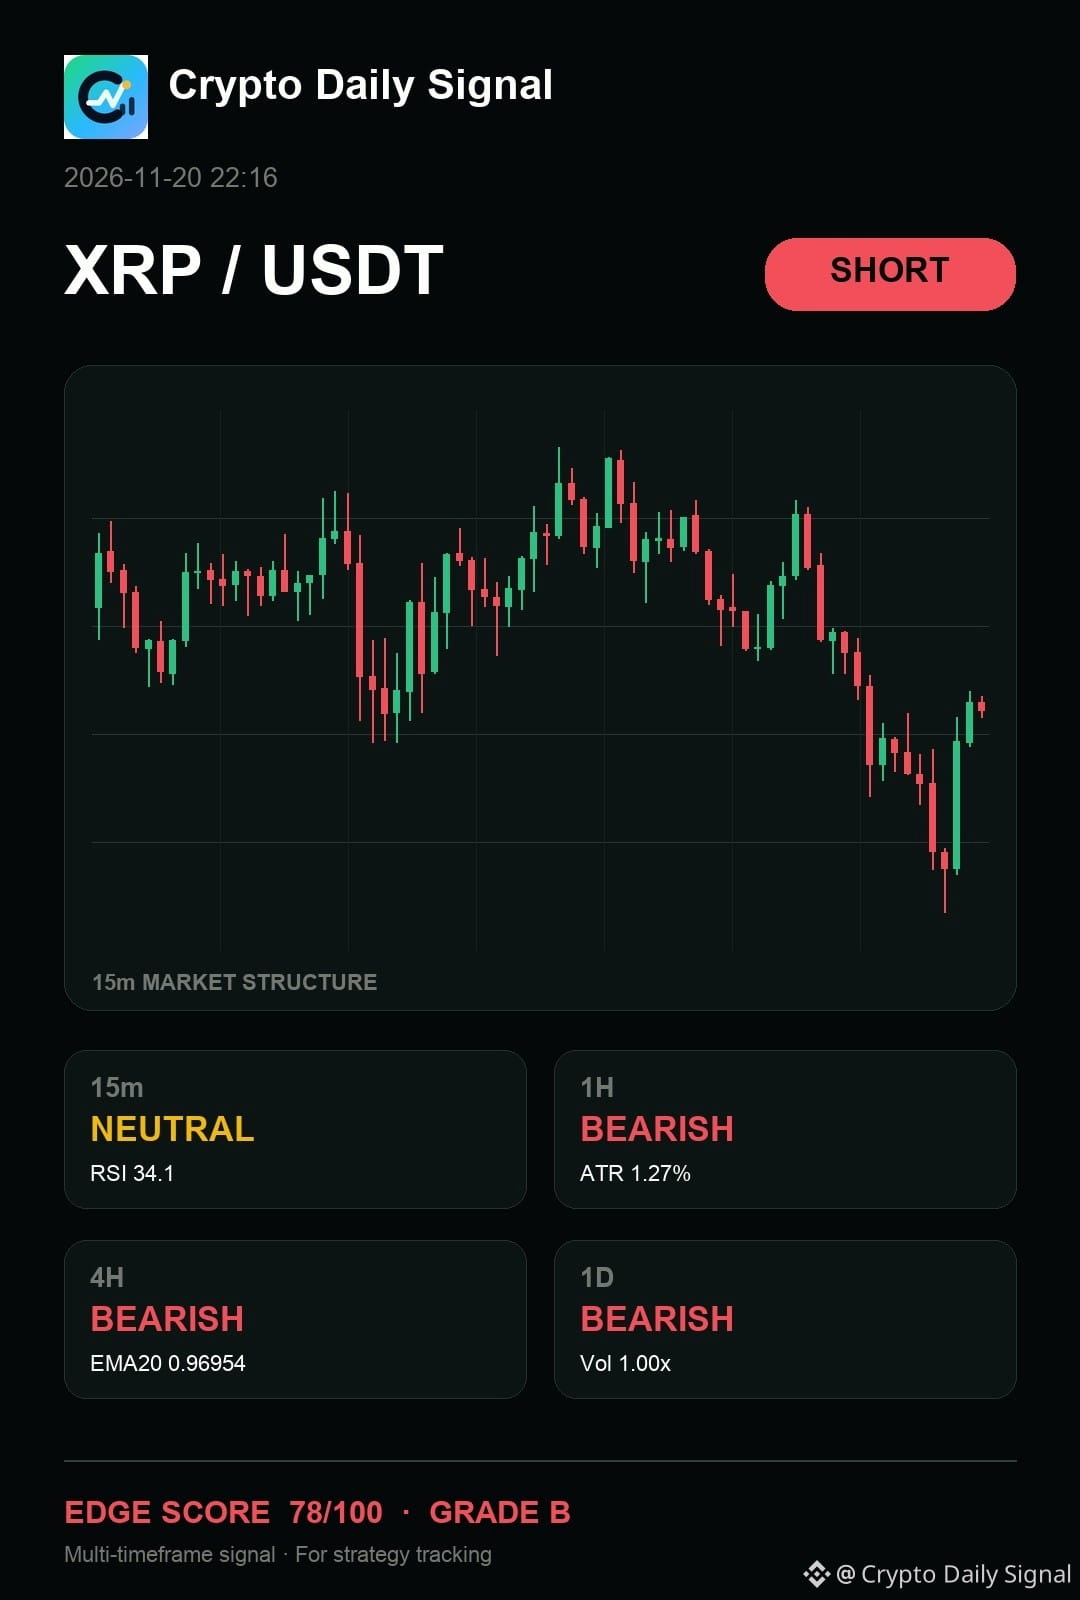
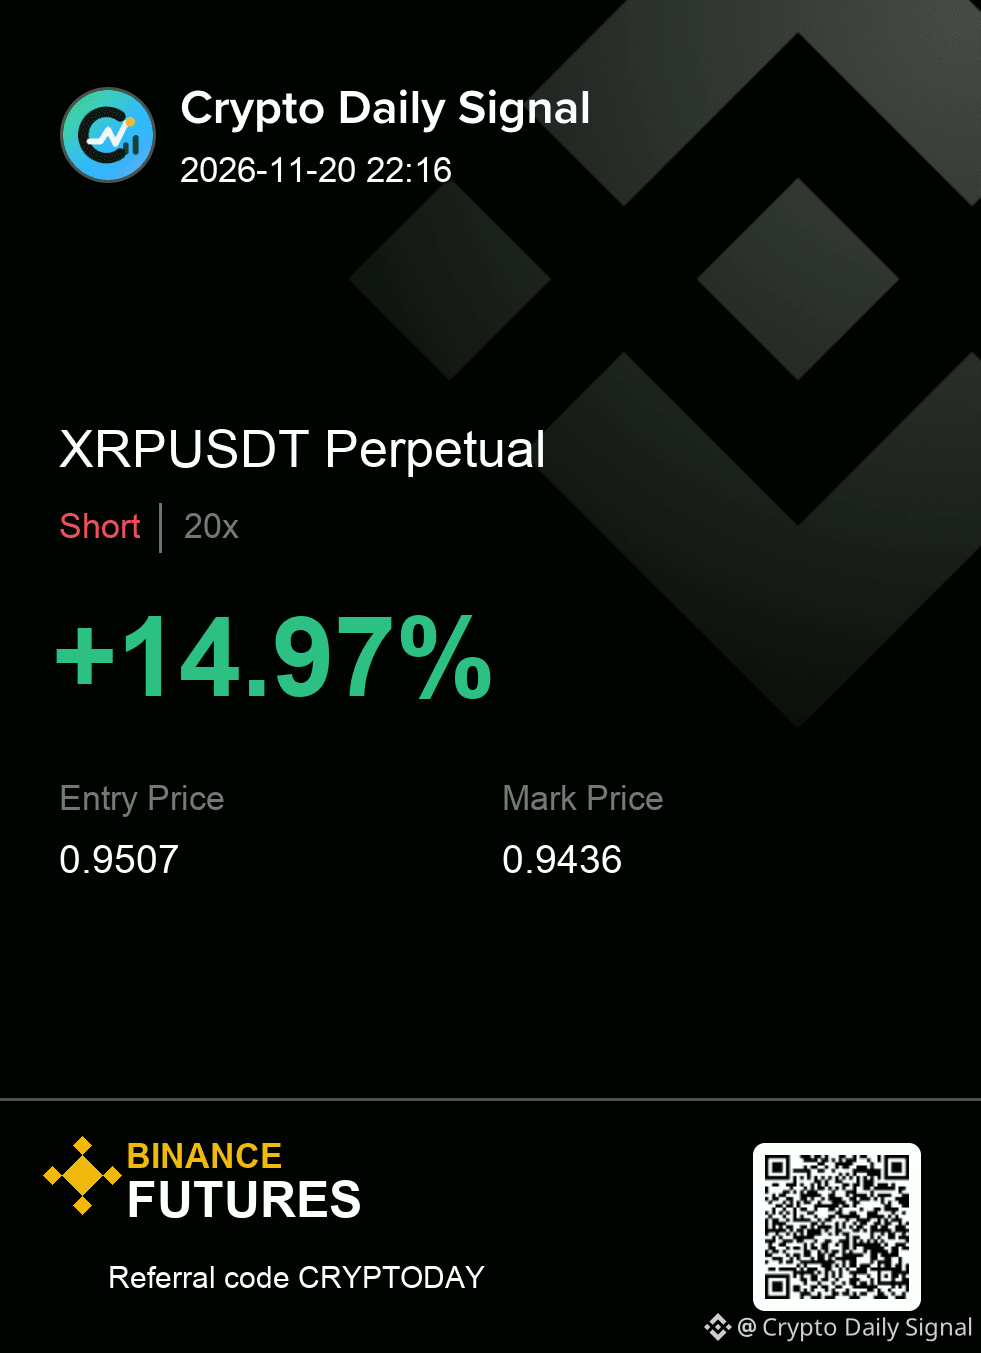
$XRP needs confirmation before I press the short because the recent push saw a clear rejection from that upper level. The price is trading below the trendline formed by prior swings, and the broader direction across the daily and four-hour views remains down. For this to play out cleanly, we need a definitive close below the immediate support area.
The map is useful only while the invalidation remains intact.
Levels — XRPUSDT
Zone: 0.9493 - 0.9521
Cut: 0.9579
Scale: 0.9435 | 0.9378 | 0.9306
#MarketAnalysis
{future}(XRPUSDT)
$XRP needs confirmation before I press the short because the recent push saw a clear rejection from that upper level. The price is trading below the trendline formed by prior swings, and the broader direction across the daily and four-hour views remains down. For this to play out cleanly, we need a definitive close below the immediate support area.
The map is useful only while the invalidation remains intact.
Levels — XRPUSDT
Zone: 0.9493 - 0.9521
Cut: 0.9579
Scale: 0.9435 | 0.9378 | 0.9306
#MarketAnalysis
The map is useful only while the invalidation remains intact.
Levels — XRPUSDT
Zone: 0.9493 - 0.9521
Cut: 0.9579
Scale: 0.9435 | 0.9378 | 0.9306
#MarketAnalysis
10

$BTC Full Market Analysis
{future}(BTCUSDT)
Bitcoin is showing a short-term recovery, but its previous weekly performance remains negative. This creates an important difference between daily momentum and the broader trend.
Trading volume is around 2.7% of market capitalization. That provides useful activity context, but volume alone cannot confirm a sustainable reversal.
Recent ETF outflows and Federal Reserve uncertainty have also contributed to cautious market sentiment.
Trade on $BTC
What to Watch: ETF flows, BTC dominance, trading volume and Federal Reserve developments.
#Bitcoin #BTC #CryptoMarket #MarketAnalysis #cryptoeducation
$BTC Full Market Analysis
Bitcoin is showing a short-term recovery, but its previous weekly performance remains negative. This creates an important difference between daily momentum and the broader trend.
Trading volume is around 2.7% of market capitalization. That provides useful activity context, but volume alone cannot confirm a sustainable reversal.
Recent ETF outflows and Federal Reserve uncertainty have also contributed to cautious market sentiment.
Trade on $BTC
What to Watch: ETF flows, BTC dominance, trading volume and Federal Reserve developments.
#Bitcoin #BTC #CryptoMarket #MarketAnalysis #cryptoeducation
Bitcoin is showing a short-term recovery, but its previous weekly performance remains negative. This creates an important difference between daily momentum and the broader trend.
Trading volume is around 2.7% of market capitalization. That provides useful activity context, but volume alone cannot confirm a sustainable reversal.
Recent ETF outflows and Federal Reserve uncertainty have also contributed to cautious market sentiment.
Trade on $BTC
What to Watch: ETF flows, BTC dominance, trading volume and Federal Reserve developments.
#Bitcoin #BTC #CryptoMarket #MarketAnalysis #cryptoeducation
111
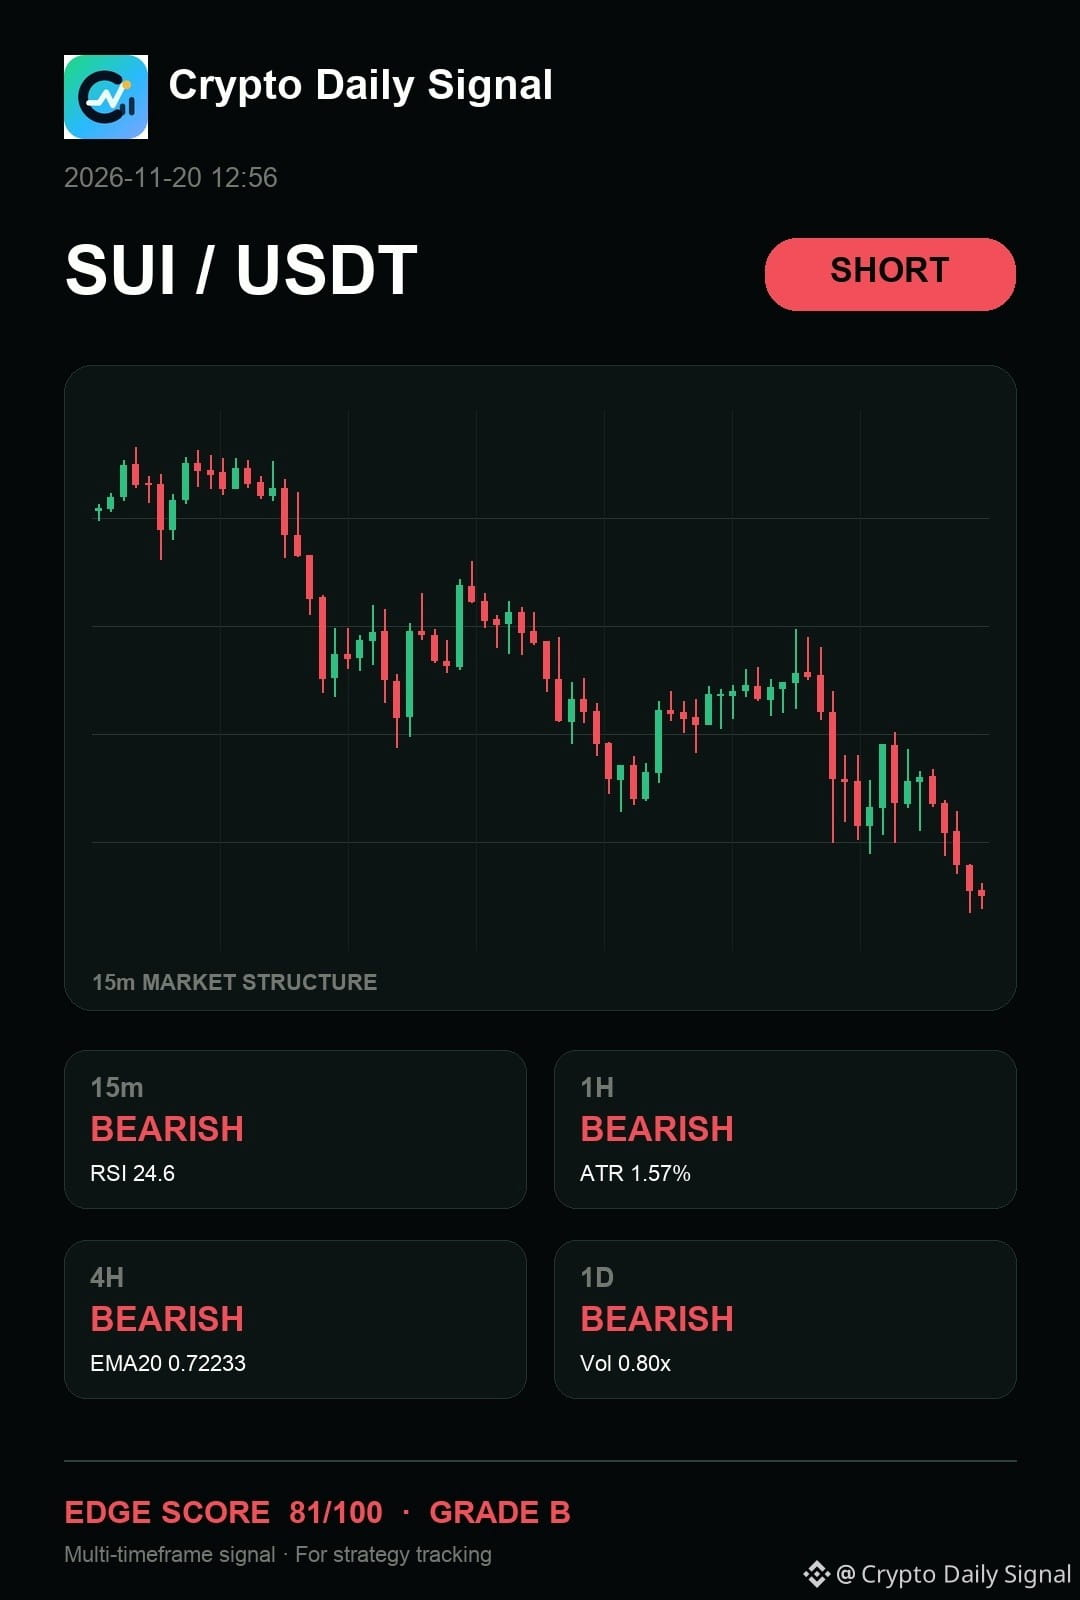
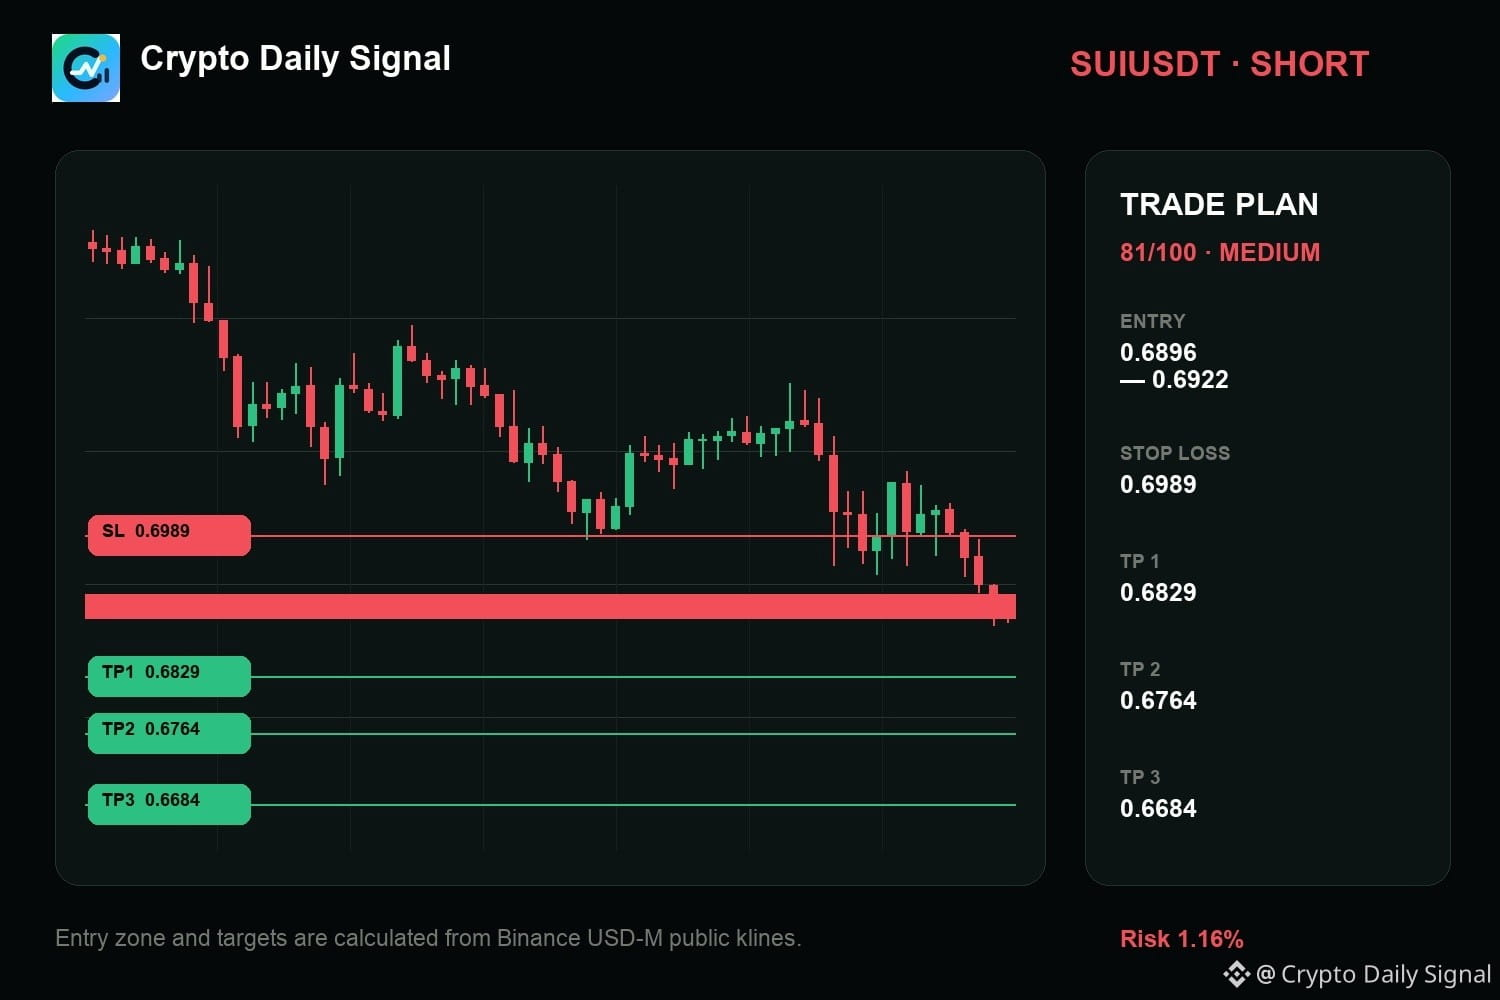
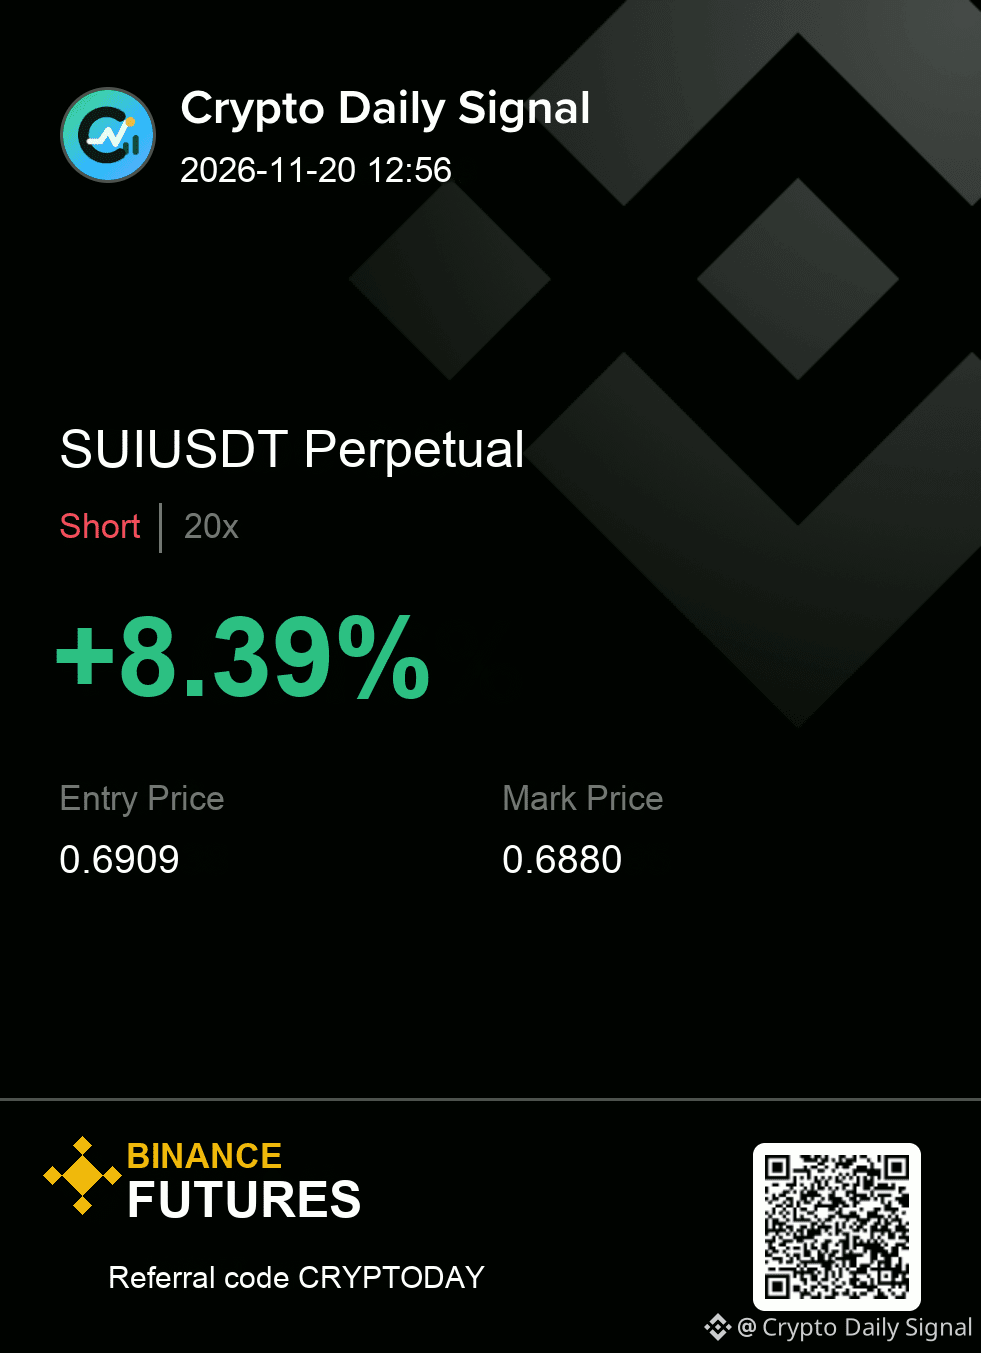
$SUI — honestly, the chart still says it still gives sellers the cleaner argument despite some watching for a bounce off the range bottom. The sequence of lower highs and lower lows across shorter periods confirms the established bearish trend visible on the daily chart. Weakness here would be a decisive break above the recent swing high, but the current positioning below the range floor holds the bearish view.
SUIUSDT SHORT map
Entry → 0.6896 - 0.6922
SL → 0.6989
TP → 0.6829 · 0.6764 · 0.6684
Clean enough to execute, or still too early for you?
#MarketAnalysis
{future}(SUIUSDT)
$SUI — honestly, the chart still says it still gives sellers the cleaner argument despite some watching for a bounce off the range bottom. The sequence of lower highs and lower lows across shorter periods confirms the established bearish trend visible on the daily chart. Weakness here would be a decisive break above the recent swing high, but the current positioning below the range floor holds the bearish view.
SUIUSDT SHORT map
Entry → 0.6896 - 0.6922
SL → 0.6989
TP → 0.6829 · 0.6764 · 0.6684
Clean enough to execute, or still too early for you?
#MarketAnalysis
SUIUSDT SHORT map
Entry → 0.6896 - 0.6922
SL → 0.6989
TP → 0.6829 · 0.6764 · 0.6684
Clean enough to execute, or still too early for you?
#MarketAnalysis
16
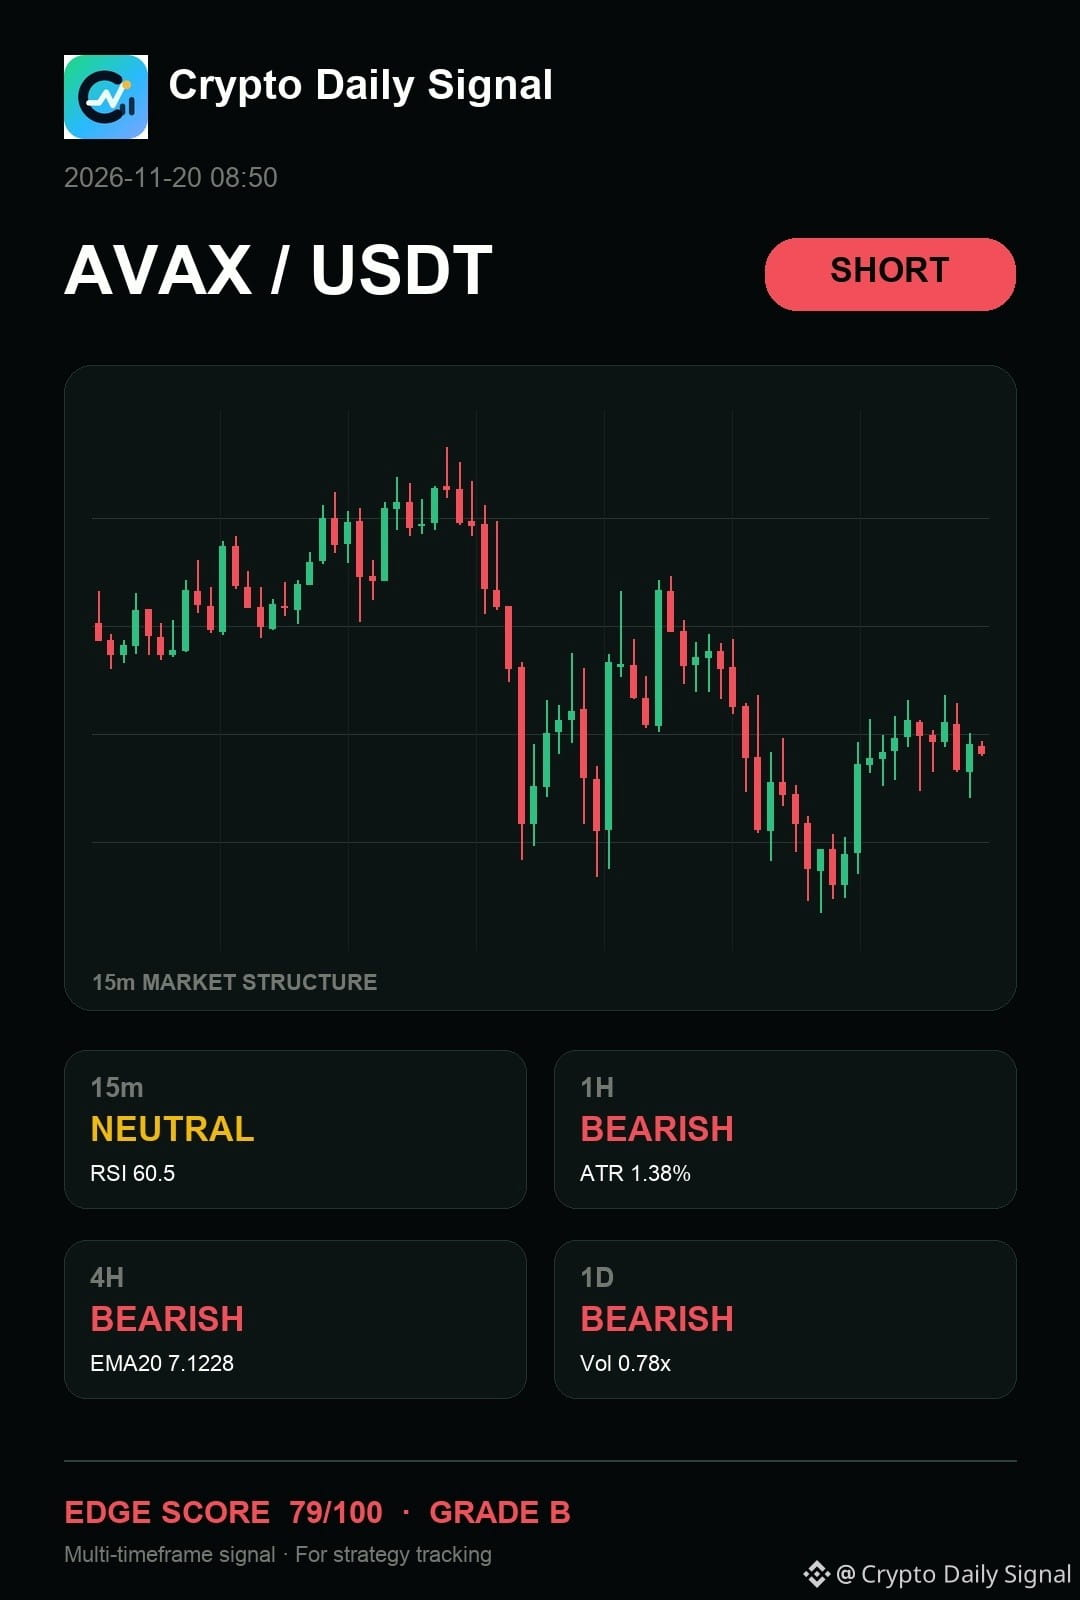
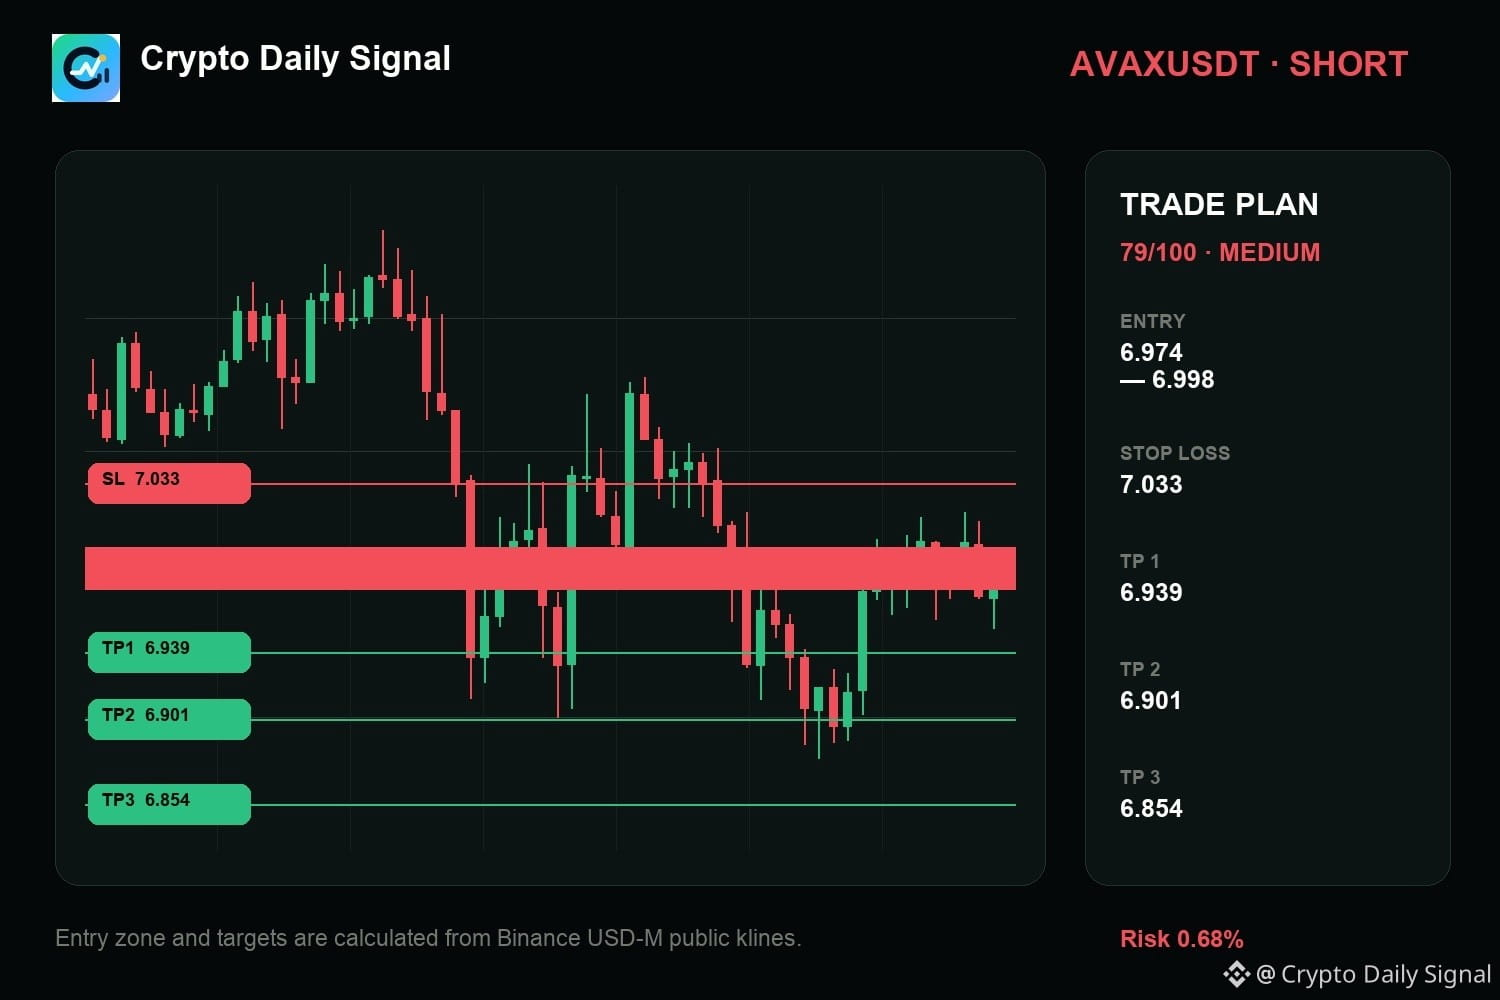
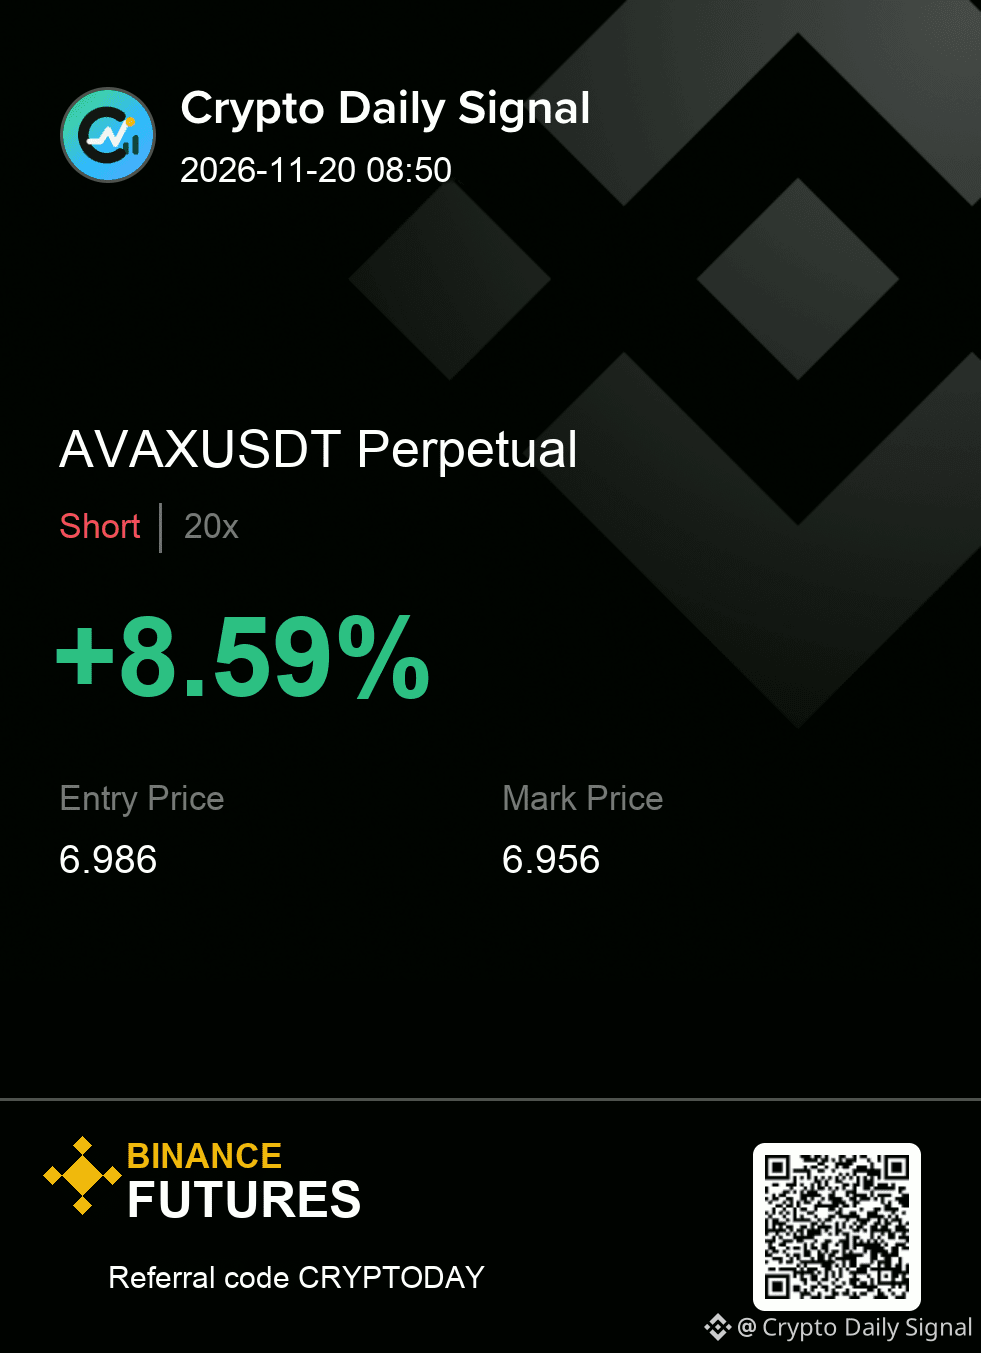
$AVAX has not invalidated the short case because although some short-term momentum appears weak, the price action is showing a solid pattern of lower highs and lower lows. The bigger picture remains bearish across the daily and four-hour charts, holding firm against the established resistance level. For this trade to look weak, we'd need a real break above that prior swing high on a strong volume day.
SHORT plan for AVAXUSDT
6.974 - 6.998 entry | 7.033 stop
6.939 → 6.901 → 6.854
Worth tracking from here, or does the range still need more time?
#MarketAnalysis
{future}(AVAXUSDT)
$AVAX has not invalidated the short case because although some short-term momentum appears weak, the price action is showing a solid pattern of lower highs and lower lows. The bigger picture remains bearish across the daily and four-hour charts, holding firm against the established resistance level. For this trade to look weak, we'd need a real break above that prior swing high on a strong volume day.
SHORT plan for AVAXUSDT
6.974 - 6.998 entry | 7.033 stop
6.939 → 6.901 → 6.854
Worth tracking from here, or does the range still need more time?
#MarketAnalysis
SHORT plan for AVAXUSDT
6.974 - 6.998 entry | 7.033 stop
6.939 → 6.901 → 6.854
Worth tracking from here, or does the range still need more time?
#MarketAnalysis
9
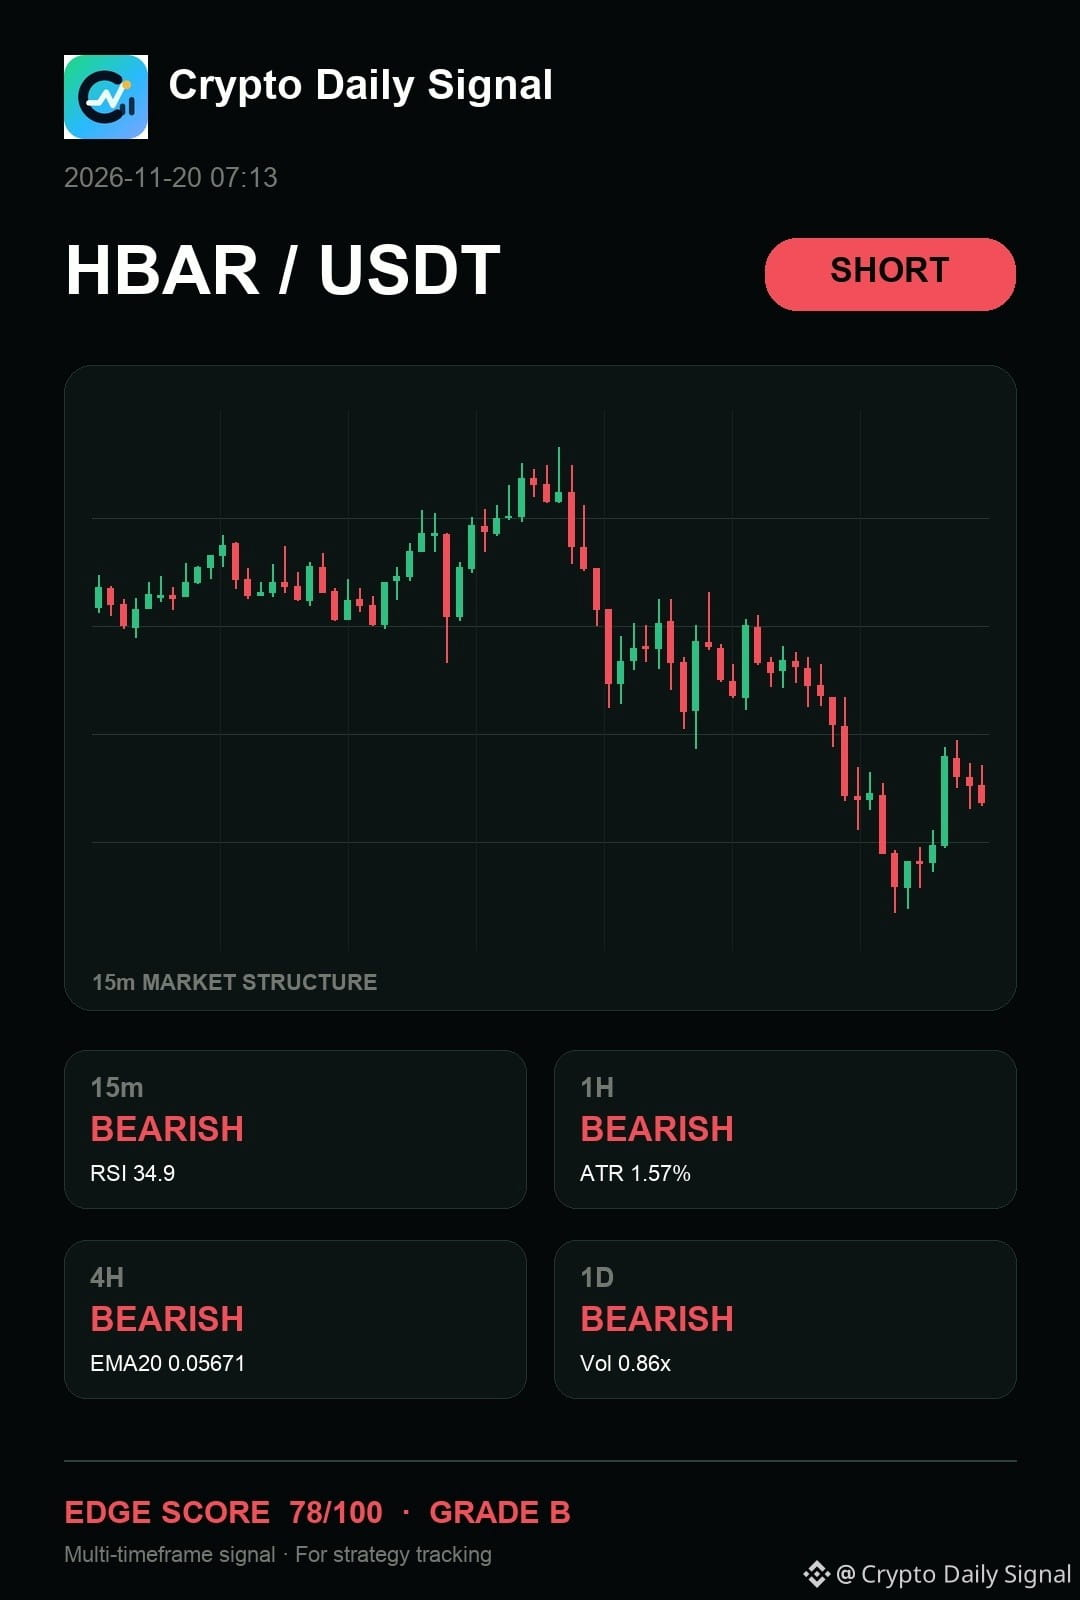
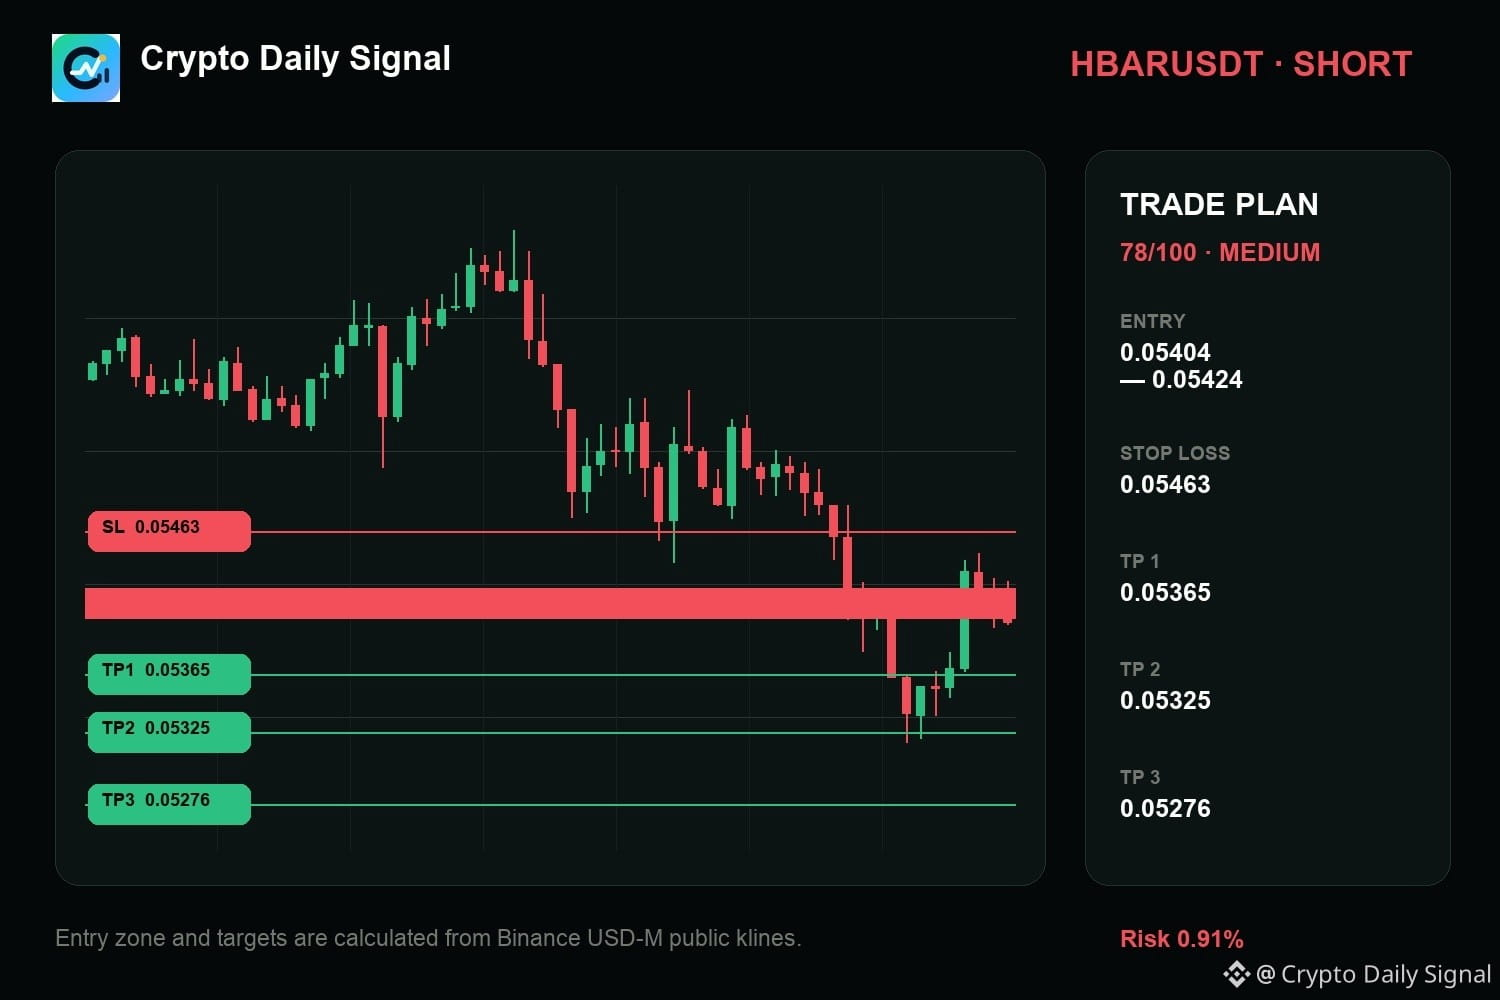
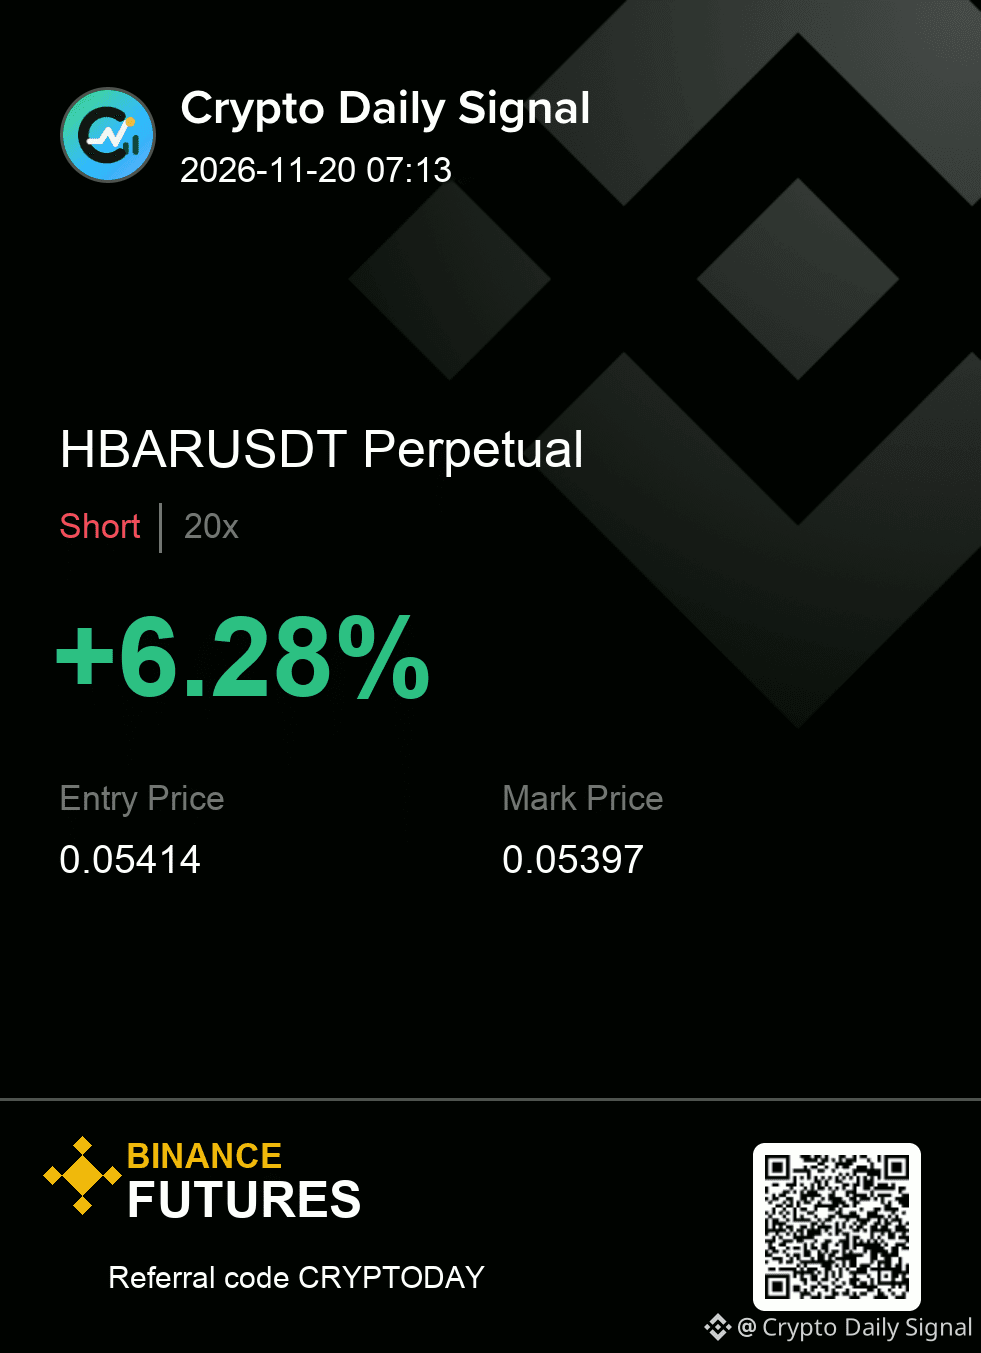
$HBAR still offers the cleaner bearish argument because the price action is tracking lower highs across the visible range, matching the bearish trend seen on the daily chart. The market is showing clear lower lows despite the tight consolidation. A decisive drop below the range floor would solidify the short thesis; a strong push past the recent swing high would invalidate the move.
My levels for HBARUSDT — SHORT
Entry zone 0.05404 - 0.05424
Risk line 0.05463
Targets 0.05365 / 0.05325 / 0.05276
#MarketAnalysis
{future}(HBARUSDT)
$HBAR still offers the cleaner bearish argument because the price action is tracking lower highs across the visible range, matching the bearish trend seen on the daily chart. The market is showing clear lower lows despite the tight consolidation. A decisive drop below the range floor would solidify the short thesis; a strong push past the recent swing high would invalidate the move.
My levels for HBARUSDT — SHORT
Entry zone 0.05404 - 0.05424
Risk line 0.05463
Targets 0.05365 / 0.05325 / 0.05276
#MarketAnalysis
My levels for HBARUSDT — SHORT
Entry zone 0.05404 - 0.05424
Risk line 0.05463
Targets 0.05365 / 0.05325 / 0.05276
#MarketAnalysis
5

·
--
Bearish
Verified
$ANT
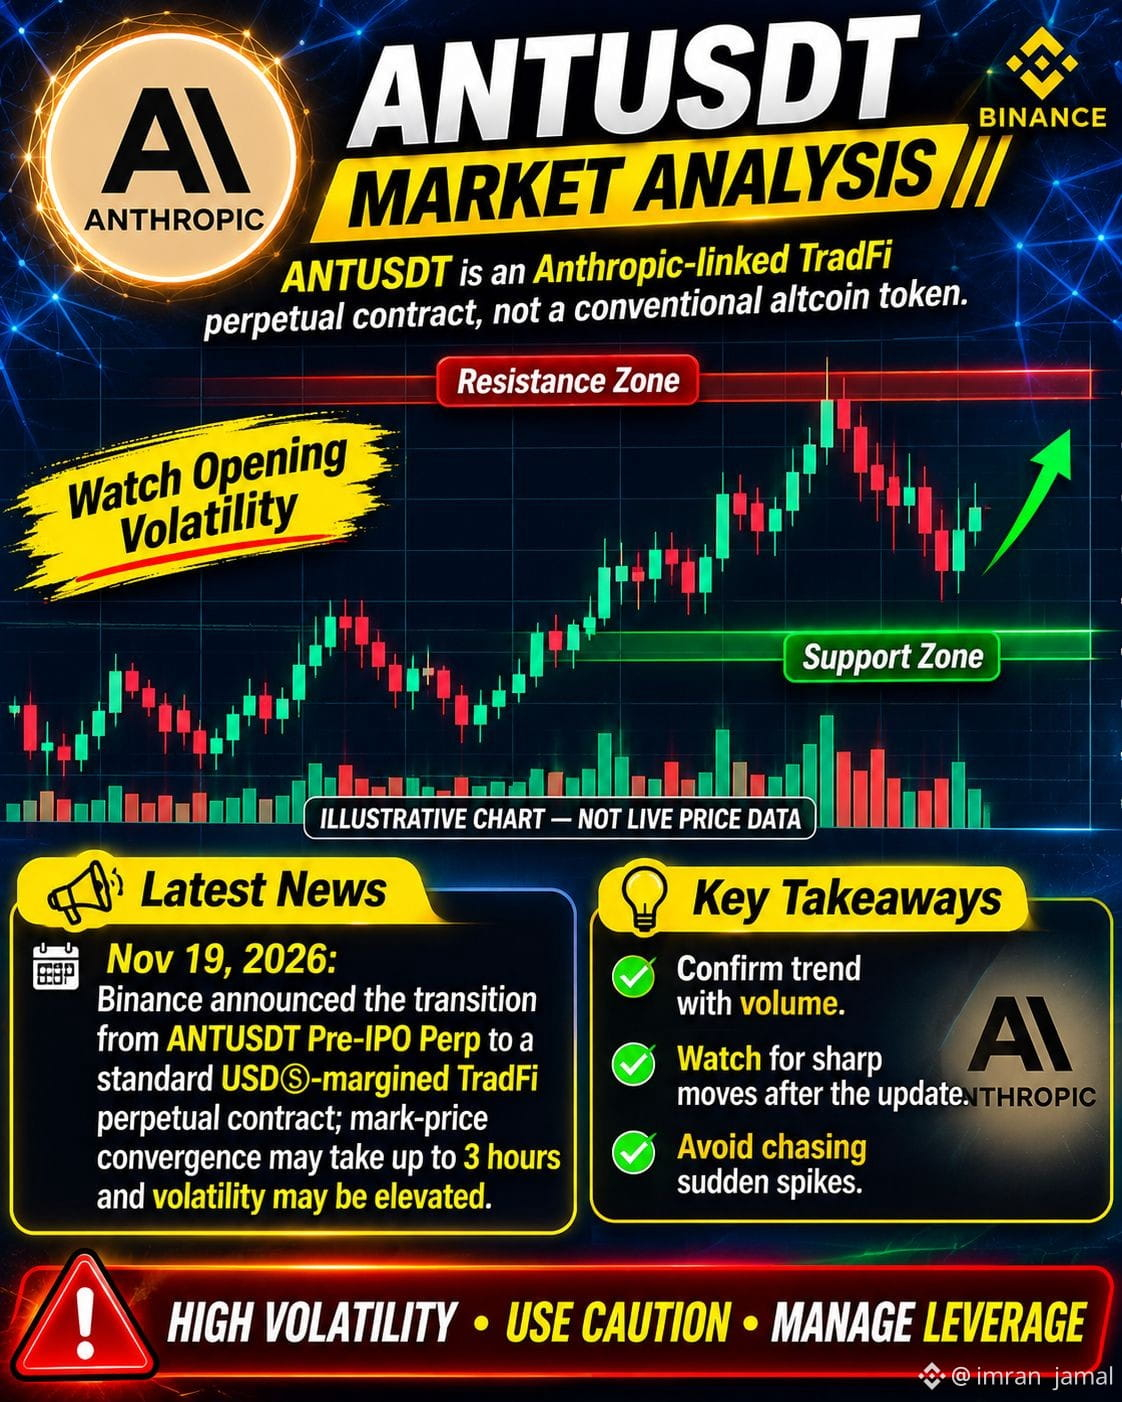
🚀 ANTUSDT Market Analysis – November 19
ANTUSDT is attracting attention following Anthropic's IPO. This is an Anthropic-linked TradFi perpetual contract, not a conventional altcoin.
Latest Market News:
Binance announced the transition of ANTUSDT from Pre-IPO perpetual to standard TradFi perpetual.
Mark-price adjustment may take up to 3 hours.
Significant volatility is possible during the transition.
Technical Analysis:
Watch resistance for a confirmed breakout.
Monitor support for signs of buying strength.
Confirm price direction with volume.
Avoid entering during sudden price spikes.
Market Outlook: ANTUSDT could experience sharp movements as the underlying stock begins regular trading. Wait for price stability before taking a position.
Trading Advice: Use low leverage, proper stop-loss protection and careful position sizing.
#ANTUSDT #AnthropicAI #CryptoTrading. #Benince #MarketAnalysis
{future}(ANTUSDT)
$ANT
🚀 ANTUSDT Market Analysis – November 19
ANTUSDT is attracting attention following Anthropic's IPO. This is an Anthropic-linked TradFi perpetual contract, not a conventional altcoin.
Latest Market News:
Binance announced the transition of ANTUSDT from Pre-IPO perpetual to standard TradFi perpetual.
Mark-price adjustment may take up to 3 hours.
Significant volatility is possible during the transition.
Technical Analysis:
Watch resistance for a confirmed breakout.
Monitor support for signs of buying strength.
Confirm price direction with volume.
Avoid entering during sudden price spikes.
Market Outlook: ANTUSDT could experience sharp movements as the underlying stock begins regular trading. Wait for price stability before taking a position.
Trading Advice: Use low leverage, proper stop-loss protection and careful position sizing.
#ANTUSDT #AnthropicAI #CryptoTrading. #Benince #MarketAnalysis
🚀 ANTUSDT Market Analysis – November 19
ANTUSDT is attracting attention following Anthropic's IPO. This is an Anthropic-linked TradFi perpetual contract, not a conventional altcoin.
Latest Market News:
Binance announced the transition of ANTUSDT from Pre-IPO perpetual to standard TradFi perpetual.
Mark-price adjustment may take up to 3 hours.
Significant volatility is possible during the transition.
Technical Analysis:
Watch resistance for a confirmed breakout.
Monitor support for signs of buying strength.
Confirm price direction with volume.
Avoid entering during sudden price spikes.
Market Outlook: ANTUSDT could experience sharp movements as the underlying stock begins regular trading. Wait for price stability before taking a position.
Trading Advice: Use low leverage, proper stop-loss protection and careful position sizing.
#ANTUSDT #AnthropicAI #CryptoTrading. #Benince #MarketAnalysis
869

🚨 BITCOIN BELOW $63,000! IS THE MARKET HEADING LOWER?
Crypto traders are watching closely as Bitcoin faces renewed selling pressure.
📉 Market Update — November 19:
- $BTC dropped below the $63K level.
- $ETH slipped below $1,800.
- The market is reacting to hawkish Federal Reserve signals.
- BTC's key support zone: $62,000.
- Important recovery zone: $65,000–$66,000.
⚠️ If Bitcoin fails to hold support, further downside pressure may follow. A recovery above resistance could improve short-term sentiment.
The next move could set the tone for the broader crypto market.
👇 What do you think?
Will BTC recover above $65K, or fall toward $60K?
#Bitcoin #CryptoNews #MarketAnalysis #CryptoTitans #BinanceSquare
DYOR. Not financial advice.
🚨 BITCOIN BELOW $63,000! IS THE MARKET HEADING LOWER?
Crypto traders are watching closely as Bitcoin faces renewed selling pressure.
📉 Market Update — November 19:
- $BTC dropped below the $63K level.
- $ETH slipped below $1,800.
- The market is reacting to hawkish Federal Reserve signals.
- BTC's key support zone: $62,000.
- Important recovery zone: $65,000–$66,000.
⚠️ If Bitcoin fails to hold support, further downside pressure may follow. A recovery above resistance could improve short-term sentiment.
The next move could set the tone for the broader crypto market.
👇 What do you think?
Will BTC recover above $65K, or fall toward $60K?
#Bitcoin #CryptoNews #MarketAnalysis #CryptoTitans #BinanceSquare
DYOR. Not financial advice.
Crypto traders are watching closely as Bitcoin faces renewed selling pressure.
📉 Market Update — November 19:
- $BTC dropped below the $63K level.
- $ETH slipped below $1,800.
- The market is reacting to hawkish Federal Reserve signals.
- BTC's key support zone: $62,000.
- Important recovery zone: $65,000–$66,000.
⚠️ If Bitcoin fails to hold support, further downside pressure may follow. A recovery above resistance could improve short-term sentiment.
The next move could set the tone for the broader crypto market.
👇 What do you think?
Will BTC recover above $65K, or fall toward $60K?
#Bitcoin #CryptoNews #MarketAnalysis #CryptoTitans #BinanceSquare
DYOR. Not financial advice.

Moolish:
Daily TD 13 already printed. I'd watch 62k on the close
2
1
99

·
--
Bullish
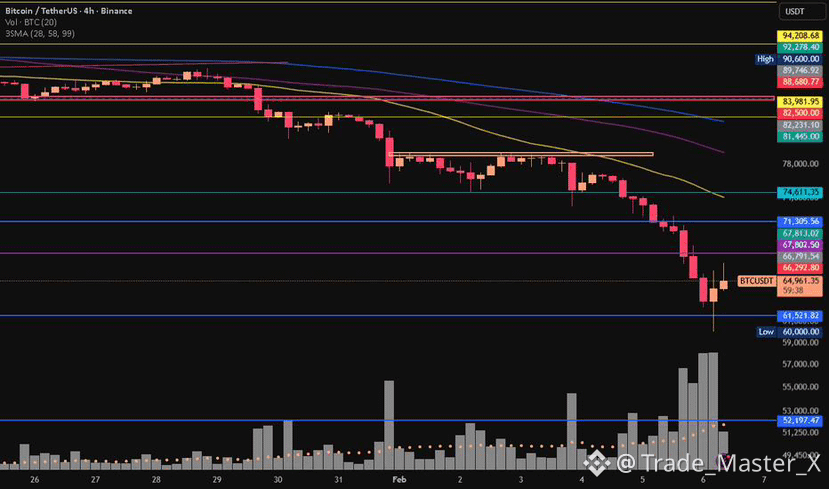
🚨 $BTC BITCOIN MARKET UPDATE | NOVEMBER 19, 2026
📉 BITCOIN BELOW $63,000 — BEARS ARE TAKING CONTROL!
Bitcoin is facing renewed selling pressure as macroeconomic uncertainty and market weakness continue to affect investor sentiment.
📊 MARKET OVERVIEW:
💰 BTC Price: Around $62,700
🔻 24H Change: -3.42%
📉 Market Sentiment: Bearish
🔴 WHY IS BITCOIN FALLING?
1️⃣ Hawkish Federal Reserve expectations are putting pressure on risk assets.
2️⃣ Bitcoin miners are adding selling pressure to the market.
3️⃣ Weak market sentiment is limiting buying momentum.
📍 IMPORTANT PRICE LEVELS:
🟢 SUPPORT ZONES:
$62,000
$60,400
🔴 RESISTANCE ZONES:
$63,300
$63,900
$64,700
📉 BEARISH SCENARIO:
If BTC fails to reclaim $63,300 and breaks below $62,000, further downside pressure could develop.
📈 BULLISH SCENARIO:
If buyers reclaim $63,300 and maintain momentum, BTC could attempt a recovery toward $63,900–$64,700.
🎯 MY MARKET BIAS: BEARISH
I will be watching the $62,000 support zone very closely.
💬 LET’S DISCUSS!
Do you think Bitcoin will:
🔴 Drop toward $60,400?
🟢 Recover above $64,000?
Share your prediction in the comments!
Follow @Trade_Master_X for daily Bitcoin updates and professional crypto market analysis.
⚠️ Educational content only. Not financial advice. Always do your own research.
#bitcoin #BTC #CryptoNews #MarketAnalysis #BinanceSquare
{spot}(BTCUSDT)
🚨 $BTC BITCOIN MARKET UPDATE | NOVEMBER 19, 2026
📉 BITCOIN BELOW $63,000 — BEARS ARE TAKING CONTROL!
Bitcoin is facing renewed selling pressure as macroeconomic uncertainty and market weakness continue to affect investor sentiment.
📊 MARKET OVERVIEW:
💰 BTC Price: Around $62,700
🔻 24H Change: -3.42%
📉 Market Sentiment: Bearish
🔴 WHY IS BITCOIN FALLING?
1️⃣ Hawkish Federal Reserve expectations are putting pressure on risk assets.
2️⃣ Bitcoin miners are adding selling pressure to the market.
3️⃣ Weak market sentiment is limiting buying momentum.
📍 IMPORTANT PRICE LEVELS:
🟢 SUPPORT ZONES:
$62,000
$60,400
🔴 RESISTANCE ZONES:
$63,300
$63,900
$64,700
📉 BEARISH SCENARIO:
If BTC fails to reclaim $63,300 and breaks below $62,000, further downside pressure could develop.
📈 BULLISH SCENARIO:
If buyers reclaim $63,300 and maintain momentum, BTC could attempt a recovery toward $63,900–$64,700.
🎯 MY MARKET BIAS: BEARISH
I will be watching the $62,000 support zone very closely.
💬 LET’S DISCUSS!
Do you think Bitcoin will:
🔴 Drop toward $60,400?
🟢 Recover above $64,000?
Share your prediction in the comments!
Follow @Trade_Master_X for daily Bitcoin updates and professional crypto market analysis.
⚠️ Educational content only. Not financial advice. Always do your own research.
#bitcoin #BTC #CryptoNews #MarketAnalysis #BinanceSquare
📉 BITCOIN BELOW $63,000 — BEARS ARE TAKING CONTROL!
Bitcoin is facing renewed selling pressure as macroeconomic uncertainty and market weakness continue to affect investor sentiment.
📊 MARKET OVERVIEW:
💰 BTC Price: Around $62,700
🔻 24H Change: -3.42%
📉 Market Sentiment: Bearish
🔴 WHY IS BITCOIN FALLING?
1️⃣ Hawkish Federal Reserve expectations are putting pressure on risk assets.
2️⃣ Bitcoin miners are adding selling pressure to the market.
3️⃣ Weak market sentiment is limiting buying momentum.
📍 IMPORTANT PRICE LEVELS:
🟢 SUPPORT ZONES:
$62,000
$60,400
🔴 RESISTANCE ZONES:
$63,300
$63,900
$64,700
📉 BEARISH SCENARIO:
If BTC fails to reclaim $63,300 and breaks below $62,000, further downside pressure could develop.
📈 BULLISH SCENARIO:
If buyers reclaim $63,300 and maintain momentum, BTC could attempt a recovery toward $63,900–$64,700.
🎯 MY MARKET BIAS: BEARISH
I will be watching the $62,000 support zone very closely.
💬 LET’S DISCUSS!
Do you think Bitcoin will:
🔴 Drop toward $60,400?
🟢 Recover above $64,000?
Share your prediction in the comments!
Follow @Trade_Master_X for daily Bitcoin updates and professional crypto market analysis.
⚠️ Educational content only. Not financial advice. Always do your own research.
#bitcoin #BTC #CryptoNews #MarketAnalysis #BinanceSquare
1
162

·
--
🚨 BITCOIN AT A CRITICAL TURNING POINT: RECOVERY OR ANOTHER DROP?
Bitcoin has fallen from $87,400 toward $62,000, facing significant selling pressure.
Several factors are increasing market uncertainty:
🔴 Institutional ETF outflows are weakening demand.
🔴 Large-holder exchange inflows are raising potential selling concerns.
🔴 Fed rate uncertainty is putting pressure on risk assets.
🔴 Declining stablecoin liquidity is making market recovery more difficult.
KEY BTC LEVELS:
Support: $62,000 / $60,000 / $58,500
Resistance: $66,300 / $68,000 / $74,100
A recovery above $66,300 could improve market sentiment. However, losing $62,000 on a daily closing basis could expose Bitcoin to further downside.
MY VIEW:
Bitcoin is approaching a critical decision point. The next major move will depend on institutional demand, market liquidity and whether buyers can defend current support levels.
Is this a potential market bottom, or are we facing another wave of selling?
#Bitcoin #BTC #CryptoMarket #Binance #MarketAnalysis
🚨 BITCOIN AT A CRITICAL TURNING POINT: RECOVERY OR ANOTHER DROP?
Bitcoin has fallen from $87,400 toward $62,000, facing significant selling pressure.
Several factors are increasing market uncertainty:
🔴 Institutional ETF outflows are weakening demand.
🔴 Large-holder exchange inflows are raising potential selling concerns.
🔴 Fed rate uncertainty is putting pressure on risk assets.
🔴 Declining stablecoin liquidity is making market recovery more difficult.
KEY BTC LEVELS:
Support: $62,000 / $60,000 / $58,500
Resistance: $66,300 / $68,000 / $74,100
A recovery above $66,300 could improve market sentiment. However, losing $62,000 on a daily closing basis could expose Bitcoin to further downside.
MY VIEW:
Bitcoin is approaching a critical decision point. The next major move will depend on institutional demand, market liquidity and whether buyers can defend current support levels.
Is this a potential market bottom, or are we facing another wave of selling?
#Bitcoin #BTC #CryptoMarket #Binance #MarketAnalysis
Bitcoin has fallen from $87,400 toward $62,000, facing significant selling pressure.
Several factors are increasing market uncertainty:
🔴 Institutional ETF outflows are weakening demand.
🔴 Large-holder exchange inflows are raising potential selling concerns.
🔴 Fed rate uncertainty is putting pressure on risk assets.
🔴 Declining stablecoin liquidity is making market recovery more difficult.
KEY BTC LEVELS:
Support: $62,000 / $60,000 / $58,500
Resistance: $66,300 / $68,000 / $74,100
A recovery above $66,300 could improve market sentiment. However, losing $62,000 on a daily closing basis could expose Bitcoin to further downside.
MY VIEW:
Bitcoin is approaching a critical decision point. The next major move will depend on institutional demand, market liquidity and whether buyers can defend current support levels.
Is this a potential market bottom, or are we facing another wave of selling?
#Bitcoin #BTC #CryptoMarket #Binance #MarketAnalysis

3
185
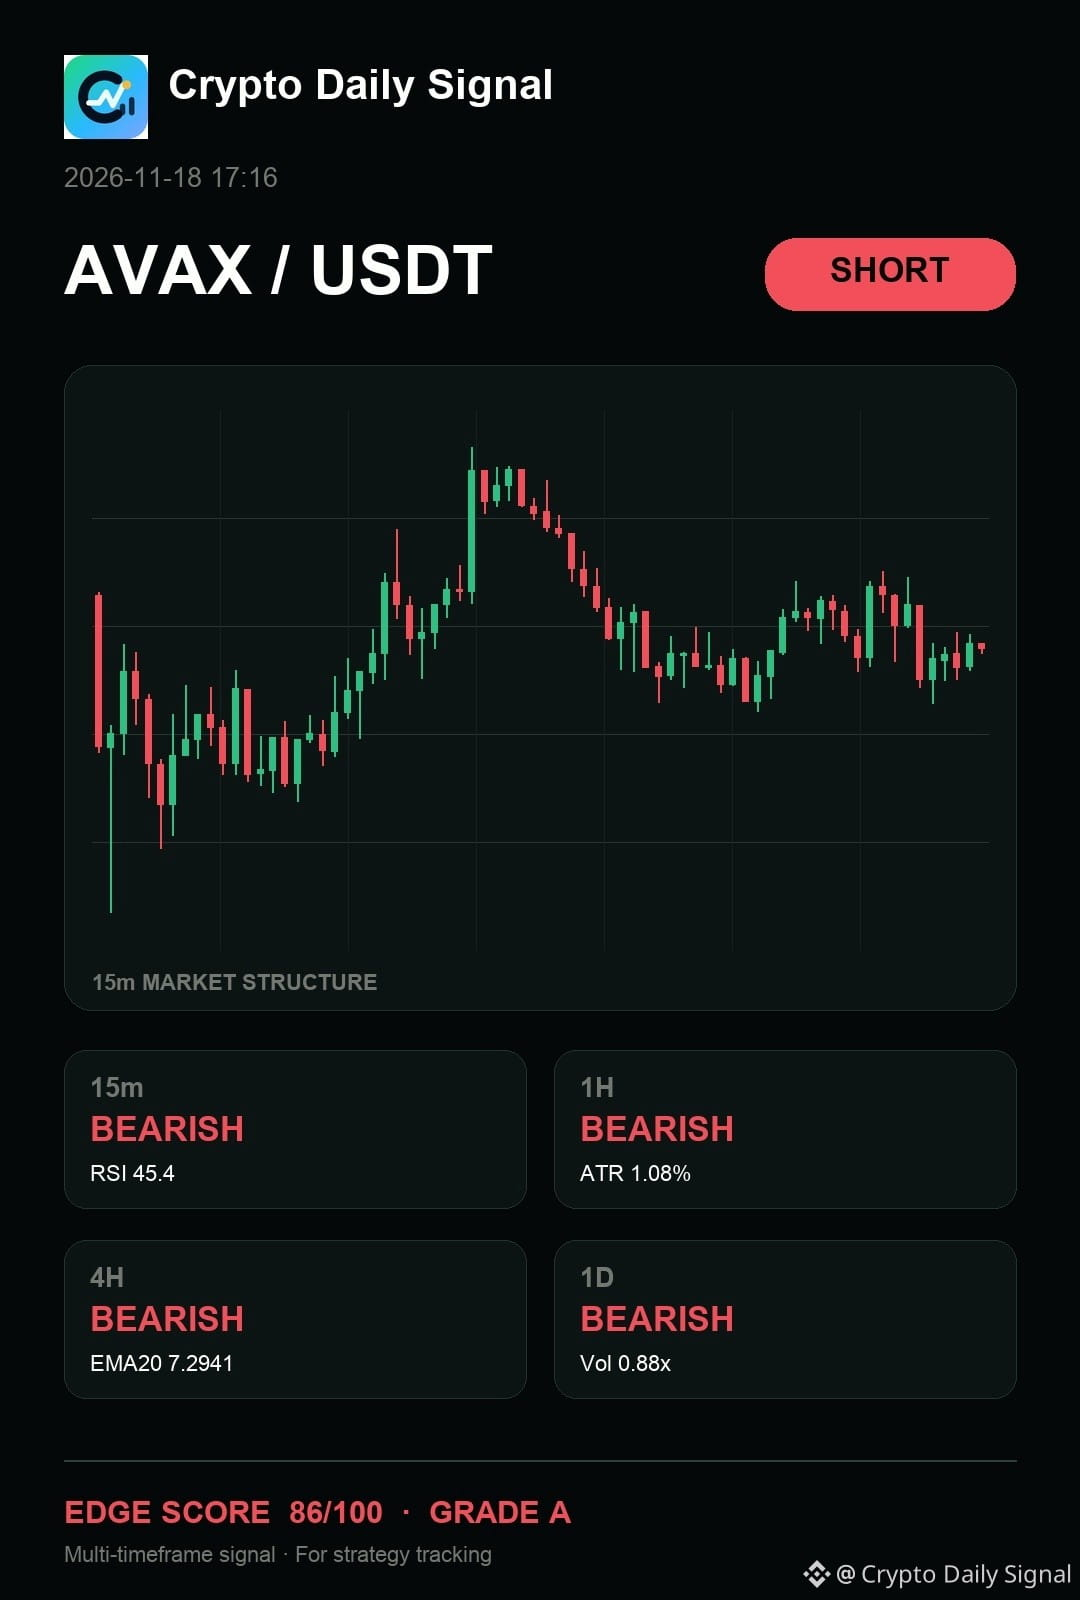
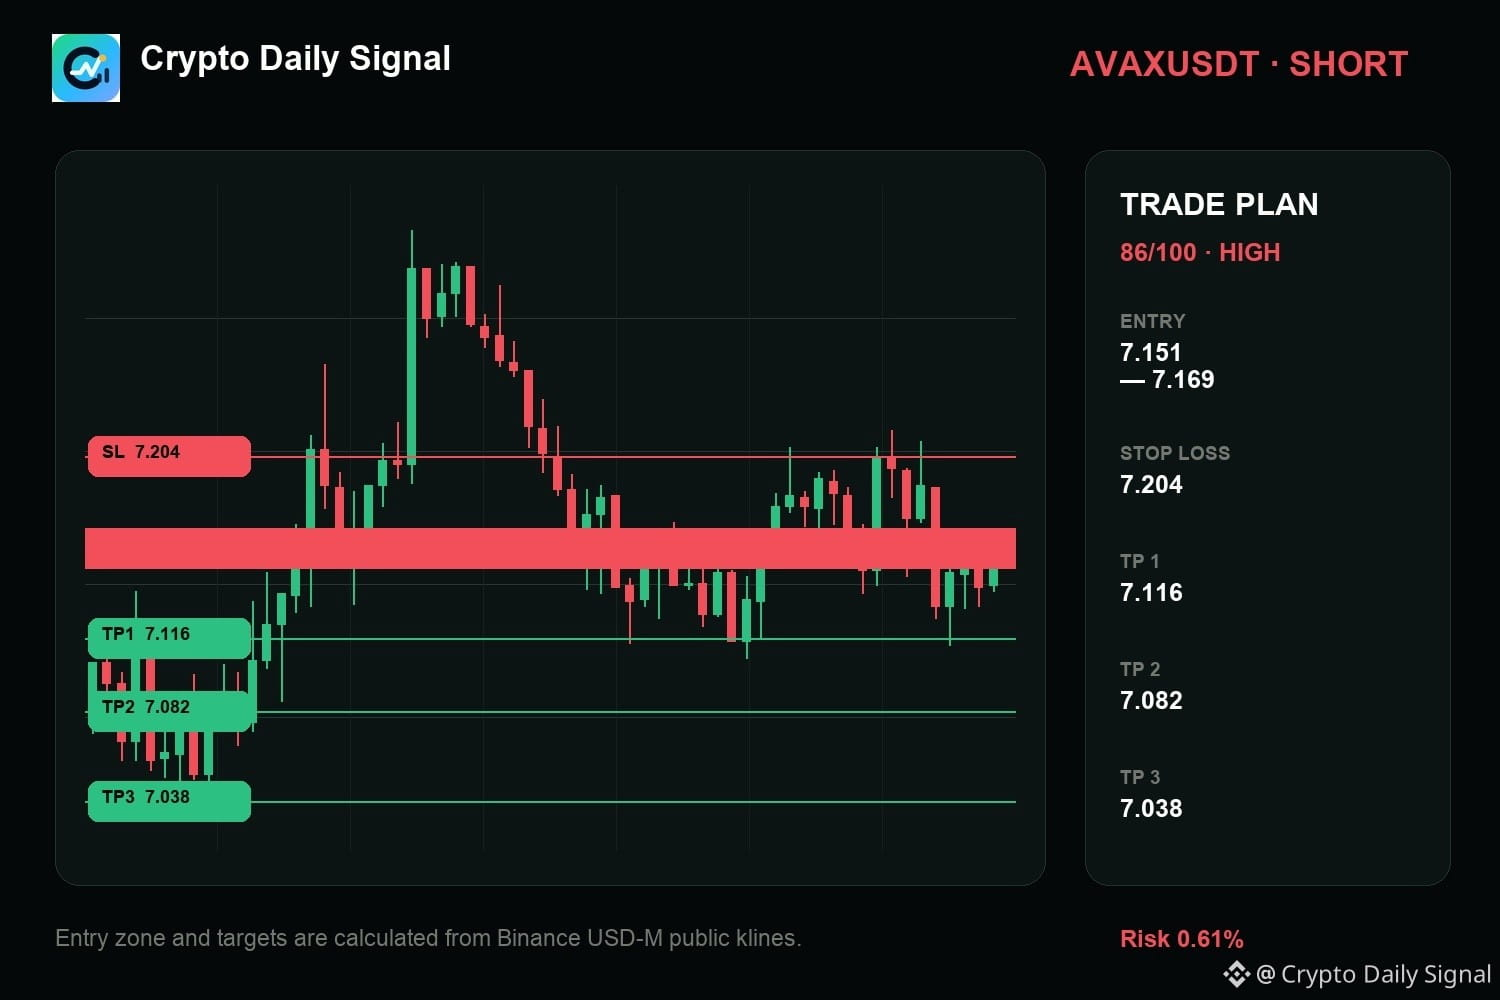
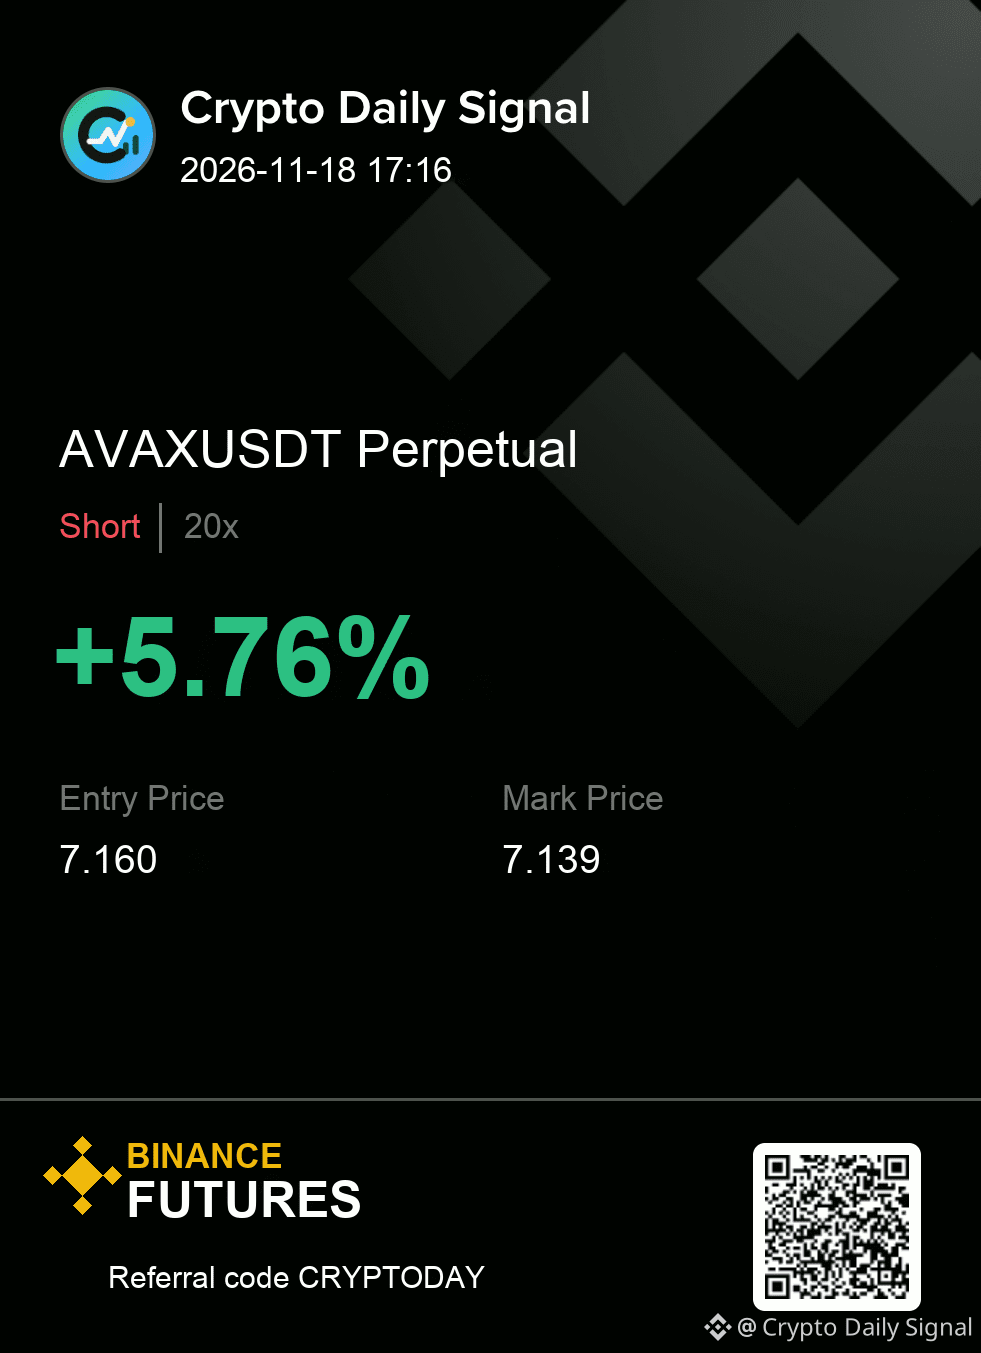
$AVAX — real talk, I am treating it like it has not invalidated the short case because the price keeps honoring the descending line made by previous peaks. The recent smaller time frame candles show a clear pattern of selling off, fitting the overall downward direction. A clean drop below that last small dip would confirm the bias for a bearish move.
Levels — AVAXUSDT
Zone: 7.151 - 7.169
Cut: 7.204
Scale: 7.116 | 7.082 | 7.038
#MarketAnalysis
{future}(AVAXUSDT)
$AVAX — real talk, I am treating it like it has not invalidated the short case because the price keeps honoring the descending line made by previous peaks. The recent smaller time frame candles show a clear pattern of selling off, fitting the overall downward direction. A clean drop below that last small dip would confirm the bias for a bearish move.
Levels — AVAXUSDT
Zone: 7.151 - 7.169
Cut: 7.204
Scale: 7.116 | 7.082 | 7.038
#MarketAnalysis
Levels — AVAXUSDT
Zone: 7.151 - 7.169
Cut: 7.204
Scale: 7.116 | 7.082 | 7.038
#MarketAnalysis
7


·
--

Article
Bitcoin at $64K: A Market Trying to Find Its Floor, Not Yet Its DirectionNovember 18, 2026 | BTC Market Analysis
Bitcoin has spent the past three days trying to stabilize after a sharp selloff pushed prices toward $62,000. The immediate selling pressure has eased, but the recovery has been anything but convincing.
What concerns me isn't necessarily the decline itself. Bitcoin has experienced far more aggressive corrections throughout its history. The more important question is why buyers have struggled to regain control despite a meaningful reset in leverage and signs of renewed demand at lower prices.
Looking at the market between November 16 and 18, I see early evidence of stabilization, but very little to suggest that a durable bottom has been established.
Price action tells us more than the initial bounce.
After briefly trading near $62,018 on November 15, Bitcoin recovered to close around $65,305. That was a relatively strong reaction to a significant selloff.
But the follow-through was disappointing.
$BTC closed November 16 near $64,856 and November 17 around $64,894. By the morning of November 18, it was still struggling around the $64,000–$65,000 area.
Two consecutive sessions of consolidation after a sharp decline can be interpreted in different ways. Buyers may be absorbing supply, or sellers may simply be waiting for better prices to exit.
For now, the evidence doesn't allow us to confidently distinguish between the two.
What I would like to see is a sustained move above $65,500, followed by a successful retest of that level as support. Until then, the recent bounce remains a recovery attempt within a damaged market structure.
Institutional demand remains the missing piece
The ETF data is particularly revealing.
US spot Bitcoin ETFs recorded approximately $1.91 billion in cumulative net outflows over seven consecutive trading sessions before finally returning to modest positive territory on November 16.
BlackRock's IBIT attracted roughly $76.5 million that day. However, redemptions from Fidelity's FBTC and Grayscale's GBTC offset much of those inflows, leaving aggregate net inflows at just $7.9 million.
The preliminary November 17 figures subsequently pointed to renewed net outflows.
To put that into perspective, a single positive session following nearly $2 billion in withdrawals is hardly evidence of a meaningful institutional reversal.
IBIT's inflow is encouraging, but aggregate ETF flows matter considerably more than the performance of any individual fund.
This is where I think some market participants are becoming too optimistic. Institutional demand hasn't disappeared, but it is no longer providing the consistent support that helped sustain previous advances.
Until we see several consecutive sessions of substantial net inflows, I would be reluctant to interpret the current price action as the beginning of a new accumulation phase.
On-chain data suggests capitulation, but capitulation isn't always the bottom
Glassnode's latest analysis adds another dimension to the picture.
Realized losses have increased considerably as short-term holders, particularly those who accumulated Bitcoin during the previous six months, have been forced to reassess their positions.
This matters because selling at a loss can accelerate during periods of declining confidence. Once enough investors begin cutting exposure, price movements can become increasingly disconnected from longer-term fundamentals.
At the same time, the $62,000–$66,000 area has emerged as an important concentration of short-term holder cost basis.
Glassnode's observations suggest that approximately 66,000 additional BTC accumulated within this cost-basis cluster during the two most intense days of selling.
That tells us something important: supply is changing hands.
However, I would be careful about describing this activity as aggressive whale accumulation. On-chain cost-basis data can identify changes in ownership and positioning, but it doesn't necessarily establish the intentions or investment horizons of the buyers involved.
What it does suggest is that there is meaningful interest in Bitcoin at current valuations.
Whether that demand is sufficient to establish a lasting floor remains unresolved.
The leverage reset has improved conditions, but it hasn't repaired market confidence
Another development worth examining is the change in derivatives positioning.
The selloff triggered substantial liquidations across the crypto market, disproportionately affecting leveraged long positions.
By November 18, Bitcoin futures open interest remained around $41.8 billion, with funding rates relatively subdued at approximately +0.0041% per eight hours.
The reduction in speculative excess is constructive.
Highly leveraged markets are vulnerable to liquidation cascades, where falling prices trigger forced selling that subsequently drives prices even lower. Removing some of that leverage reduces one source of instability.
But there is an important distinction between eliminating excess leverage and attracting fresh capital.
Short covering and reduced liquidation pressure can support temporary recoveries. They cannot, on their own, sustain a broader uptrend.
For a convincing reversal, I want to see stronger spot market participation rather than a rally driven primarily by derivatives positioning.
That distinction will become particularly important if Bitcoin begins approaching resistance around $66,000.
The macro backdrop is still working against risk assets
Bitcoin's weakness also needs to be considered within the broader financial environment.
Persistent inflation concerns, uncertainty surrounding the Federal Reserve's policy path, elevated bond yields and a firm US dollar have complicated the outlook for risk-sensitive assets.
Bitcoin may have increasingly sophisticated institutional infrastructure, but it remains highly sensitive to global liquidity conditions.
When investors become more defensive and the opportunity cost of holding speculative assets rises, crypto markets frequently experience pressure.
This is also why I am paying attention to stablecoin liquidity.
Glassnode reported a roughly 4.2% contraction in circulating stablecoin supply over the preceding 90 days. While this is not a direct measure of capital available to purchase BTC, it does point to a less supportive liquidity environment.
A sustainable Bitcoin recovery would be considerably more convincing if accompanied by expanding stablecoin supply, improving ETF flows and stronger spot demand.
At present, those conditions are not clearly aligned.
The levels that matter from here
I am primarily watching three areas.
$65,500–$68,000: The recovery test.
A sustained move through $65,500 would be the first meaningful improvement in the short-term structure. The $68,000 area is particularly significant given its proximity to the 200-week moving average highlighted by Wintermute.
Reclaiming that region would materially improve the technical picture, although it would not automatically confirm a return to a long-term bullish trend.
$62,000–$63,000: The immediate demand zone.
This is where buyers recently demonstrated their willingness to absorb selling pressure.
If Bitcoin revisits the area and holds above the previous low, the possibility of a developing base becomes more credible.
The quality of that defense matters more than the speed of the initial rebound.
Below $62,000: The downside risk increases.
A decisive breakdown, particularly if accompanied by expanding spot selling and renewed long liquidations, would weaken the stabilization thesis.
In that scenario, $60,000 becomes the next important psychological reference, followed by the previous support area around $58,500.
Glassnode's estimated realized price near $53,700 provides a deeper on-chain reference if market conditions deteriorate significantly. I would treat that as a potential valuation reference rather than a price target.
My assessment
I am not convinced Bitcoin has established its bottom. Equally, I don't think the available evidence justifies assuming another major breakdown is inevitable.
What we have today is a market attempting to find equilibrium following a substantial liquidation event.
The encouraging developments are the absorption of supply around $62,000, the reduction in excessive leverage and the first signs that some institutional demand is returning.
The less encouraging developments are the lack of sustained ETF inflows, declining stablecoin liquidity, continued macroeconomic uncertainty and a technical structure that remains vulnerable below $68,000.
My base case is continued volatility and consolidation until one side demonstrates a clear advantage.
I would become more constructive if Bitcoin reclaimed $66,000 with improving spot volume and persistent ETF inflows. Conversely, a confirmed loss of $62,000 would force me to reassess the likelihood of a deeper correction.
For longer-term investors, current levels may offer a more attractive starting point for gradual accumulation than the elevated prices seen earlier in the cycle. But attractive valuations and favorable timing are not necessarily the same thing.
For short-term traders, I see little justification for aggressively anticipating a breakout before the market provides confirmation.
The critical point is that Bitcoin has shown buyers are willing to defend lower prices. It has not yet shown they are willing to chase higher ones.
That is the difference between a market finding temporary support and one genuinely preparing for its next sustained advance.
And until that changes, I would rather remain patient than mistake a pause in selling for the beginning of a new bull market.
Are we witnessing the early stages of accumulation around $62K, or does Bitcoin still need another capitulation event before a sustainable recovery can begin?
#Bitcoin #BTC #CryptoMarkets #MarketAnalysis
Market commentary based on data available on November 18, 2026. Not financial advice.
{future}(BTCUSDT)
Bitcoin at $64K: A Market Trying to Find Its Floor, Not Yet Its Direction
November 18, 2026 | BTC Market Analysis
Bitcoin has spent the past three days trying to stabilize after a sharp selloff pushed prices toward $62,000. The immediate selling pressure has eased, but the recovery has been anything but convincing.
What concerns me isn't necessarily the decline itself. Bitcoin has experienced far more aggressive corrections throughout its history. The more important question is why buyers have struggled to regain control despite a meaningful reset in leverage and signs of renewed demand at lower prices.
Looking at the market between November 16 and 18, I see early evidence of stabilization, but very little to suggest that a durable bottom has been established.
Price action tells us more than the initial bounce.
After briefly trading near $62,018 on November 15, Bitcoin recovered to close around $65,305. That was a relatively strong reaction to a significant selloff.
But the follow-through was disappointing.
$BTC closed November 16 near $64,856 and November 17 around $64,894. By the morning of November 18, it was still struggling around the $64,000–$65,000 area.
Two consecutive sessions of consolidation after a sharp decline can be interpreted in different ways. Buyers may be absorbing supply, or sellers may simply be waiting for better prices to exit.
For now, the evidence doesn't allow us to confidently distinguish between the two.
What I would like to see is a sustained move above $65,500, followed by a successful retest of that level as support. Until then, the recent bounce remains a recovery attempt within a damaged market structure.
Institutional demand remains the missing piece
The ETF data is particularly revealing.
US spot Bitcoin ETFs recorded approximately $1.91 billion in cumulative net outflows over seven consecutive trading sessions before finally returning to modest positive territory on November 16.
BlackRock's IBIT attracted roughly $76.5 million that day. However, redemptions from Fidelity's FBTC and Grayscale's GBTC offset much of those inflows, leaving aggregate net inflows at just $7.9 million.
The preliminary November 17 figures subsequently pointed to renewed net outflows.
To put that into perspective, a single positive session following nearly $2 billion in withdrawals is hardly evidence of a meaningful institutional reversal.
IBIT's inflow is encouraging, but aggregate ETF flows matter considerably more than the performance of any individual fund.
This is where I think some market participants are becoming too optimistic. Institutional demand hasn't disappeared, but it is no longer providing the consistent support that helped sustain previous advances.
Until we see several consecutive sessions of substantial net inflows, I would be reluctant to interpret the current price action as the beginning of a new accumulation phase.
On-chain data suggests capitulation, but capitulation isn't always the bottom
Glassnode's latest analysis adds another dimension to the picture.
Realized losses have increased considerably as short-term holders, particularly those who accumulated Bitcoin during the previous six months, have been forced to reassess their positions.
This matters because selling at a loss can accelerate during periods of declining confidence. Once enough investors begin cutting exposure, price movements can become increasingly disconnected from longer-term fundamentals.
At the same time, the $62,000–$66,000 area has emerged as an important concentration of short-term holder cost basis.
Glassnode's observations suggest that approximately 66,000 additional BTC accumulated within this cost-basis cluster during the two most intense days of selling.
That tells us something important: supply is changing hands.
However, I would be careful about describing this activity as aggressive whale accumulation. On-chain cost-basis data can identify changes in ownership and positioning, but it doesn't necessarily establish the intentions or investment horizons of the buyers involved.
What it does suggest is that there is meaningful interest in Bitcoin at current valuations.
Whether that demand is sufficient to establish a lasting floor remains unresolved.
The leverage reset has improved conditions, but it hasn't repaired market confidence
Another development worth examining is the change in derivatives positioning.
The selloff triggered substantial liquidations across the crypto market, disproportionately affecting leveraged long positions.
By November 18, Bitcoin futures open interest remained around $41.8 billion, with funding rates relatively subdued at approximately +0.0041% per eight hours.
The reduction in speculative excess is constructive.
Highly leveraged markets are vulnerable to liquidation cascades, where falling prices trigger forced selling that subsequently drives prices even lower. Removing some of that leverage reduces one source of instability.
But there is an important distinction between eliminating excess leverage and attracting fresh capital.
Short covering and reduced liquidation pressure can support temporary recoveries. They cannot, on their own, sustain a broader uptrend.
For a convincing reversal, I want to see stronger spot market participation rather than a rally driven primarily by derivatives positioning.
That distinction will become particularly important if Bitcoin begins approaching resistance around $66,000.
The macro backdrop is still working against risk assets
Bitcoin's weakness also needs to be considered within the broader financial environment.
Persistent inflation concerns, uncertainty surrounding the Federal Reserve's policy path, elevated bond yields and a firm US dollar have complicated the outlook for risk-sensitive assets.
Bitcoin may have increasingly sophisticated institutional infrastructure, but it remains highly sensitive to global liquidity conditions.
When investors become more defensive and the opportunity cost of holding speculative assets rises, crypto markets frequently experience pressure.
This is also why I am paying attention to stablecoin liquidity.
Glassnode reported a roughly 4.2% contraction in circulating stablecoin supply over the preceding 90 days. While this is not a direct measure of capital available to purchase BTC, it does point to a less supportive liquidity environment.
A sustainable Bitcoin recovery would be considerably more convincing if accompanied by expanding stablecoin supply, improving ETF flows and stronger spot demand.
At present, those conditions are not clearly aligned.
The levels that matter from here
I am primarily watching three areas.
$65,500–$68,000: The recovery test.
A sustained move through $65,500 would be the first meaningful improvement in the short-term structure. The $68,000 area is particularly significant given its proximity to the 200-week moving average highlighted by Wintermute.
Reclaiming that region would materially improve the technical picture, although it would not automatically confirm a return to a long-term bullish trend.
$62,000–$63,000: The immediate demand zone.
This is where buyers recently demonstrated their willingness to absorb selling pressure.
If Bitcoin revisits the area and holds above the previous low, the possibility of a developing base becomes more credible.
The quality of that defense matters more than the speed of the initial rebound.
Below $62,000: The downside risk increases.
A decisive breakdown, particularly if accompanied by expanding spot selling and renewed long liquidations, would weaken the stabilization thesis.
In that scenario, $60,000 becomes the next important psychological reference, followed by the previous support area around $58,500.
Glassnode's estimated realized price near $53,700 provides a deeper on-chain reference if market conditions deteriorate significantly. I would treat that as a potential valuation reference rather than a price target.
My assessment
I am not convinced Bitcoin has established its bottom. Equally, I don't think the available evidence justifies assuming another major breakdown is inevitable.
What we have today is a market attempting to find equilibrium following a substantial liquidation event.
The encouraging developments are the absorption of supply around $62,000, the reduction in excessive leverage and the first signs that some institutional demand is returning.
The less encouraging developments are the lack of sustained ETF inflows, declining stablecoin liquidity, continued macroeconomic uncertainty and a technical structure that remains vulnerable below $68,000.
My base case is continued volatility and consolidation until one side demonstrates a clear advantage.
I would become more constructive if Bitcoin reclaimed $66,000 with improving spot volume and persistent ETF inflows. Conversely, a confirmed loss of $62,000 would force me to reassess the likelihood of a deeper correction.
For longer-term investors, current levels may offer a more attractive starting point for gradual accumulation than the elevated prices seen earlier in the cycle. But attractive valuations and favorable timing are not necessarily the same thing.
For short-term traders, I see little justification for aggressively anticipating a breakout before the market provides confirmation.
The critical point is that Bitcoin has shown buyers are willing to defend lower prices. It has not yet shown they are willing to chase higher ones.
That is the difference between a market finding temporary support and one genuinely preparing for its next sustained advance.
And until that changes, I would rather remain patient than mistake a pause in selling for the beginning of a new bull market.
Are we witnessing the early stages of accumulation around $62K, or does Bitcoin still need another capitulation event before a sustainable recovery can begin?
#Bitcoin #BTC #CryptoMarkets #MarketAnalysis
Market commentary based on data available on November 18, 2026. Not financial advice.
Bitcoin has spent the past three days trying to stabilize after a sharp selloff pushed prices toward $62,000. The immediate selling pressure has eased, but the recovery has been anything but convincing.
What concerns me isn't necessarily the decline itself. Bitcoin has experienced far more aggressive corrections throughout its history. The more important question is why buyers have struggled to regain control despite a meaningful reset in leverage and signs of renewed demand at lower prices.
Looking at the market between November 16 and 18, I see early evidence of stabilization, but very little to suggest that a durable bottom has been established.
Price action tells us more than the initial bounce.
After briefly trading near $62,018 on November 15, Bitcoin recovered to close around $65,305. That was a relatively strong reaction to a significant selloff.
But the follow-through was disappointing.
$BTC closed November 16 near $64,856 and November 17 around $64,894. By the morning of November 18, it was still struggling around the $64,000–$65,000 area.
Two consecutive sessions of consolidation after a sharp decline can be interpreted in different ways. Buyers may be absorbing supply, or sellers may simply be waiting for better prices to exit.
For now, the evidence doesn't allow us to confidently distinguish between the two.
What I would like to see is a sustained move above $65,500, followed by a successful retest of that level as support. Until then, the recent bounce remains a recovery attempt within a damaged market structure.
Institutional demand remains the missing piece
The ETF data is particularly revealing.
US spot Bitcoin ETFs recorded approximately $1.91 billion in cumulative net outflows over seven consecutive trading sessions before finally returning to modest positive territory on November 16.
BlackRock's IBIT attracted roughly $76.5 million that day. However, redemptions from Fidelity's FBTC and Grayscale's GBTC offset much of those inflows, leaving aggregate net inflows at just $7.9 million.
The preliminary November 17 figures subsequently pointed to renewed net outflows.
To put that into perspective, a single positive session following nearly $2 billion in withdrawals is hardly evidence of a meaningful institutional reversal.
IBIT's inflow is encouraging, but aggregate ETF flows matter considerably more than the performance of any individual fund.
This is where I think some market participants are becoming too optimistic. Institutional demand hasn't disappeared, but it is no longer providing the consistent support that helped sustain previous advances.
Until we see several consecutive sessions of substantial net inflows, I would be reluctant to interpret the current price action as the beginning of a new accumulation phase.
On-chain data suggests capitulation, but capitulation isn't always the bottom
Glassnode's latest analysis adds another dimension to the picture.
Realized losses have increased considerably as short-term holders, particularly those who accumulated Bitcoin during the previous six months, have been forced to reassess their positions.
This matters because selling at a loss can accelerate during periods of declining confidence. Once enough investors begin cutting exposure, price movements can become increasingly disconnected from longer-term fundamentals.
At the same time, the $62,000–$66,000 area has emerged as an important concentration of short-term holder cost basis.
Glassnode's observations suggest that approximately 66,000 additional BTC accumulated within this cost-basis cluster during the two most intense days of selling.
That tells us something important: supply is changing hands.
However, I would be careful about describing this activity as aggressive whale accumulation. On-chain cost-basis data can identify changes in ownership and positioning, but it doesn't necessarily establish the intentions or investment horizons of the buyers involved.
What it does suggest is that there is meaningful interest in Bitcoin at current valuations.
Whether that demand is sufficient to establish a lasting floor remains unresolved.
The leverage reset has improved conditions, but it hasn't repaired market confidence
Another development worth examining is the change in derivatives positioning.
The selloff triggered substantial liquidations across the crypto market, disproportionately affecting leveraged long positions.
By November 18, Bitcoin futures open interest remained around $41.8 billion, with funding rates relatively subdued at approximately +0.0041% per eight hours.
The reduction in speculative excess is constructive.
Highly leveraged markets are vulnerable to liquidation cascades, where falling prices trigger forced selling that subsequently drives prices even lower. Removing some of that leverage reduces one source of instability.
But there is an important distinction between eliminating excess leverage and attracting fresh capital.
Short covering and reduced liquidation pressure can support temporary recoveries. They cannot, on their own, sustain a broader uptrend.
For a convincing reversal, I want to see stronger spot market participation rather than a rally driven primarily by derivatives positioning.
That distinction will become particularly important if Bitcoin begins approaching resistance around $66,000.
The macro backdrop is still working against risk assets
Bitcoin's weakness also needs to be considered within the broader financial environment.
Persistent inflation concerns, uncertainty surrounding the Federal Reserve's policy path, elevated bond yields and a firm US dollar have complicated the outlook for risk-sensitive assets.
Bitcoin may have increasingly sophisticated institutional infrastructure, but it remains highly sensitive to global liquidity conditions.
When investors become more defensive and the opportunity cost of holding speculative assets rises, crypto markets frequently experience pressure.
This is also why I am paying attention to stablecoin liquidity.
Glassnode reported a roughly 4.2% contraction in circulating stablecoin supply over the preceding 90 days. While this is not a direct measure of capital available to purchase BTC, it does point to a less supportive liquidity environment.
A sustainable Bitcoin recovery would be considerably more convincing if accompanied by expanding stablecoin supply, improving ETF flows and stronger spot demand.
At present, those conditions are not clearly aligned.
The levels that matter from here
I am primarily watching three areas.
$65,500–$68,000: The recovery test.
A sustained move through $65,500 would be the first meaningful improvement in the short-term structure. The $68,000 area is particularly significant given its proximity to the 200-week moving average highlighted by Wintermute.
Reclaiming that region would materially improve the technical picture, although it would not automatically confirm a return to a long-term bullish trend.
$62,000–$63,000: The immediate demand zone.
This is where buyers recently demonstrated their willingness to absorb selling pressure.
If Bitcoin revisits the area and holds above the previous low, the possibility of a developing base becomes more credible.
The quality of that defense matters more than the speed of the initial rebound.
Below $62,000: The downside risk increases.
A decisive breakdown, particularly if accompanied by expanding spot selling and renewed long liquidations, would weaken the stabilization thesis.
In that scenario, $60,000 becomes the next important psychological reference, followed by the previous support area around $58,500.
Glassnode's estimated realized price near $53,700 provides a deeper on-chain reference if market conditions deteriorate significantly. I would treat that as a potential valuation reference rather than a price target.
My assessment
I am not convinced Bitcoin has established its bottom. Equally, I don't think the available evidence justifies assuming another major breakdown is inevitable.
What we have today is a market attempting to find equilibrium following a substantial liquidation event.
The encouraging developments are the absorption of supply around $62,000, the reduction in excessive leverage and the first signs that some institutional demand is returning.
The less encouraging developments are the lack of sustained ETF inflows, declining stablecoin liquidity, continued macroeconomic uncertainty and a technical structure that remains vulnerable below $68,000.
My base case is continued volatility and consolidation until one side demonstrates a clear advantage.
I would become more constructive if Bitcoin reclaimed $66,000 with improving spot volume and persistent ETF inflows. Conversely, a confirmed loss of $62,000 would force me to reassess the likelihood of a deeper correction.
For longer-term investors, current levels may offer a more attractive starting point for gradual accumulation than the elevated prices seen earlier in the cycle. But attractive valuations and favorable timing are not necessarily the same thing.
For short-term traders, I see little justification for aggressively anticipating a breakout before the market provides confirmation.
The critical point is that Bitcoin has shown buyers are willing to defend lower prices. It has not yet shown they are willing to chase higher ones.
That is the difference between a market finding temporary support and one genuinely preparing for its next sustained advance.
And until that changes, I would rather remain patient than mistake a pause in selling for the beginning of a new bull market.
Are we witnessing the early stages of accumulation around $62K, or does Bitcoin still need another capitulation event before a sustainable recovery can begin?
#Bitcoin #BTC #CryptoMarkets #MarketAnalysis
Market commentary based on data available on November 18, 2026. Not financial advice.
84
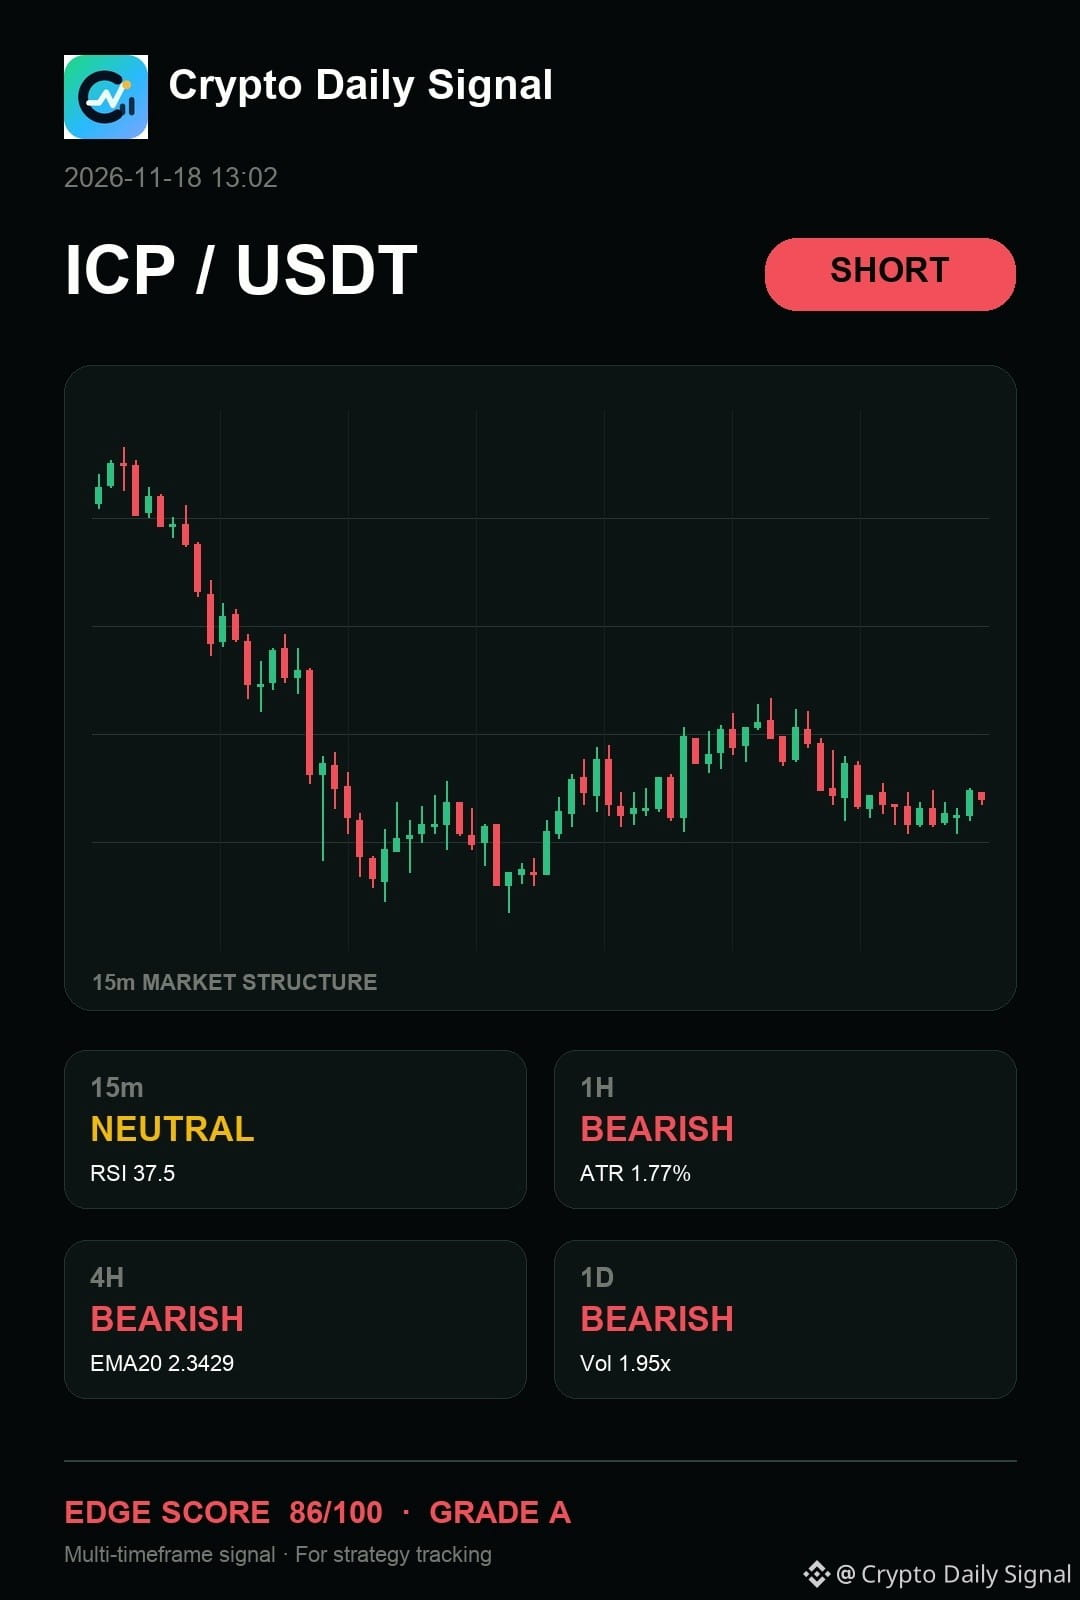
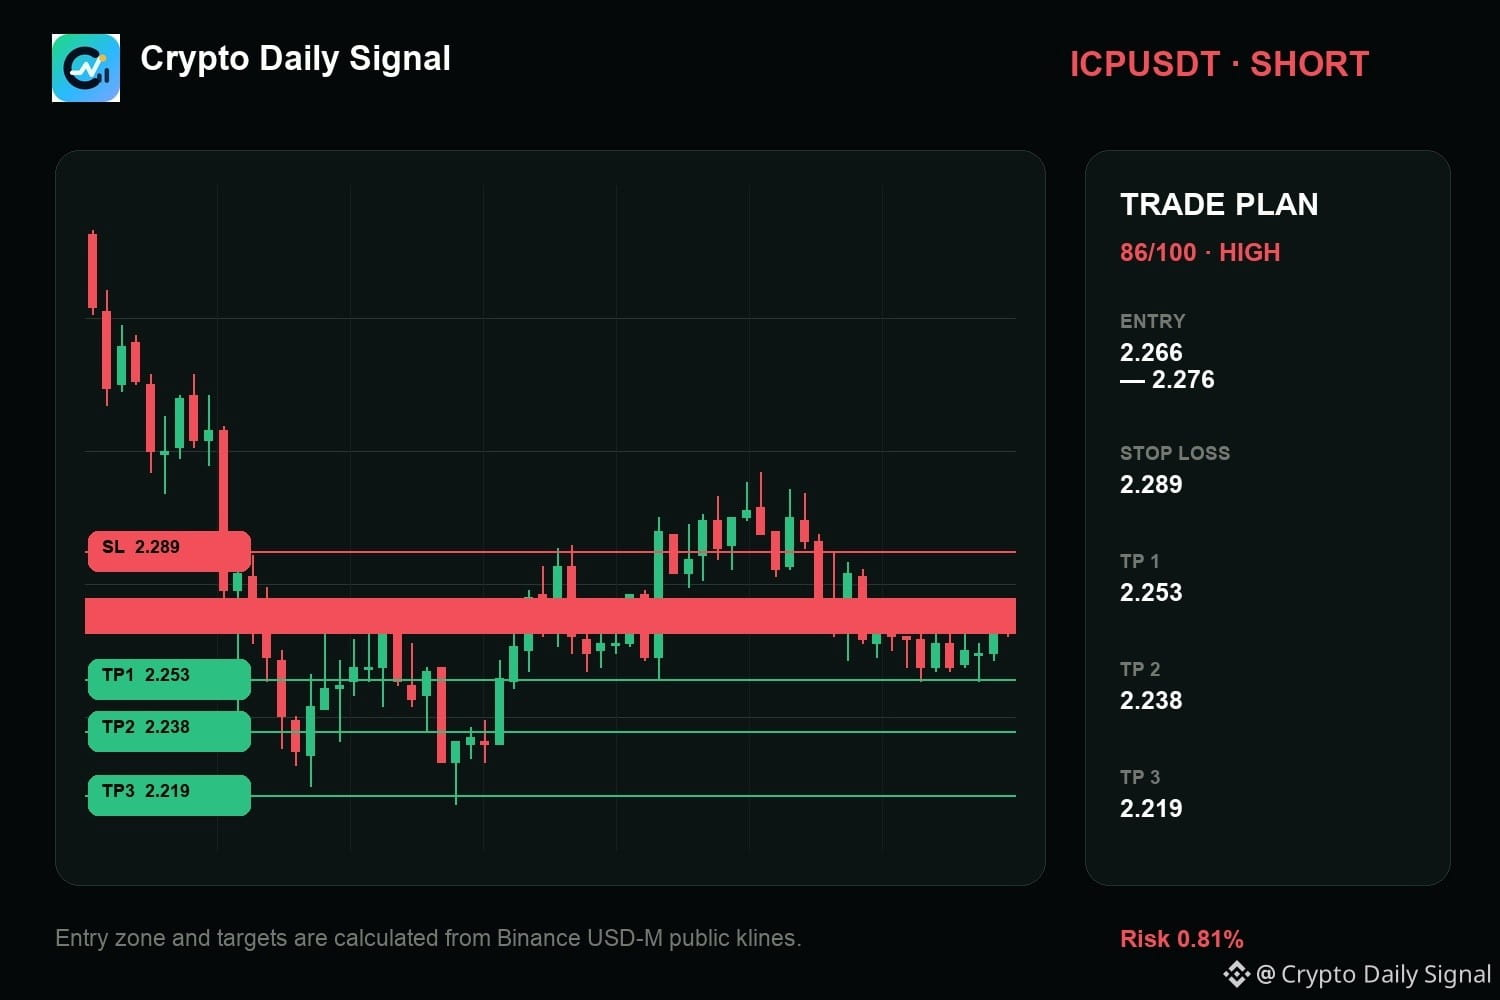
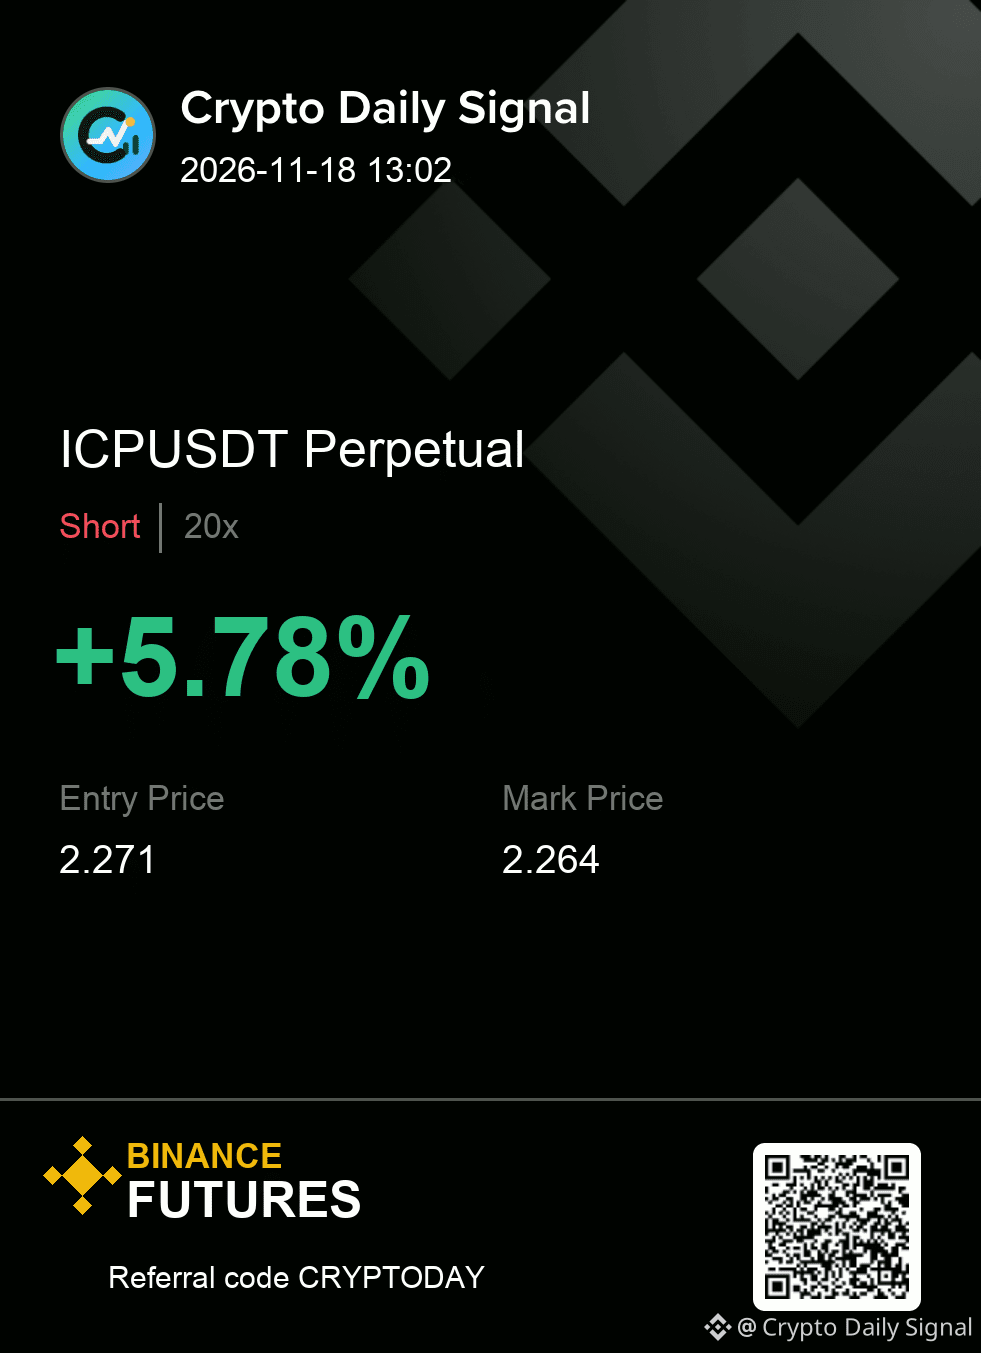
$ICP — look, my read is simple: it keeps the bearish thesis active as it trades near the bottom of a tight range, showing lower highs and lower lows across the chart. Chasing a bounce here feels premature given the bearish bias across every time frame visible. A decisive drop under the range floor would make this a more reliable signal to enter.
Execution is simple here: respect the zone and respect the cut.
ICPUSDT SHORT
IN 2.266 - 2.276
OUT 2.289
TP 2.253 · 2.238 · 2.219
#MarketAnalysis
{future}(ICPUSDT)
$ICP — look, my read is simple: it keeps the bearish thesis active as it trades near the bottom of a tight range, showing lower highs and lower lows across the chart. Chasing a bounce here feels premature given the bearish bias across every time frame visible. A decisive drop under the range floor would make this a more reliable signal to enter.
Execution is simple here: respect the zone and respect the cut.
ICPUSDT SHORT
IN 2.266 - 2.276
OUT 2.289
TP 2.253 · 2.238 · 2.219
#MarketAnalysis
Execution is simple here: respect the zone and respect the cut.
ICPUSDT SHORT
IN 2.266 - 2.276
OUT 2.289
TP 2.253 · 2.238 · 2.219
#MarketAnalysis
12

·
--
Bearish
#CryptoTradingInsights #BTC #marketanalysis
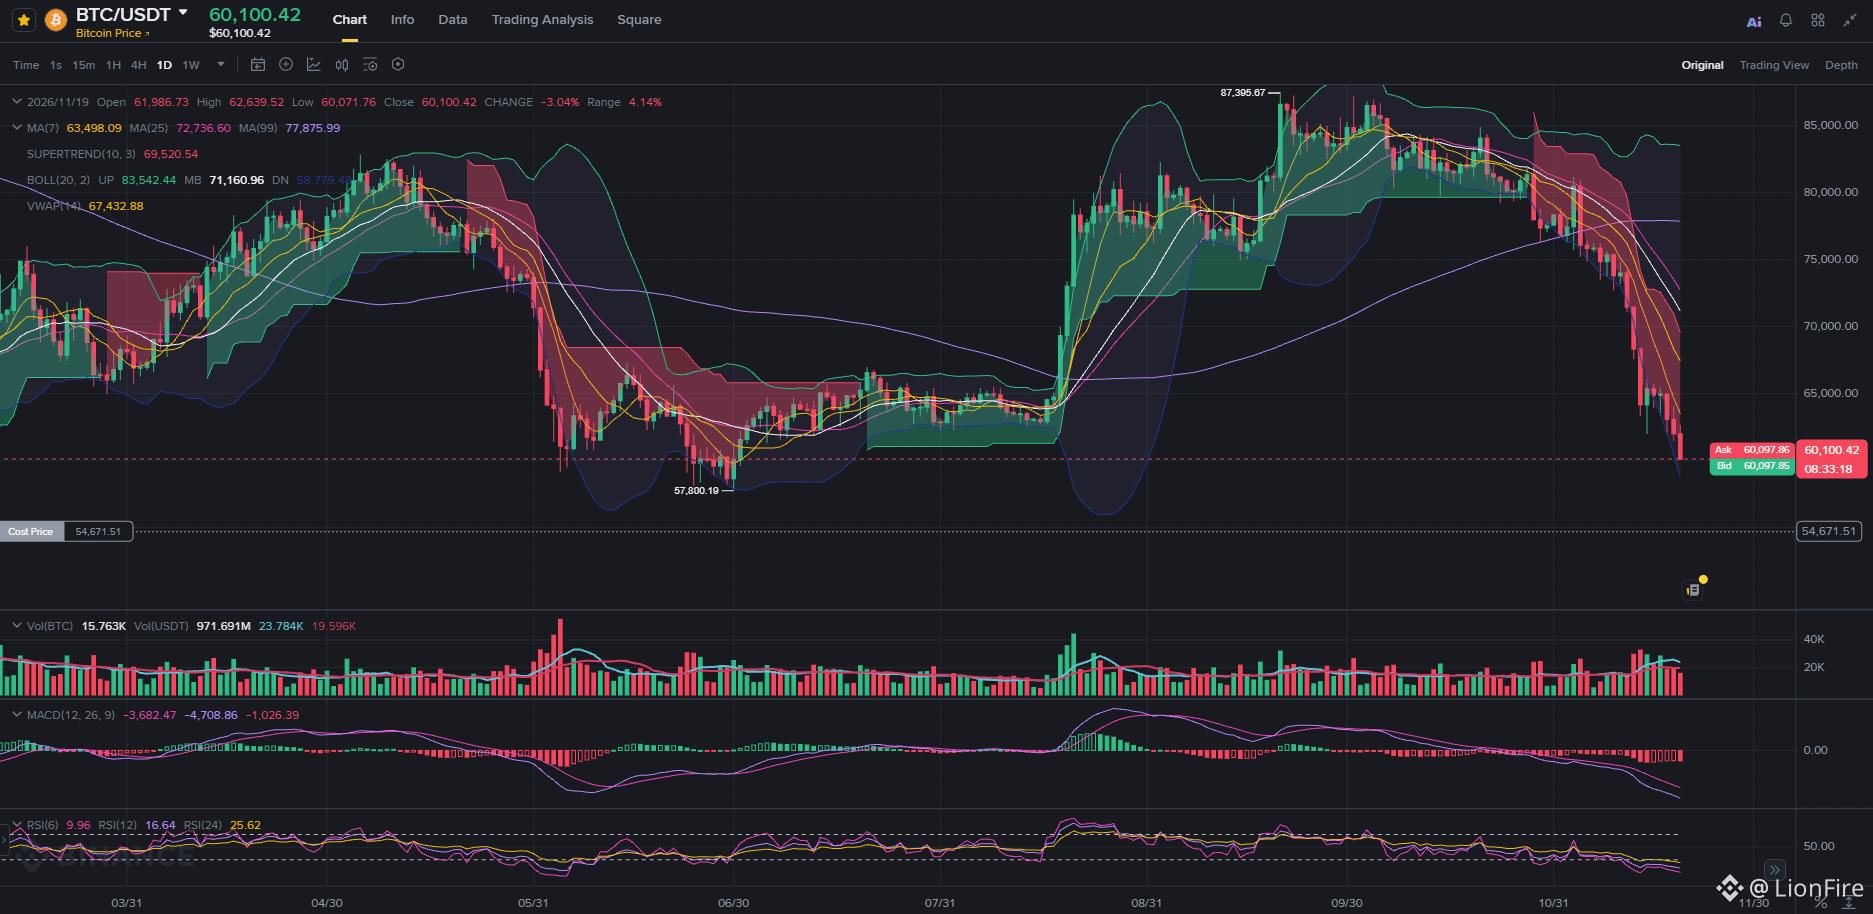
🔴 BITCOIN FALLS TO $60,185: Psychological fear or technical test? ⚠️
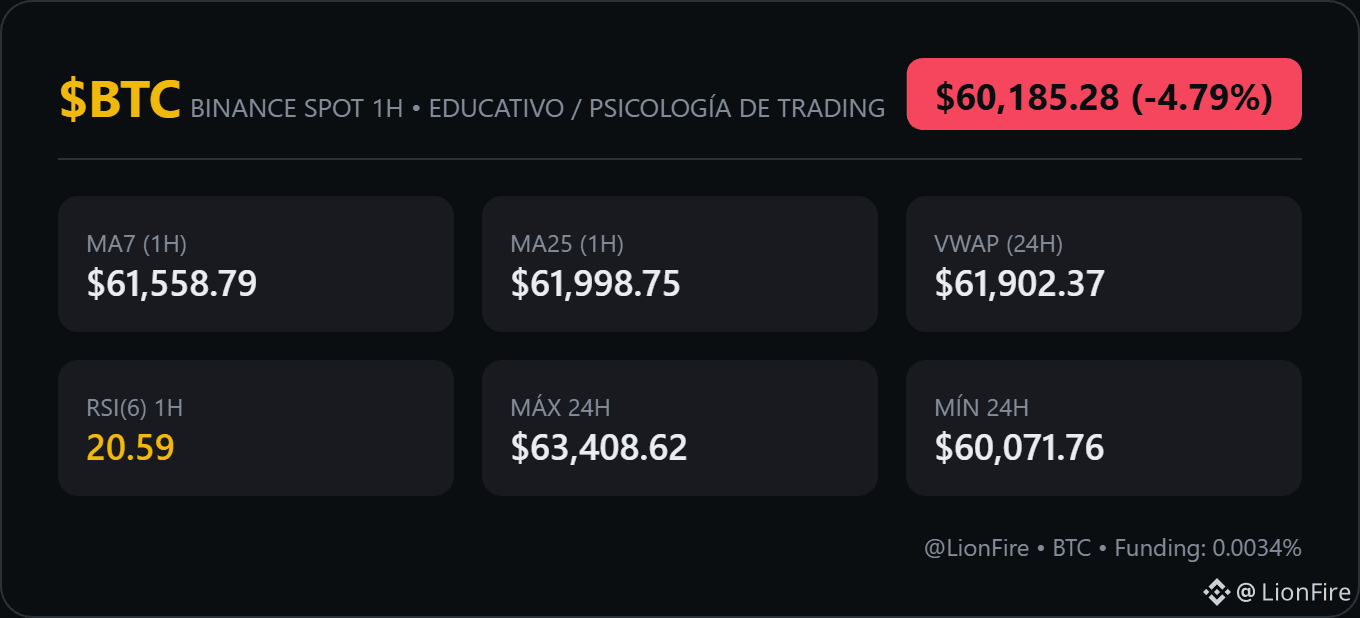
Bitcoin ($BTC) has been steadily declining after reaching a high of $63,408.62 in the past 24 hours, and is now at $60,185.28, putting immediate support at the 24-hour low ($60,071.76) under pressure. This decline reflects psychological tension among traders who, following Anthropic's initial public offering, see a potential technical test for the market.
📊 1. 1H technical breakdown:
🟢 Price compressed: The price is below the MA7 ($61,558.79) and the MA25 ($61,998.75), suggesting downward pressure beyond the usual movement.
🛡️ RSI in technical oversold territory: The 1H RSI(6) is at 20.59, marking a classic oversold zone, which could be a turning point if the price finds solid support.
⚖️ VWAP as a key reference: The 24h VWAP ($61,902.37) serves as an important reference for traders looking for entry points within the market structure.
⚠️ 2. The psychological fear behind the decline:
Bitcoin's decline is not just a technical correction, but a sign of emotional tension in the market. Traders are nervous, and volatility is rising, which could lead to impulsive liquidations if the price breaks 24-hour support.
🔥And the question remains: will it keep falling to the average price, or will it stop and trade sideways around 56K?
💡 The key to making the most of this moment isn't chasing the declines, but recognizing them as opportunities with a clear structure. Be patient and avoid catching falling knives.
#CryptoTradingInsights #BTC #marketanalysis
🔴 BITCOIN FALLS TO $60,185: Psychological fear or technical test? ⚠️
Bitcoin ($BTC) has been steadily declining after reaching a high of $63,408.62 in the past 24 hours, and is now at $60,185.28, putting immediate support at the 24-hour low ($60,071.76) under pressure. This decline reflects psychological tension among traders who, following Anthropic's initial public offering, see a potential technical test for the market.
📊 1. 1H technical breakdown:
🟢 Price compressed: The price is below the MA7 ($61,558.79) and the MA25 ($61,998.75), suggesting downward pressure beyond the usual movement.
🛡️ RSI in technical oversold territory: The 1H RSI(6) is at 20.59, marking a classic oversold zone, which could be a turning point if the price finds solid support.
⚖️ VWAP as a key reference: The 24h VWAP ($61,902.37) serves as an important reference for traders looking for entry points within the market structure.
⚠️ 2. The psychological fear behind the decline:
Bitcoin's decline is not just a technical correction, but a sign of emotional tension in the market. Traders are nervous, and volatility is rising, which could lead to impulsive liquidations if the price breaks 24-hour support.
🔥And the question remains: will it keep falling to the average price, or will it stop and trade sideways around 56K?
💡 The key to making the most of this moment isn't chasing the declines, but recognizing them as opportunities with a clear structure. Be patient and avoid catching falling knives.
🔴 BITCOIN FALLS TO $60,185: Psychological fear or technical test? ⚠️
Bitcoin ($BTC) has been steadily declining after reaching a high of $63,408.62 in the past 24 hours, and is now at $60,185.28, putting immediate support at the 24-hour low ($60,071.76) under pressure. This decline reflects psychological tension among traders who, following Anthropic's initial public offering, see a potential technical test for the market.
📊 1. 1H technical breakdown:
🟢 Price compressed: The price is below the MA7 ($61,558.79) and the MA25 ($61,998.75), suggesting downward pressure beyond the usual movement.
🛡️ RSI in technical oversold territory: The 1H RSI(6) is at 20.59, marking a classic oversold zone, which could be a turning point if the price finds solid support.
⚖️ VWAP as a key reference: The 24h VWAP ($61,902.37) serves as an important reference for traders looking for entry points within the market structure.
⚠️ 2. The psychological fear behind the decline:
Bitcoin's decline is not just a technical correction, but a sign of emotional tension in the market. Traders are nervous, and volatility is rising, which could lead to impulsive liquidations if the price breaks 24-hour support.
🔥And the question remains: will it keep falling to the average price, or will it stop and trade sideways around 56K?
💡 The key to making the most of this moment isn't chasing the declines, but recognizing them as opportunities with a clear structure. Be patient and avoid catching falling knives.
1
76

·
--
Market Tests Seven-Day Lows: A Full Analysis of ETF Outflows, Leverage Flushes, and Sector RotationThe broader crypto market remains under pressure today, with the three major assets all testing levels near their seven-day lows. As of now, $BTC is at $61,434.21 (24-hour change: -3.15%, trading volume: $1.364 billion), after hitting an intraday low of $61,290.58; $ETH is at $1,719.93 (24-hour change: -4.36%, trading volume: $596 million), nearing its seven-day low of $1,711.08; $BNB is at $567.27 (24-hour change: -3.22%, trading volume: $67.57 million), also hovering just above its seven-day low of $566.00.
I. Key Catalysts: ETF Outflows and Macro-Driven Flight to Safety
Since November, cumulative net outflows from U.S. spot Bitcoin ETFs have exceeded $2.1 billion (with outflows of more than $1.9 billion over seven consecutive trading days at one point). Spot Ethereum ETFs also recorded nearly $400 million in redemptions in a single week. Combined with a stronger U.S. dollar and uncertainty around Federal Reserve rate expectations, the Fear and Greed Index has fallen to the extreme fear range of 10–12, while institutional risk appetite has contracted noticeably.
Market Tests Seven-Day Lows: A Full Analysis of ETF Outflows, Leverage Flushes, and Sector Rotation
The broader crypto market remains under pressure today, with the three major assets all testing levels near their seven-day lows. As of now, $BTC is at $61,434.21 (24-hour change: -3.15%, trading volume: $1.364 billion), after hitting an intraday low of $61,290.58; $ETH is at $1,719.93 (24-hour change: -4.36%, trading volume: $596 million), nearing its seven-day low of $1,711.08; $BNB is at $567.27 (24-hour change: -3.22%, trading volume: $67.57 million), also hovering just above its seven-day low of $566.00.
I. Key Catalysts: ETF Outflows and Macro-Driven Flight to Safety
Since November, cumulative net outflows from U.S. spot Bitcoin ETFs have exceeded $2.1 billion (with outflows of more than $1.9 billion over seven consecutive trading days at one point). Spot Ethereum ETFs also recorded nearly $400 million in redemptions in a single week. Combined with a stronger U.S. dollar and uncertainty around Federal Reserve rate expectations, the Fear and Greed Index has fallen to the extreme fear range of 10–12, while institutional risk appetite has contracted noticeably.
I. Key Catalysts: ETF Outflows and Macro-Driven Flight to Safety
Since November, cumulative net outflows from U.S. spot Bitcoin ETFs have exceeded $2.1 billion (with outflows of more than $1.9 billion over seven consecutive trading days at one point). Spot Ethereum ETFs also recorded nearly $400 million in redemptions in a single week. Combined with a stronger U.S. dollar and uncertainty around Federal Reserve rate expectations, the Fear and Greed Index has fallen to the extreme fear range of 10–12, while institutional risk appetite has contracted noticeably.
1
634
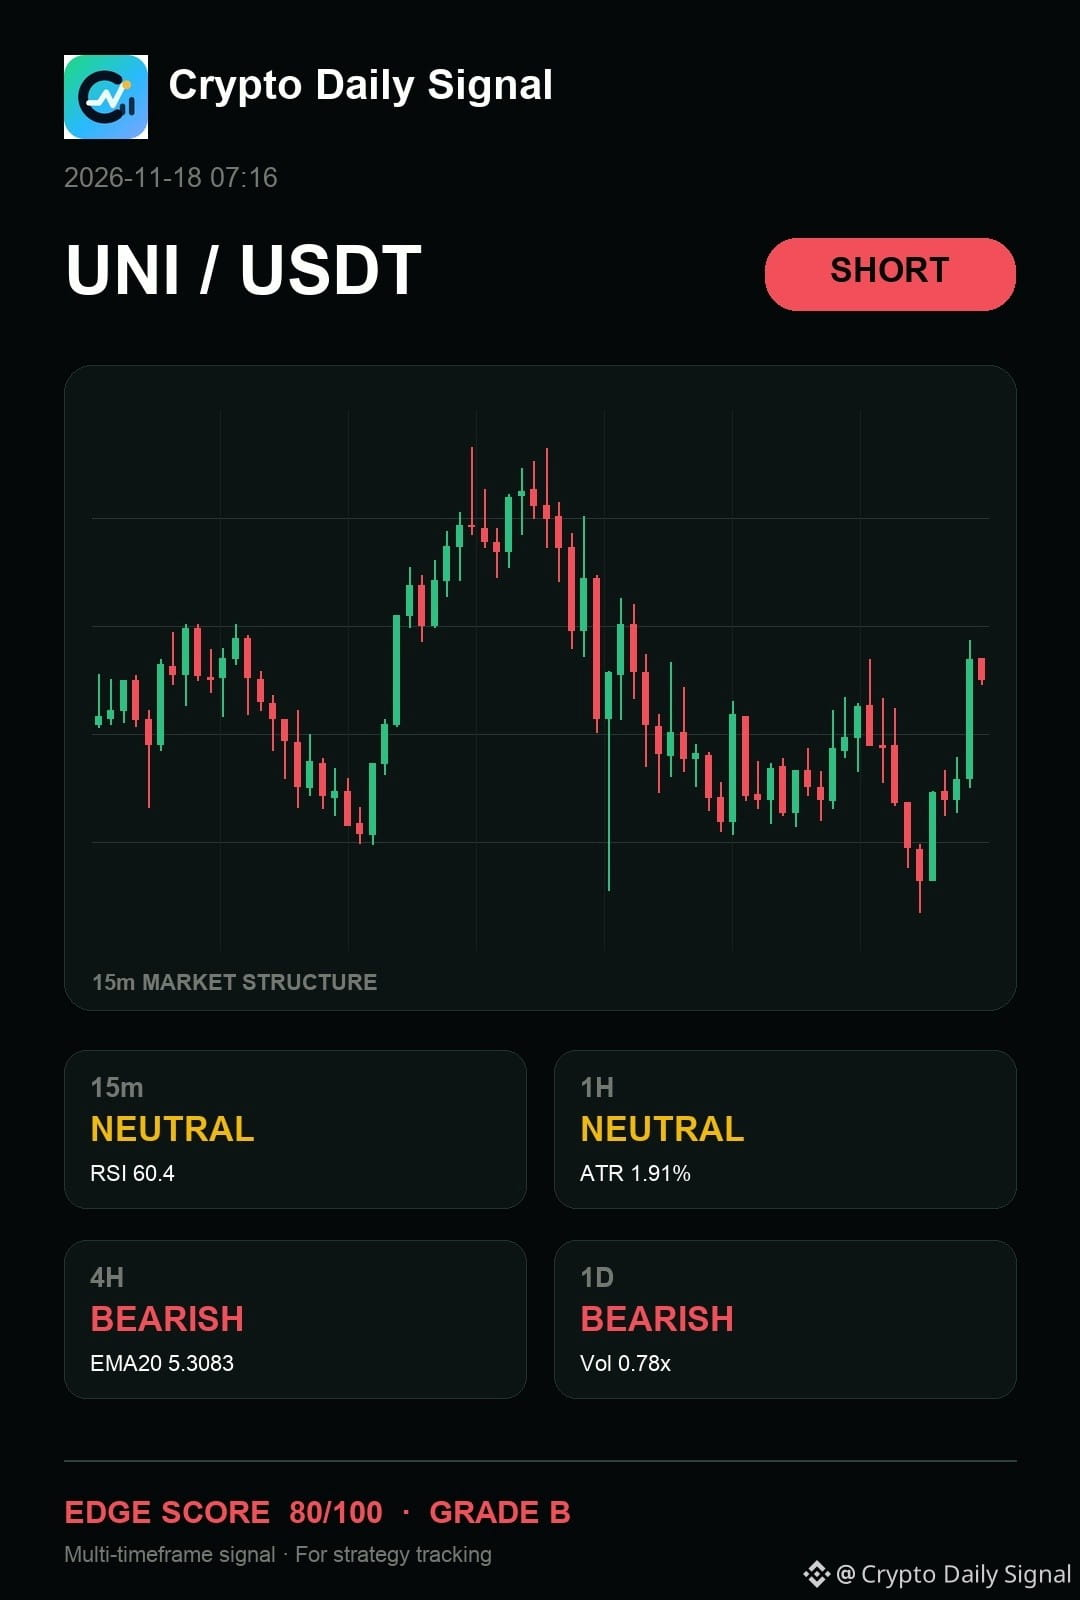
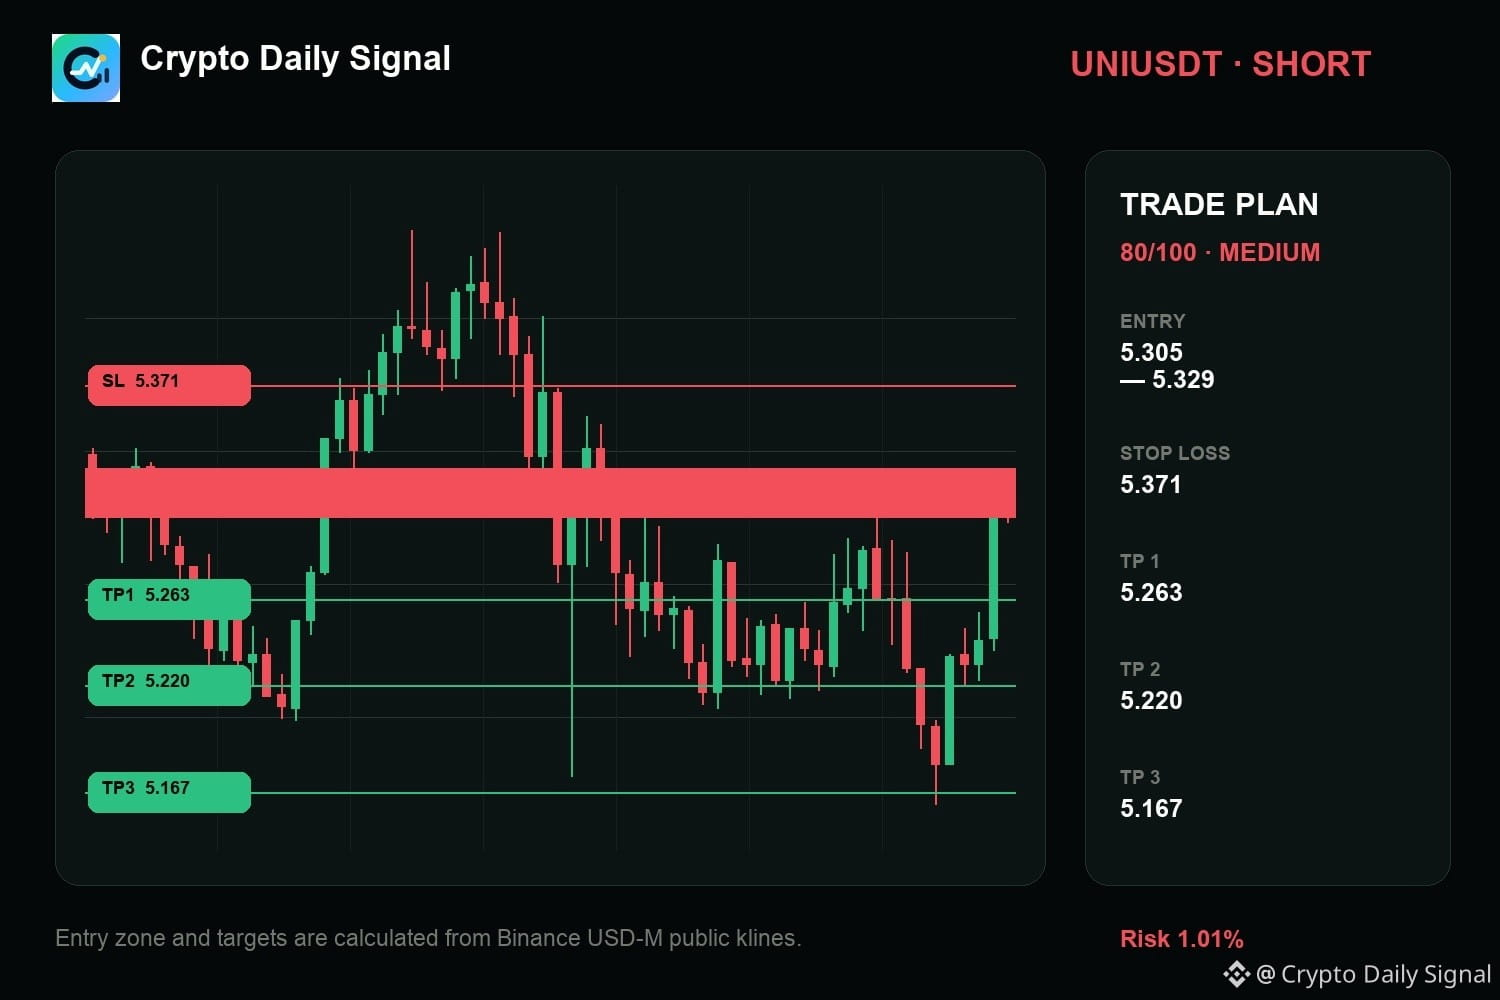
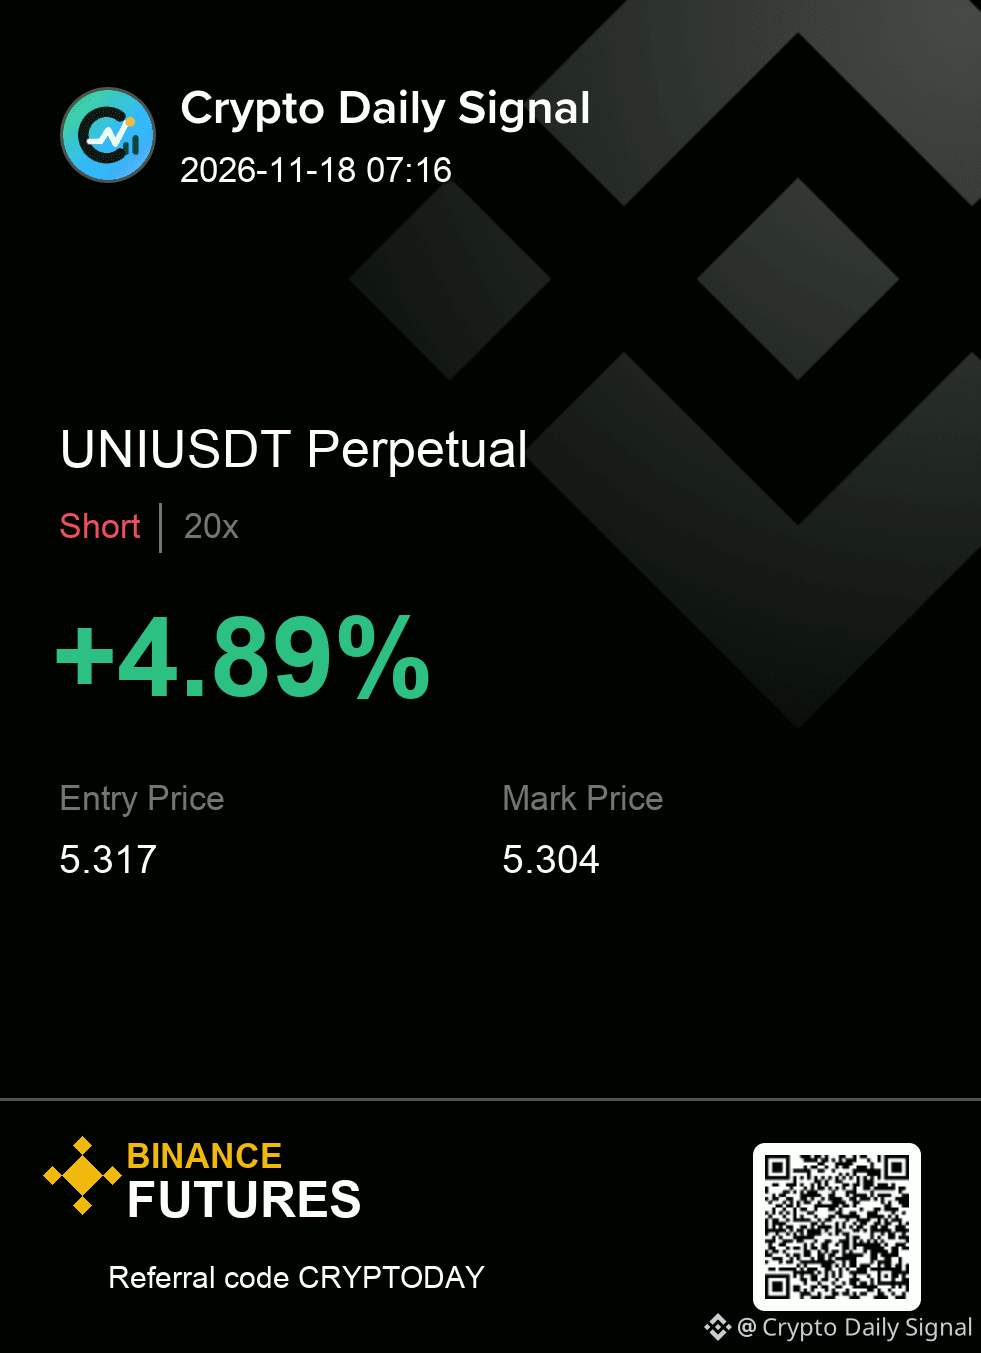
$UNI — the way I see this move, it stays on my short list for now. The higher-timeframe picture reads bearish, and the four-hour leg remains bearish. Let price prove the zone rather than chasing momentum; if the risk boundary fails, I move on without arguing with it.
Execution is simple here: respect the zone and respect the cut.
UNIUSDT SHORT map
Entry → 5.305 - 5.329
SL → 5.371
TP → 5.263 · 5.220 · 5.167
#MarketAnalysis
{future}(UNIUSDT)
$UNI — the way I see this move, it stays on my short list for now. The higher-timeframe picture reads bearish, and the four-hour leg remains bearish. Let price prove the zone rather than chasing momentum; if the risk boundary fails, I move on without arguing with it.
Execution is simple here: respect the zone and respect the cut.
UNIUSDT SHORT map
Entry → 5.305 - 5.329
SL → 5.371
TP → 5.263 · 5.220 · 5.167
#MarketAnalysis
Execution is simple here: respect the zone and respect the cut.
UNIUSDT SHORT map
Entry → 5.305 - 5.329
SL → 5.371
TP → 5.263 · 5.220 · 5.167
#MarketAnalysis
6
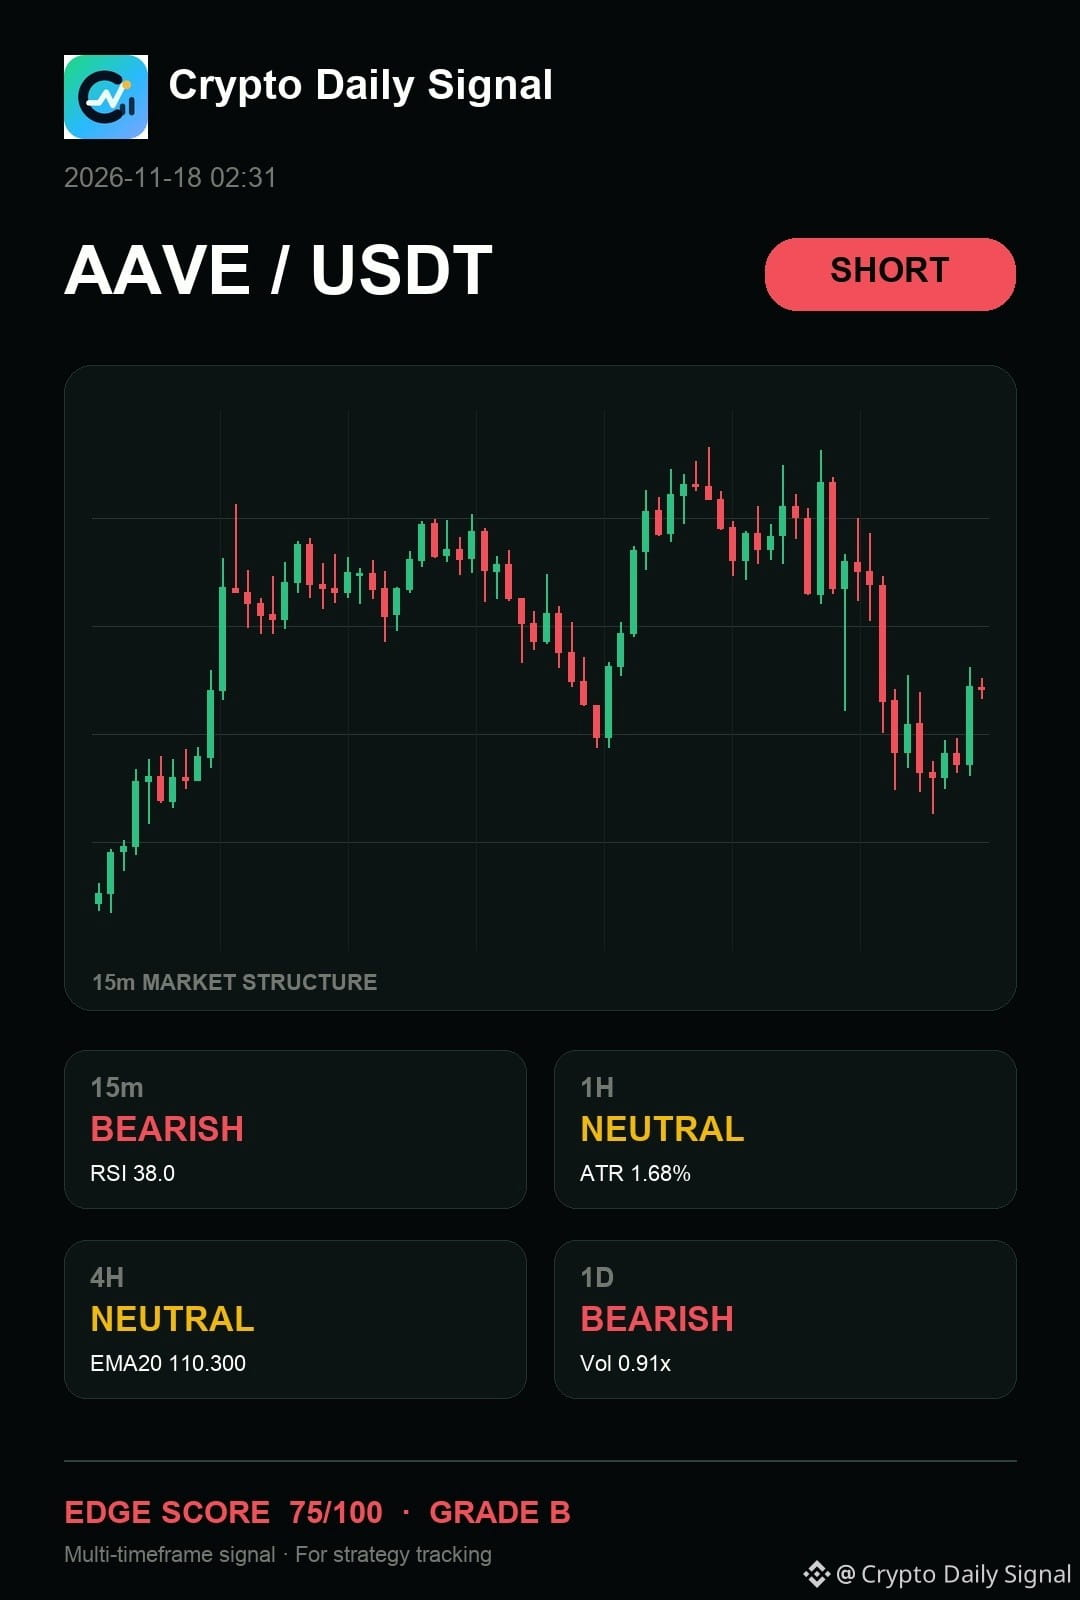
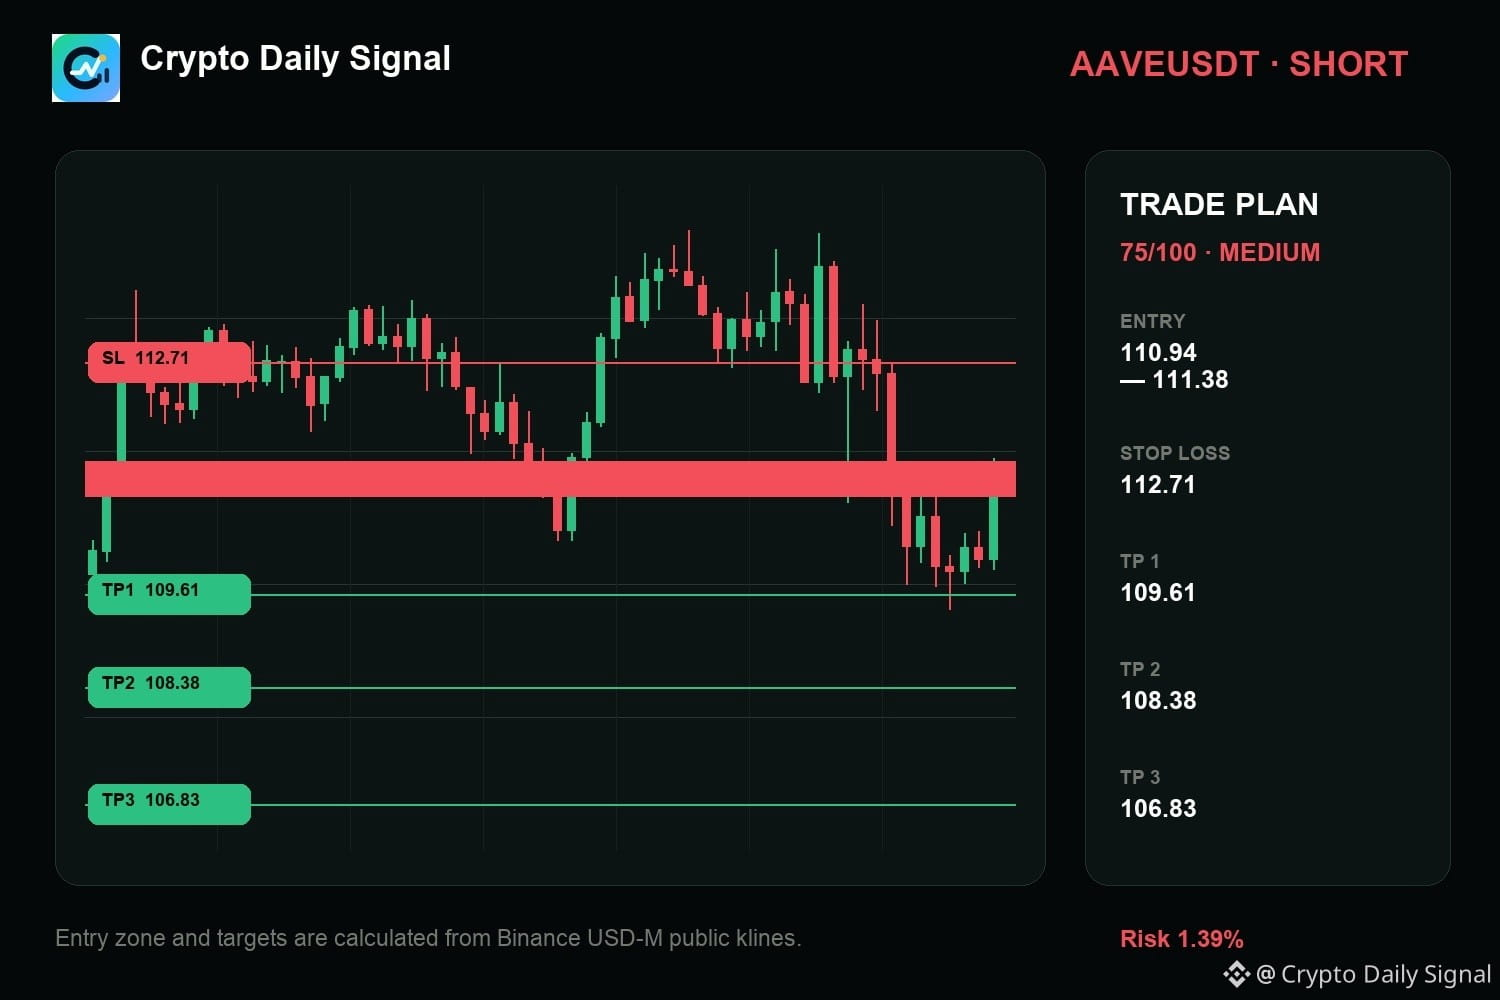
$AAVE — my two cents, I am reading it like it keeps me focused on the downside response as the price tests the top of its recent trading area. We're seeing clear rejection on the hourly chart near that range boundary. The daily trend is bearish, and until we see a convincing break above that high, this pullback narrative holds water.
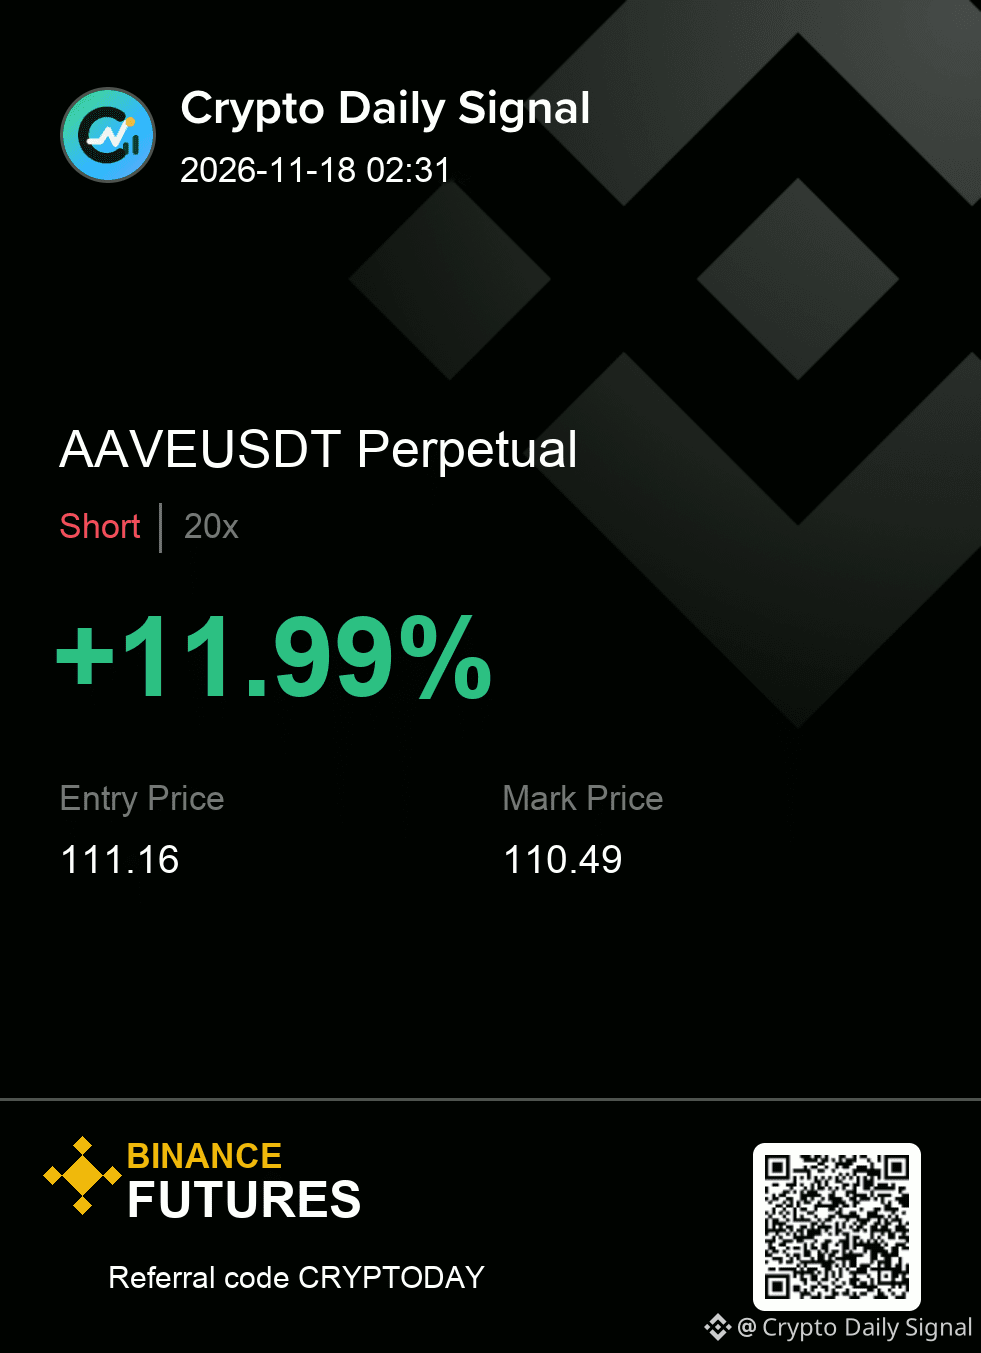
AAVEUSDT SHORT
IN 110.94 - 111.38
OUT 112.71
TP 109.61 · 108.38 · 106.83
#MarketAnalysis
{future}(AAVEUSDT)
$AAVE — my two cents, I am reading it like it keeps me focused on the downside response as the price tests the top of its recent trading area. We're seeing clear rejection on the hourly chart near that range boundary. The daily trend is bearish, and until we see a convincing break above that high, this pullback narrative holds water.
AAVEUSDT SHORT
IN 110.94 - 111.38
OUT 112.71
TP 109.61 · 108.38 · 106.83
#MarketAnalysis
AAVEUSDT SHORT
IN 110.94 - 111.38
OUT 112.71
TP 109.61 · 108.38 · 106.83
#MarketAnalysis
16
Log in to explore more content
Join global crypto users on Binance Square
⚡️ Get latest and useful information about crypto.
💬 Trusted by the world’s largest crypto exchange.
👍 Discover real insights from verified creators.
Email / Phone number
Trending Topics
1
#CanBTCReboundAfterFallingBelow60K?
365,279 views
1,521 Discussing
2
#GlobalStocksFaceLongestLosingStreakSince2023
119,016 views
1,079 Discussing
3
#BlackRockIBITPostsRecord$541MSingleDayOutflow
613 views
16 Discussing
4
#AnthropicPlungesTowardIPOPriceonDay2
57,449 views
581 Discussing
5
#TwentyOneCapitalAdds172.25BTC
10,155 views
157 Discussing
6
#HKBillWouldExcludeTokenizedDepositsFromVirtualAssets
861 views
14 Discussing
7
#BNBDropsBelow540USDTWith8.46%DailyDecline
30,925 views
263 Discussing
8
#HKBillProposesHK$100KFineForUnauthorizedCryptoTitles
1,009 views
14 Discussing
9
#BitMineFaces$10.1BUnrealizedETHLoss
1,967 views
18 Discussing
10
#StrategyReports$35BNetReserves
1,834 views
18 Discussing