
#tradingcharts
tradingcharts
7,914 views
27 Discussing
Hot
Latest

·
--
📊 $BTC RSI: IS MOMENTUM CHANGING?
The Relative Strength Index can help traders assess $BTC momentum. 📈
An elevated RSI may indicate strong buying pressure or overextended conditions. A low RSI can signal weakness, but neither reading guarantees a reversal.
Combine RSI with support, resistance, and volume.
💬 Do you use RSI in your trading?
#BTC #RSI #TechnicalIndicators #TradingCharts #CryptoLearning
📊 $BTC RSI: IS MOMENTUM CHANGING?
The Relative Strength Index can help traders assess $BTC momentum. 📈
An elevated RSI may indicate strong buying pressure or overextended conditions. A low RSI can signal weakness, but neither reading guarantees a reversal.
Combine RSI with support, resistance, and volume.
💬 Do you use RSI in your trading?
#BTC #RSI #TechnicalIndicators #TradingCharts #CryptoLearning
The Relative Strength Index can help traders assess $BTC momentum. 📈
An elevated RSI may indicate strong buying pressure or overextended conditions. A low RSI can signal weakness, but neither reading guarantees a reversal.
Combine RSI with support, resistance, and volume.
💬 Do you use RSI in your trading?
#BTC #RSI #TechnicalIndicators #TradingCharts #CryptoLearning
1
1
·
--
📅 $BTC TRADERS, WATCH THE WEEKLY CHART!
Daily candles can create plenty of noise, but weekly charts help reveal broader trends.
Look at major support zones, resistance levels, and long-term momentum.
Sometimes zooming out gives you a much clearer perspective!
{spot}(BTCUSDT)
#BTC #WeeklyChart #CryptoTechnicalAnalysis #TradingCharts #MarketTrends
📅 $BTC TRADERS, WATCH THE WEEKLY CHART!
Daily candles can create plenty of noise, but weekly charts help reveal broader trends.
Look at major support zones, resistance levels, and long-term momentum.
Sometimes zooming out gives you a much clearer perspective!
#BTC #WeeklyChart #CryptoTechnicalAnalysis #TradingCharts #MarketTrends
Daily candles can create plenty of noise, but weekly charts help reveal broader trends.
Look at major support zones, resistance levels, and long-term momentum.
Sometimes zooming out gives you a much clearer perspective!
#BTC #WeeklyChart #CryptoTechnicalAnalysis #TradingCharts #MarketTrends
1
2

·
--
Bullish
☀️ Morning market overview | 14.09
We start the new week with a positive move in BTC and ETH. Important days are ahead, so this week we’ll be especially attentive to key levels and news.
🟠 BTC — $77 764
After liquidity was removed around the $76 400 area, Bitcoin was quickly bought back, and the price returned to local highs. The nearest resistance is $77 850–78 000. A breakout above will give a chance for the continuation of the move; support is $77 300–77 500.
🔵 ETH — $2 521
Ethereum has moved back above $2,500 and locally looks quite good. The nearest resistance zone is $2 540–2 566, and the main high remains at $2 666. As long as we hold $2,500, the advantage remains on the buyers’ side.
📊 Conclusion: the week starts on an interesting note—the market is coming back to life, but the key supports are still ahead. And most importantly: on September 15–16, there will be an FOMC meeting, so closer to the Fed decision, volatility may rise significantly.
#CryptoNews #BTC #tradingcharts
☀️ Morning market overview | 14.09
We start the new week with a positive move in BTC and ETH. Important days are ahead, so this week we’ll be especially attentive to key levels and news.
🟠 BTC — $77 764
After liquidity was removed around the $76 400 area, Bitcoin was quickly bought back, and the price returned to local highs. The nearest resistance is $77 850–78 000. A breakout above will give a chance for the continuation of the move; support is $77 300–77 500.
🔵 ETH — $2 521
Ethereum has moved back above $2,500 and locally looks quite good. The nearest resistance zone is $2 540–2 566, and the main high remains at $2 666. As long as we hold $2,500, the advantage remains on the buyers’ side.
📊 Conclusion: the week starts on an interesting note—the market is coming back to life, but the key supports are still ahead. And most importantly: on September 15–16, there will be an FOMC meeting, so closer to the Fed decision, volatility may rise significantly.
#CryptoNews #BTC #tradingcharts
We start the new week with a positive move in BTC and ETH. Important days are ahead, so this week we’ll be especially attentive to key levels and news.
🟠 BTC — $77 764
After liquidity was removed around the $76 400 area, Bitcoin was quickly bought back, and the price returned to local highs. The nearest resistance is $77 850–78 000. A breakout above will give a chance for the continuation of the move; support is $77 300–77 500.
🔵 ETH — $2 521
Ethereum has moved back above $2,500 and locally looks quite good. The nearest resistance zone is $2 540–2 566, and the main high remains at $2 666. As long as we hold $2,500, the advantage remains on the buyers’ side.
📊 Conclusion: the week starts on an interesting note—the market is coming back to life, but the key supports are still ahead. And most importantly: on September 15–16, there will be an FOMC meeting, so closer to the Fed decision, volatility may rise significantly.
#CryptoNews #BTC #tradingcharts

1
2
985

·
--
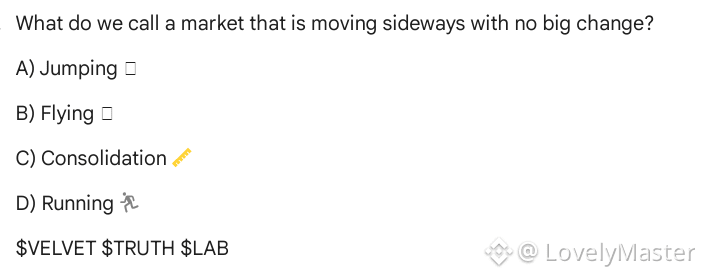
What do we call a market that is moving sideways with no big change?
A) Jumping 🦘
B) Flying 🕊️
C) Consolidation 📏
D) Running 🏃
$VELVET
{future}(VELVETUSDT)
$TRUTH
{future}(TRUTHUSDT)
$LAB
{future}(LABUSDT)
#MarketTrends #consolidation #SidewaysMarket #tradingcharts #TechnicalAnalysis
What do we call a market that is moving sideways with no big change?
A) Jumping 🦘
B) Flying 🕊️
C) Consolidation 📏
D) Running 🏃
$VELVET
$TRUTH
$LAB
#MarketTrends #consolidation #SidewaysMarket #tradingcharts #TechnicalAnalysis
A) Jumping 🦘
B) Flying 🕊️
C) Consolidation 📏
D) Running 🏃
$VELVET
$TRUTH
$LAB
#MarketTrends #consolidation #SidewaysMarket #tradingcharts #TechnicalAnalysis
1
462
Log in to explore more content
Join global crypto users on Binance Square
⚡️ Get latest and useful information about crypto.
💬 Trusted by the world’s largest crypto exchange.
👍 Discover real insights from verified creators.
Email / Phone number
Trending Topics
1
#BTCReboundsAbove$60KAmidWhaleDipBuying
87,462 views
401 Discussing
2
#SolanaSets2027RoadmapToDoubleComputeCapacity
72,115 views
1,154 Discussing
3
#CaliforniaNvidiaProbeExaminesPotentialCriminalViolations
19,625 views
166 Discussing
4
#BlackRockLaunchesHKDollarDigitalLiquidityFund
60,494 views
852 Discussing
5
#NvidiaLoses$2.7TrillionInMonthAndAHalf
82,199 views
338 Discussing
6
#GlobalStocksFaceLongestLosingStreakSince2023
590,969 views
3,578 Discussing
7
#BlackRockIBITPostsRecord$541MSingleDayOutflow
100,178 views
186 Discussing
8
#AnthropicPlungesTowardIPOPriceonDay2
329,451 views
2,403 Discussing
9
#TwentyOneCapitalAdds172.25BTC
178,604 views
1,709 Discussing
10
#HKBillWouldExcludeTokenizedDepositsFromVirtualAssets
19,138 views
109 Discussing