
#weeklychart
weeklychart
27,978 views
148 Discussing
Hot
Latest

·
--
🗺️ Two Bitcoin levels, two different questions
Ash Crypto’s Nov. 19 scenario put $57.8K on the downside watchlist and the 50-week moving average on the recovery watchlist.
Open $BTC on the weekly chart and mark both. Near $57.8K, check whether a move through the level holds into the weekly close. Near the moving average, watch whether price closes above it and then holds it on a retest.
Now pull up $ETH and $SOL ,What are their equivalent weekly levels, and are either of them getting there first?
Which would change your read of the market more: a defense of the low or a reclaim of the average?
#Bitcoin #WeeklyChart #CryptoMarkets
🗺️ Two Bitcoin levels, two different questions
Ash Crypto’s Nov. 19 scenario put $57.8K on the downside watchlist and the 50-week moving average on the recovery watchlist.
Open $BTC on the weekly chart and mark both. Near $57.8K, check whether a move through the level holds into the weekly close. Near the moving average, watch whether price closes above it and then holds it on a retest.
Now pull up $ETH and $SOL ,What are their equivalent weekly levels, and are either of them getting there first?
Which would change your read of the market more: a defense of the low or a reclaim of the average?
#Bitcoin #WeeklyChart #CryptoMarkets
Ash Crypto’s Nov. 19 scenario put $57.8K on the downside watchlist and the 50-week moving average on the recovery watchlist.
Open $BTC on the weekly chart and mark both. Near $57.8K, check whether a move through the level holds into the weekly close. Near the moving average, watch whether price closes above it and then holds it on a retest.
Now pull up $ETH and $SOL ,What are their equivalent weekly levels, and are either of them getting there first?
Which would change your read of the market more: a defense of the low or a reclaim of the average?
#Bitcoin #WeeklyChart #CryptoMarkets
1
80

·
--
🔥 $BTC WEEKLY CHART: THE BIGGER PICTURE MATTERS!
Short-term movements can distract traders from the broader trend. Weekly candles provide a wider perspective on market structure and major price zones. Combine higher timeframes with lower-timeframe entries for better context.
{spot}(BTCUSDT)
#BTC #WeeklyChart #TechnicalAnalysis #CryptoTrading
🔥 $BTC WEEKLY CHART: THE BIGGER PICTURE MATTERS!
Short-term movements can distract traders from the broader trend. Weekly candles provide a wider perspective on market structure and major price zones. Combine higher timeframes with lower-timeframe entries for better context.
#BTC #WeeklyChart #TechnicalAnalysis #CryptoTrading
Short-term movements can distract traders from the broader trend. Weekly candles provide a wider perspective on market structure and major price zones. Combine higher timeframes with lower-timeframe entries for better context.
#BTC #WeeklyChart #TechnicalAnalysis #CryptoTrading
1
5

73% of Bitcoin's major trend reversals over the last decade first printed as a weekly close below a key moving average, yet most people still only watch the 4-hour.
You know that sinking feeling when you buy a daily dip only for the weekly structure to confirm a breakdown and erase months of gains. That's how accounts get wrecked in 40%+ drawdowns nobody saw coming.
Looking at the current weekly chart, $BTC is coiling right around the 50-week moving average near $97k. A strong weekly close above $105k keeps the bullish path toward $135k alive, but even that setup usually delivers a 25-35% correction that shakes out anyone who got too comfortable. The real danger is treating every bounce like confirmation without waiting for the weekly to actually hold.
A weekly close under $89k is the one that should keep you up at night. Historically that kind of breakdown has opened the door to $65k-$70k, the same type of move that liquidated late $ETH and $BNB buyers in 2022. People forget how fast those weekly failures turn into full capitulation.
Then there's the grind, price stuck chopping between $85k and $110k for months. It looks harmless until you've overtraded yourself into a hole waiting for a breakout that never comes.
Which of these three weekly paths are you actually preparing for right now?
#Bitcoin #WeeklyChart #CryptoTrading
73% of Bitcoin's major trend reversals over the last decade first printed as a weekly close below a key moving average, yet most people still only watch the 4-hour.
You know that sinking feeling when you buy a daily dip only for the weekly structure to confirm a breakdown and erase months of gains. That's how accounts get wrecked in 40%+ drawdowns nobody saw coming.
Looking at the current weekly chart, $BTC is coiling right around the 50-week moving average near $97k. A strong weekly close above $105k keeps the bullish path toward $135k alive, but even that setup usually delivers a 25-35% correction that shakes out anyone who got too comfortable. The real danger is treating every bounce like confirmation without waiting for the weekly to actually hold.
A weekly close under $89k is the one that should keep you up at night. Historically that kind of breakdown has opened the door to $65k-$70k, the same type of move that liquidated late $ETH and $BNB buyers in 2022. People forget how fast those weekly failures turn into full capitulation.
Then there's the grind, price stuck chopping between $85k and $110k for months. It looks harmless until you've overtraded yourself into a hole waiting for a breakout that never comes.
Which of these three weekly paths are you actually preparing for right now?
#Bitcoin #WeeklyChart #CryptoTrading
You know that sinking feeling when you buy a daily dip only for the weekly structure to confirm a breakdown and erase months of gains. That's how accounts get wrecked in 40%+ drawdowns nobody saw coming.
Looking at the current weekly chart, $BTC is coiling right around the 50-week moving average near $97k. A strong weekly close above $105k keeps the bullish path toward $135k alive, but even that setup usually delivers a 25-35% correction that shakes out anyone who got too comfortable. The real danger is treating every bounce like confirmation without waiting for the weekly to actually hold.
A weekly close under $89k is the one that should keep you up at night. Historically that kind of breakdown has opened the door to $65k-$70k, the same type of move that liquidated late $ETH and $BNB buyers in 2022. People forget how fast those weekly failures turn into full capitulation.
Then there's the grind, price stuck chopping between $85k and $110k for months. It looks harmless until you've overtraded yourself into a hole waiting for a breakout that never comes.
Which of these three weekly paths are you actually preparing for right now?
#Bitcoin #WeeklyChart #CryptoTrading
29

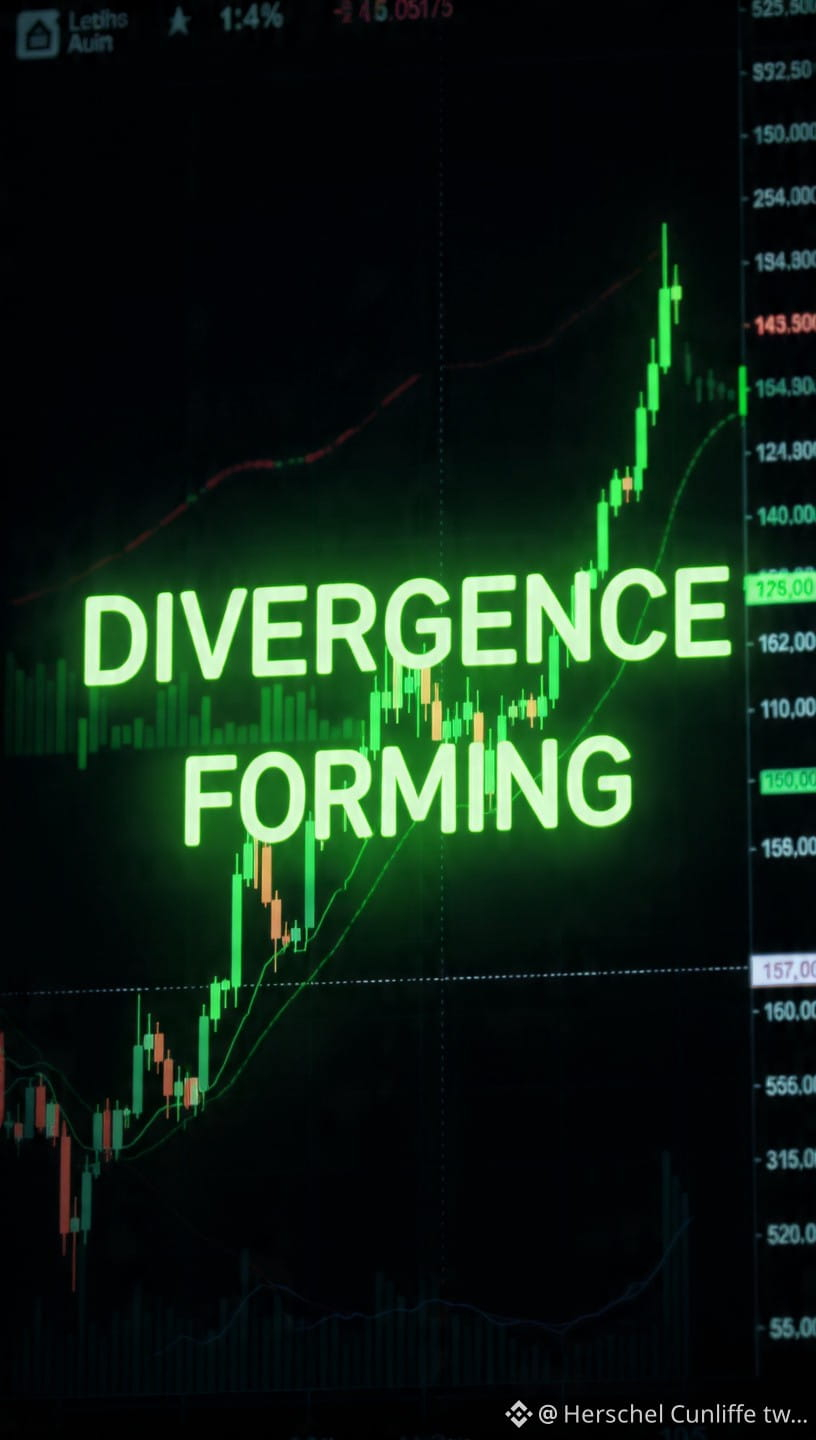
📊 $BTC — Weekly Bullish Divergence Forming. Not Confirmed Yet.
This is the signal every patient Bitcoin holder has been waiting to see.
But patience is still required. The weekly candle has not closed yet.
💡 What Is Happening Right Now
Bullish divergence is forming on the weekly timeframe — price making lower lows while momentum indicators show higher lows.
That disconnect between price and momentum is historically one of the strongest bottom signals in technical analysis.
🔍 The 2022 Parallel
Current structure is mirroring the 2022 bear market remarkably closely.
And anyone who remembers what happened after the 2022 divergence confirmed — knows exactly why this signal matters.
⏳ The Critical Window
2 days and a few hours remaining for the weekly candle to close.
Everything depends on that close. A confirmed weekly bullish divergence would be one of the strongest signals that this bear market is approaching its final bottom.
Not confirmed yet. Do not jump early.
📌 The Simple Rule$BTC
Wait for the weekly close. Let the signal confirm itself.
One more candle could change the entire market narrative. 👇
Patience here is not weakness — it is the actual edge. 🤝
#BTC #Bitcoin #BTCUSDT #CryptoTrading #BinanceSquare #CryptoAnalysis #Binance #BullishDivergence #MarketCycle #CryptoInvestor #Web3 #Blockchain #CryptoAlert #DYOR #CryptoMarket #TechnicalAnalysis #TradingStrategy #CryptoSignals #BearMarket #WeeklyChart $BTC
📊 $BTC — Weekly Bullish Divergence Forming. Not Confirmed Yet.
This is the signal every patient Bitcoin holder has been waiting to see.
But patience is still required. The weekly candle has not closed yet.
💡 What Is Happening Right Now
Bullish divergence is forming on the weekly timeframe — price making lower lows while momentum indicators show higher lows.
That disconnect between price and momentum is historically one of the strongest bottom signals in technical analysis.
🔍 The 2022 Parallel
Current structure is mirroring the 2022 bear market remarkably closely.
And anyone who remembers what happened after the 2022 divergence confirmed — knows exactly why this signal matters.
⏳ The Critical Window
2 days and a few hours remaining for the weekly candle to close.
Everything depends on that close. A confirmed weekly bullish divergence would be one of the strongest signals that this bear market is approaching its final bottom.
Not confirmed yet. Do not jump early.
📌 The Simple Rule$BTC
Wait for the weekly close. Let the signal confirm itself.
One more candle could change the entire market narrative. 👇
Patience here is not weakness — it is the actual edge. 🤝
#BTC #Bitcoin #BTCUSDT #CryptoTrading #BinanceSquare #CryptoAnalysis #Binance #BullishDivergence #MarketCycle #CryptoInvestor #Web3 #Blockchain #CryptoAlert #DYOR #CryptoMarket #TechnicalAnalysis #TradingStrategy #CryptoSignals #BearMarket #WeeklyChart $BTC
This is the signal every patient Bitcoin holder has been waiting to see.
But patience is still required. The weekly candle has not closed yet.
💡 What Is Happening Right Now
Bullish divergence is forming on the weekly timeframe — price making lower lows while momentum indicators show higher lows.
That disconnect between price and momentum is historically one of the strongest bottom signals in technical analysis.
🔍 The 2022 Parallel
Current structure is mirroring the 2022 bear market remarkably closely.
And anyone who remembers what happened after the 2022 divergence confirmed — knows exactly why this signal matters.
⏳ The Critical Window
2 days and a few hours remaining for the weekly candle to close.
Everything depends on that close. A confirmed weekly bullish divergence would be one of the strongest signals that this bear market is approaching its final bottom.
Not confirmed yet. Do not jump early.
📌 The Simple Rule$BTC
Wait for the weekly close. Let the signal confirm itself.
One more candle could change the entire market narrative. 👇
Patience here is not weakness — it is the actual edge. 🤝
#BTC #Bitcoin #BTCUSDT #CryptoTrading #BinanceSquare #CryptoAnalysis #Binance #BullishDivergence #MarketCycle #CryptoInvestor #Web3 #Blockchain #CryptoAlert #DYOR #CryptoMarket #TechnicalAnalysis #TradingStrategy #CryptoSignals #BearMarket #WeeklyChart $BTC
83

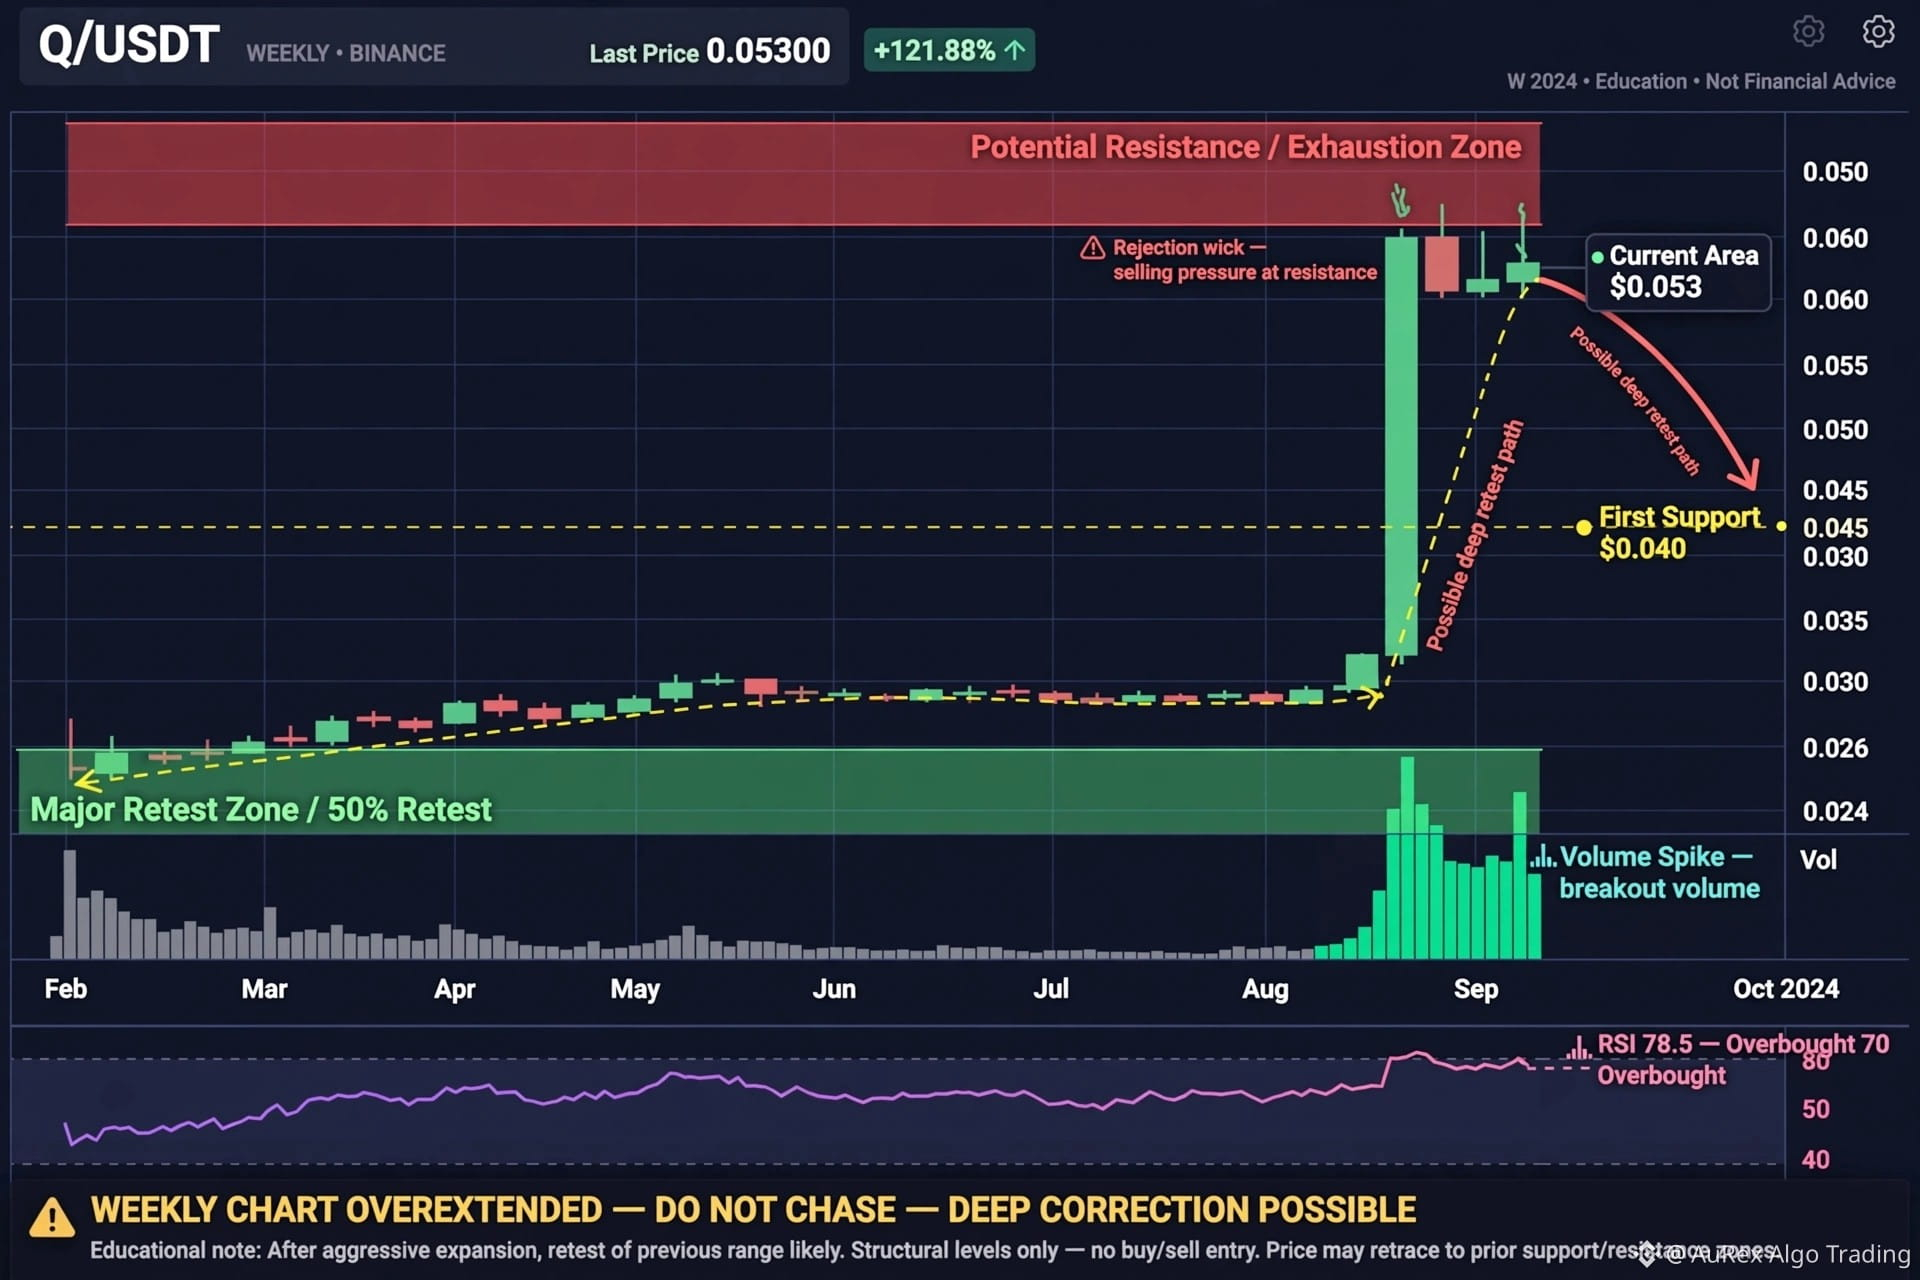
$Q WEEKLY CHART LOOKS OVEREXTENDED ... DEEP RETEST POSSIBLE*
$Q USDt has made a huge vertical move and is now trading around $0.053, well above its previous range.
After such an aggressive expansion, it’s better to wait for a major correction than to chase the pump.
Current Area: $0.053
Key Resistance: $0.055-0.060 (Exhaustion Zone)
First Support: $0.040
Major Retest Zone: $0.024-0.026
The arrow on the chart makes it clear—a deep retest from $0.053 to $0.040 and then to $0.024-0.026 is possible.
#Q #QUSDT #WeeklyChart #CryptoCorrection
$Q WEEKLY CHART LOOKS OVEREXTENDED ... DEEP RETEST POSSIBLE*
$Q USDt has made a huge vertical move and is now trading around $0.053, well above its previous range.
After such an aggressive expansion, it’s better to wait for a major correction than to chase the pump.
Current Area: $0.053
Key Resistance: $0.055-0.060 (Exhaustion Zone)
First Support: $0.040
Major Retest Zone: $0.024-0.026
The arrow on the chart makes it clear—a deep retest from $0.053 to $0.040 and then to $0.024-0.026 is possible.
#Q #QUSDT #WeeklyChart #CryptoCorrection
$Q USDt has made a huge vertical move and is now trading around $0.053, well above its previous range.
After such an aggressive expansion, it’s better to wait for a major correction than to chase the pump.
Current Area: $0.053
Key Resistance: $0.055-0.060 (Exhaustion Zone)
First Support: $0.040
Major Retest Zone: $0.024-0.026
The arrow on the chart makes it clear—a deep retest from $0.053 to $0.040 and then to $0.024-0.026 is possible.
#Q #QUSDT #WeeklyChart #CryptoCorrection
1
76

·
--
$BTC
{future}(BTCUSDT)
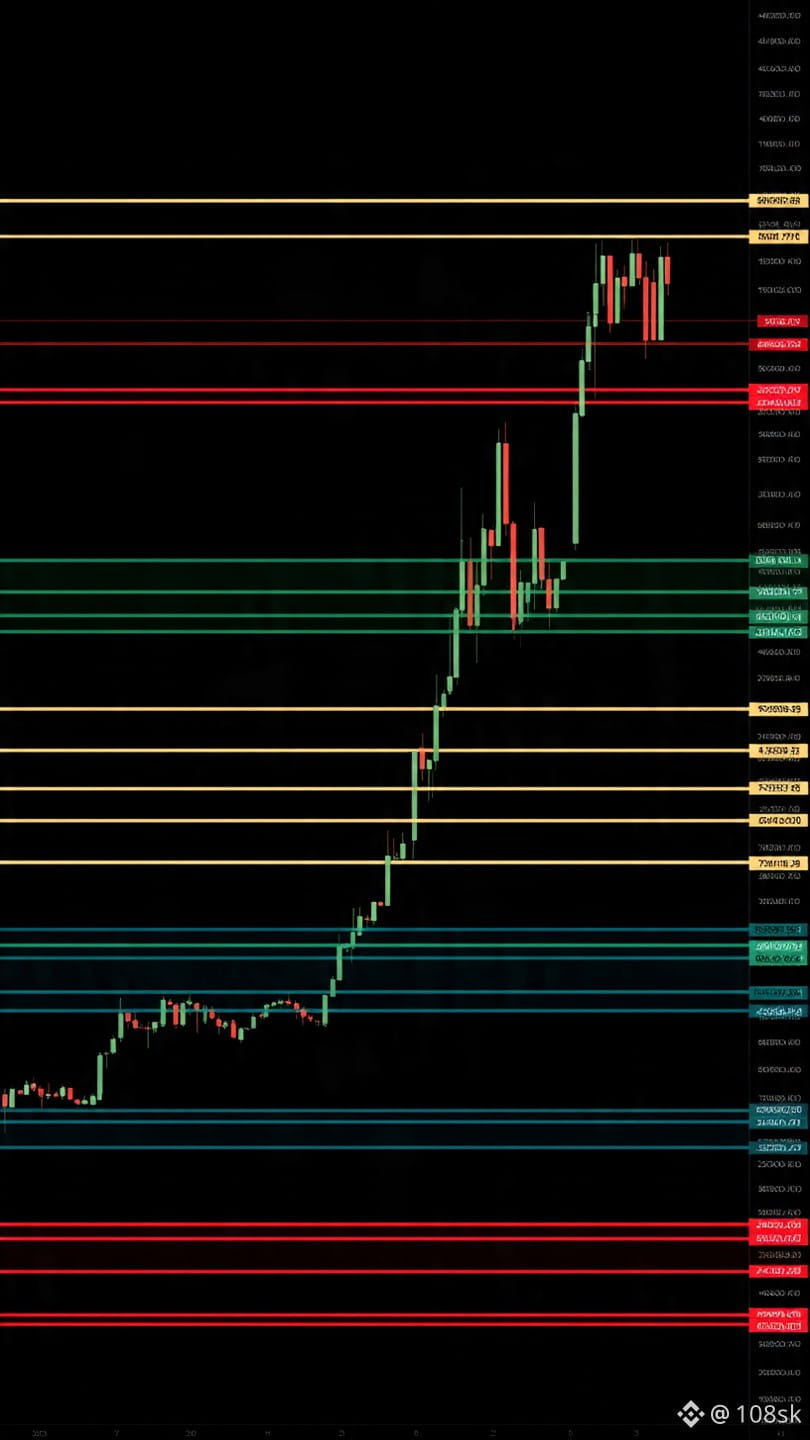
1W Chart Snapshot 📊
Current Level: 61K support zone active
Weekly timeframe: structure update
Chart Zones:
61K = current weekly support
56K = next major zone below
20K-21K = long term demand block
Mid-zone level = 40K area
1W candle abhi 61K pe decision point pe hai 📉
1W data kya bol raha? Tum chart pe kya level track kar rahe ho? 👇💬
#BTC #BinanceSquare #WeeklyChart #CryptoAnalysis
$BTC
1W Chart Snapshot 📊
Current Level: 61K support zone active
Weekly timeframe: structure update
Chart Zones:
61K = current weekly support
56K = next major zone below
20K-21K = long term demand block
Mid-zone level = 40K area
1W candle abhi 61K pe decision point pe hai 📉
1W data kya bol raha? Tum chart pe kya level track kar rahe ho? 👇💬
#BTC #BinanceSquare #WeeklyChart #CryptoAnalysis
1W Chart Snapshot 📊
Current Level: 61K support zone active
Weekly timeframe: structure update
Chart Zones:
61K = current weekly support
56K = next major zone below
20K-21K = long term demand block
Mid-zone level = 40K area
1W candle abhi 61K pe decision point pe hai 📉
1W data kya bol raha? Tum chart pe kya level track kar rahe ho? 👇💬
#BTC #BinanceSquare #WeeklyChart #CryptoAnalysis
41

·
--
PIVX has been in a brutal downtrend for months now. From its peak of $0.4270, the price has collapsed all the way down to $0.0347 — that's a massive decline, and the weekly chart tells the whole story.
📊 Technical Snapshot:
MA(7): 0.0529
MA(25): 0.0842
MA(99): 0.1624
Current Price: 0.0347
24h High/Low: 0.0353 / 0.0318
RSI(6): 14.95 ⚠️ (Extremely Oversold)
Price is trading well below all major moving averages, which confirms the dominant bearish structure. However, RSI sitting at just 14.95 is a serious warning — this level is historically extreme and a short-term relief bounce could happen at any point.
⚡ Bounce Watch Zone: $0.0318 — $0.0347
🎯 Short-term Resistance: $0.0529 (MA7)
🛑 Invalidation / Stop Loss: Close below $0.0290
⚠️ Important: Oversold does NOT mean reversal. Trading longs in a strong downtrend carries high risk. Keep position sizes small or stay on the sidelines until a proper structure shift is confirmed on lower timeframes.$PIVX
{spot}(PIVXUSDT)
#PIVX #PIVXUSDT #Binance #CryptoSignals #AltcoinWatch #WeeklyChart
PIVX has been in a brutal downtrend for months now. From its peak of $0.4270, the price has collapsed all the way down to $0.0347 — that's a massive decline, and the weekly chart tells the whole story.
📊 Technical Snapshot:
MA(7): 0.0529
MA(25): 0.0842
MA(99): 0.1624
Current Price: 0.0347
24h High/Low: 0.0353 / 0.0318
RSI(6): 14.95 ⚠️ (Extremely Oversold)
Price is trading well below all major moving averages, which confirms the dominant bearish structure. However, RSI sitting at just 14.95 is a serious warning — this level is historically extreme and a short-term relief bounce could happen at any point.
⚡ Bounce Watch Zone: $0.0318 — $0.0347
🎯 Short-term Resistance: $0.0529 (MA7)
🛑 Invalidation / Stop Loss: Close below $0.0290
⚠️ Important: Oversold does NOT mean reversal. Trading longs in a strong downtrend carries high risk. Keep position sizes small or stay on the sidelines until a proper structure shift is confirmed on lower timeframes.$PIVX
#PIVX #PIVXUSDT #Binance #CryptoSignals #AltcoinWatch #WeeklyChart
📊 Technical Snapshot:
MA(7): 0.0529
MA(25): 0.0842
MA(99): 0.1624
Current Price: 0.0347
24h High/Low: 0.0353 / 0.0318
RSI(6): 14.95 ⚠️ (Extremely Oversold)
Price is trading well below all major moving averages, which confirms the dominant bearish structure. However, RSI sitting at just 14.95 is a serious warning — this level is historically extreme and a short-term relief bounce could happen at any point.
⚡ Bounce Watch Zone: $0.0318 — $0.0347
🎯 Short-term Resistance: $0.0529 (MA7)
🛑 Invalidation / Stop Loss: Close below $0.0290
⚠️ Important: Oversold does NOT mean reversal. Trading longs in a strong downtrend carries high risk. Keep position sizes small or stay on the sidelines until a proper structure shift is confirmed on lower timeframes.$PIVX
#PIVX #PIVXUSDT #Binance #CryptoSignals #AltcoinWatch #WeeklyChart
2
537

$BTC DAILY RALLY LOOKS CLEAN, BUT WEEKLY MACD IS STILL BEARISH 🔥
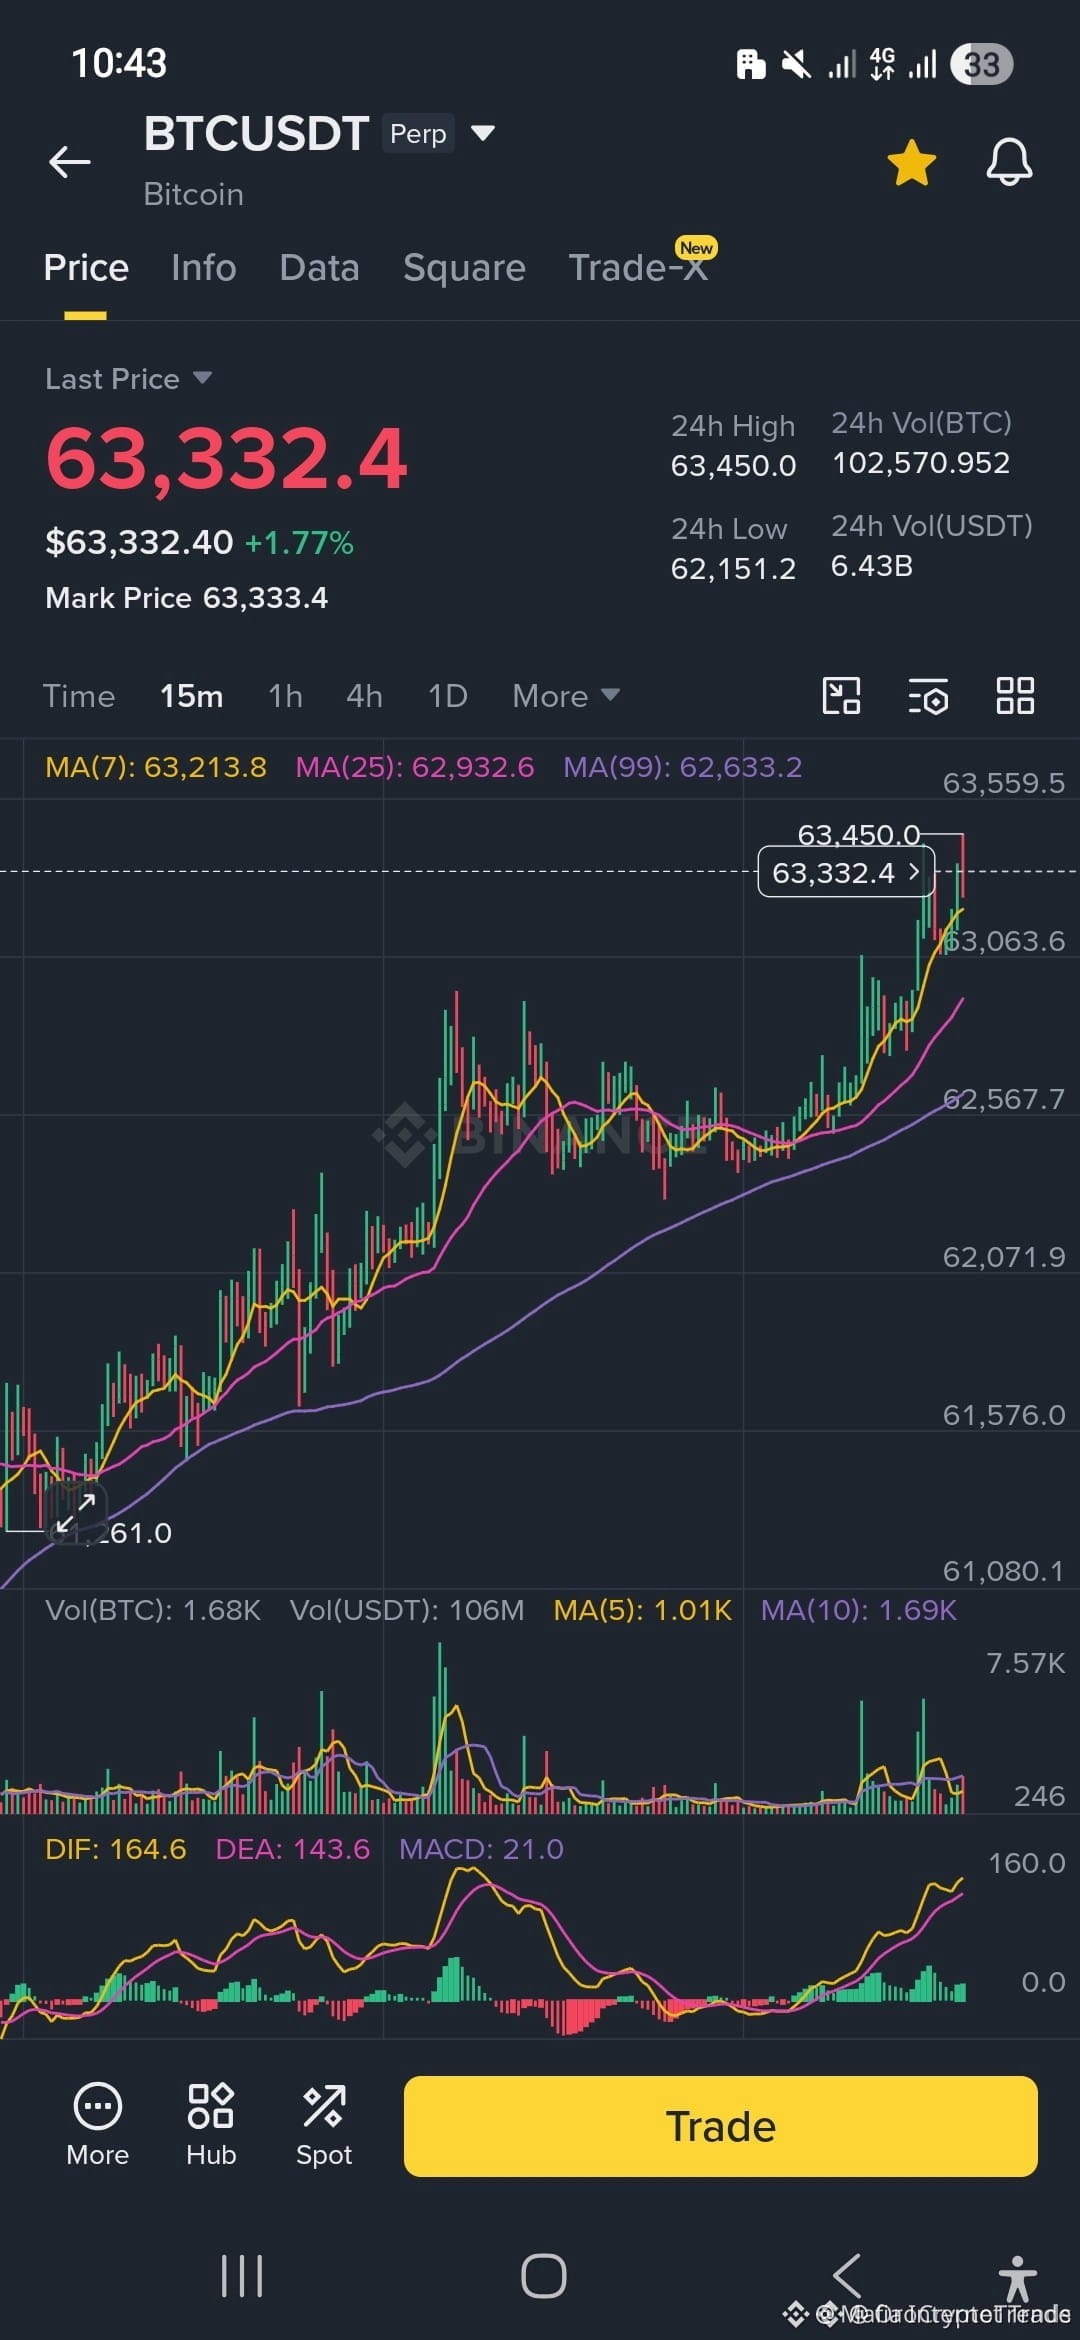
Price sitting at $63.3K with positive momentum on lower timeframes, short-term MAs aligned, and MACD green across daily and 4H. Feels good, I get it. But when I pulled up the weekly chart, the major moving averages are still above price and the weekly MACD remains negative. That’s a completely different story.
I’ve seen this movie before — local momentum without higher timeframe confirmation can flip hard. It doesn’t mean the rally is dead, but it means we’re not out of the woods yet. Are you buying the daily setup or waiting for the weekly to confirm?
Not financial advice. Always manage your risk.
#BTC #WeeklyChart #CryptoAnalysis #MACD
🔥
$BTC DAILY RALLY LOOKS CLEAN, BUT WEEKLY MACD IS STILL BEARISH 🔥
Price sitting at $63.3K with positive momentum on lower timeframes, short-term MAs aligned, and MACD green across daily and 4H. Feels good, I get it. But when I pulled up the weekly chart, the major moving averages are still above price and the weekly MACD remains negative. That’s a completely different story.
I’ve seen this movie before — local momentum without higher timeframe confirmation can flip hard. It doesn’t mean the rally is dead, but it means we’re not out of the woods yet. Are you buying the daily setup or waiting for the weekly to confirm?
Not financial advice. Always manage your risk.
#BTC #WeeklyChart #CryptoAnalysis #MACD
🔥
Price sitting at $63.3K with positive momentum on lower timeframes, short-term MAs aligned, and MACD green across daily and 4H. Feels good, I get it. But when I pulled up the weekly chart, the major moving averages are still above price and the weekly MACD remains negative. That’s a completely different story.
I’ve seen this movie before — local momentum without higher timeframe confirmation can flip hard. It doesn’t mean the rally is dead, but it means we’re not out of the woods yet. Are you buying the daily setup or waiting for the weekly to confirm?
Not financial advice. Always manage your risk.
#BTC #WeeklyChart #CryptoAnalysis #MACD
🔥
93

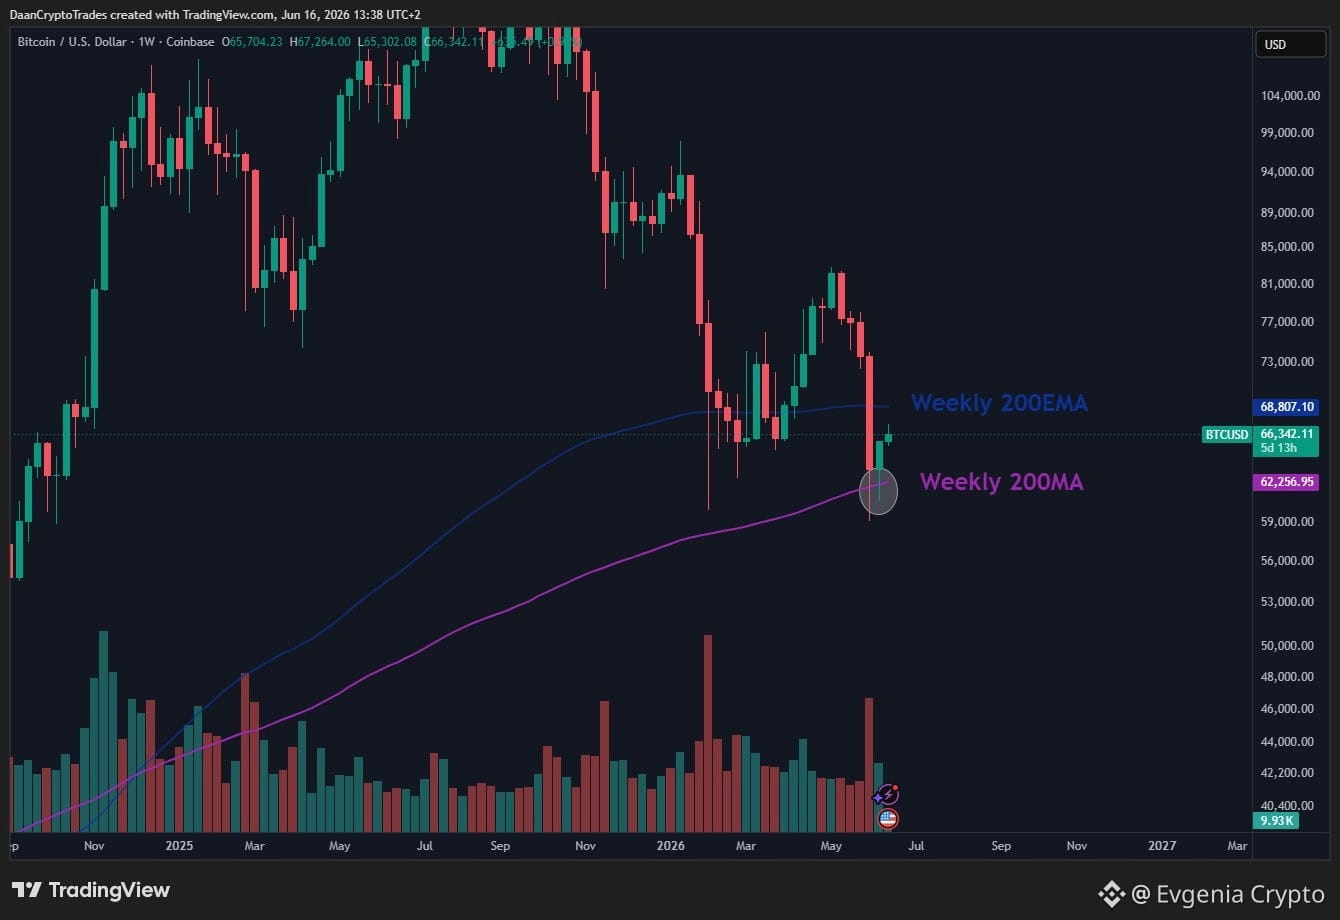
Bitcoin is consolidating between key metrics — the weekly 200MA and 200EMA.
The goal for buyers is to hold above the 200EMA, relying on the 200MA.
If this support gets broken down, the long-term trend will be shattered, and the priority will shift towards a deep dive.
Protect your capital and wait for confirmation from the market!
$BTC
{future}(BTCUSDT)
#BTC #CryptoAnalysis #WeeklyChart
Bitcoin is consolidating between key metrics — the weekly 200MA and 200EMA.
The goal for buyers is to hold above the 200EMA, relying on the 200MA.
If this support gets broken down, the long-term trend will be shattered, and the priority will shift towards a deep dive.
Protect your capital and wait for confirmation from the market!
$BTC
#BTC #CryptoAnalysis #WeeklyChart
The goal for buyers is to hold above the 200EMA, relying on the 200MA.
If this support gets broken down, the long-term trend will be shattered, and the priority will shift towards a deep dive.
Protect your capital and wait for confirmation from the market!
$BTC
#BTC #CryptoAnalysis #WeeklyChart
295

·
--
📊 THE $BTC DAILY CHART TELLS ONE STORY, THE WEEKLY CHART ANOTHER!
Short-term traders may focus on intraday momentum, while longer-term participants watch broader market structure.
Always match your analysis with your trading timeframe.
#BTC #DailyChart #WeeklyChart #TechnicalTrading #CryptoAnalysis
📊 THE $BTC DAILY CHART TELLS ONE STORY, THE WEEKLY CHART ANOTHER!
Short-term traders may focus on intraday momentum, while longer-term participants watch broader market structure.
Always match your analysis with your trading timeframe.
#BTC #DailyChart #WeeklyChart #TechnicalTrading #CryptoAnalysis
Short-term traders may focus on intraday momentum, while longer-term participants watch broader market structure.
Always match your analysis with your trading timeframe.
#BTC #DailyChart #WeeklyChart #TechnicalTrading #CryptoAnalysis
2
2
·
--
📅 $BTC TRADERS, WATCH THE WEEKLY CHART!
Daily candles can create plenty of noise, but weekly charts help reveal broader trends.
Look at major support zones, resistance levels, and long-term momentum.
Sometimes zooming out gives you a much clearer perspective!
{spot}(BTCUSDT)
#BTC #WeeklyChart #CryptoTechnicalAnalysis #TradingCharts #MarketTrends
📅 $BTC TRADERS, WATCH THE WEEKLY CHART!
Daily candles can create plenty of noise, but weekly charts help reveal broader trends.
Look at major support zones, resistance levels, and long-term momentum.
Sometimes zooming out gives you a much clearer perspective!
#BTC #WeeklyChart #CryptoTechnicalAnalysis #TradingCharts #MarketTrends
Daily candles can create plenty of noise, but weekly charts help reveal broader trends.
Look at major support zones, resistance levels, and long-term momentum.
Sometimes zooming out gives you a much clearer perspective!
#BTC #WeeklyChart #CryptoTechnicalAnalysis #TradingCharts #MarketTrends
1
2

$ETC BREAKS A 1-YEAR FALLING WEDGE ON THE WEEKLY CHART! 💥 📈
Target: 25 🚀
After an agonizing full year of compression, $ETC has finally shattered its weekly falling wedge pattern with undeniable authority. 📊 The coiled spring is unwinding fast as patient accumulation converts directly into aggressive buying momentum.
Multi-month consolidation structures of this caliber rarely offer second chances once expansion begins. 💡 Order flow is aggressively lifting asks, signaling that smart capital is positioning for a full-scale macro run toward the upper expansion target.
Sellers are running out of runway while market participants rush to catch this weekly breakout before velocity accelerates. 💬 Will you ride this weekly trend shift early or end up chasing the vertical impulse near the target zone? 👇
⚠️ Not financial advice. Always manage your risk. 🛡️
🏷️ #ETC #Breakout #WeeklyChart #Altcoins #Crypto
🔥 ⚡
$ETC BREAKS A 1-YEAR FALLING WEDGE ON THE WEEKLY CHART! 💥 📈
Target: 25 🚀
After an agonizing full year of compression, $ETC has finally shattered its weekly falling wedge pattern with undeniable authority. 📊 The coiled spring is unwinding fast as patient accumulation converts directly into aggressive buying momentum.
Multi-month consolidation structures of this caliber rarely offer second chances once expansion begins. 💡 Order flow is aggressively lifting asks, signaling that smart capital is positioning for a full-scale macro run toward the upper expansion target.
Sellers are running out of runway while market participants rush to catch this weekly breakout before velocity accelerates. 💬 Will you ride this weekly trend shift early or end up chasing the vertical impulse near the target zone? 👇
⚠️ Not financial advice. Always manage your risk. 🛡️
🏷️ #ETC #Breakout #WeeklyChart #Altcoins #Crypto
🔥 ⚡
Target: 25 🚀
After an agonizing full year of compression, $ETC has finally shattered its weekly falling wedge pattern with undeniable authority. 📊 The coiled spring is unwinding fast as patient accumulation converts directly into aggressive buying momentum.
Multi-month consolidation structures of this caliber rarely offer second chances once expansion begins. 💡 Order flow is aggressively lifting asks, signaling that smart capital is positioning for a full-scale macro run toward the upper expansion target.
Sellers are running out of runway while market participants rush to catch this weekly breakout before velocity accelerates. 💬 Will you ride this weekly trend shift early or end up chasing the vertical impulse near the target zone? 👇
⚠️ Not financial advice. Always manage your risk. 🛡️
🏷️ #ETC #Breakout #WeeklyChart #Altcoins #Crypto
🔥 ⚡
15

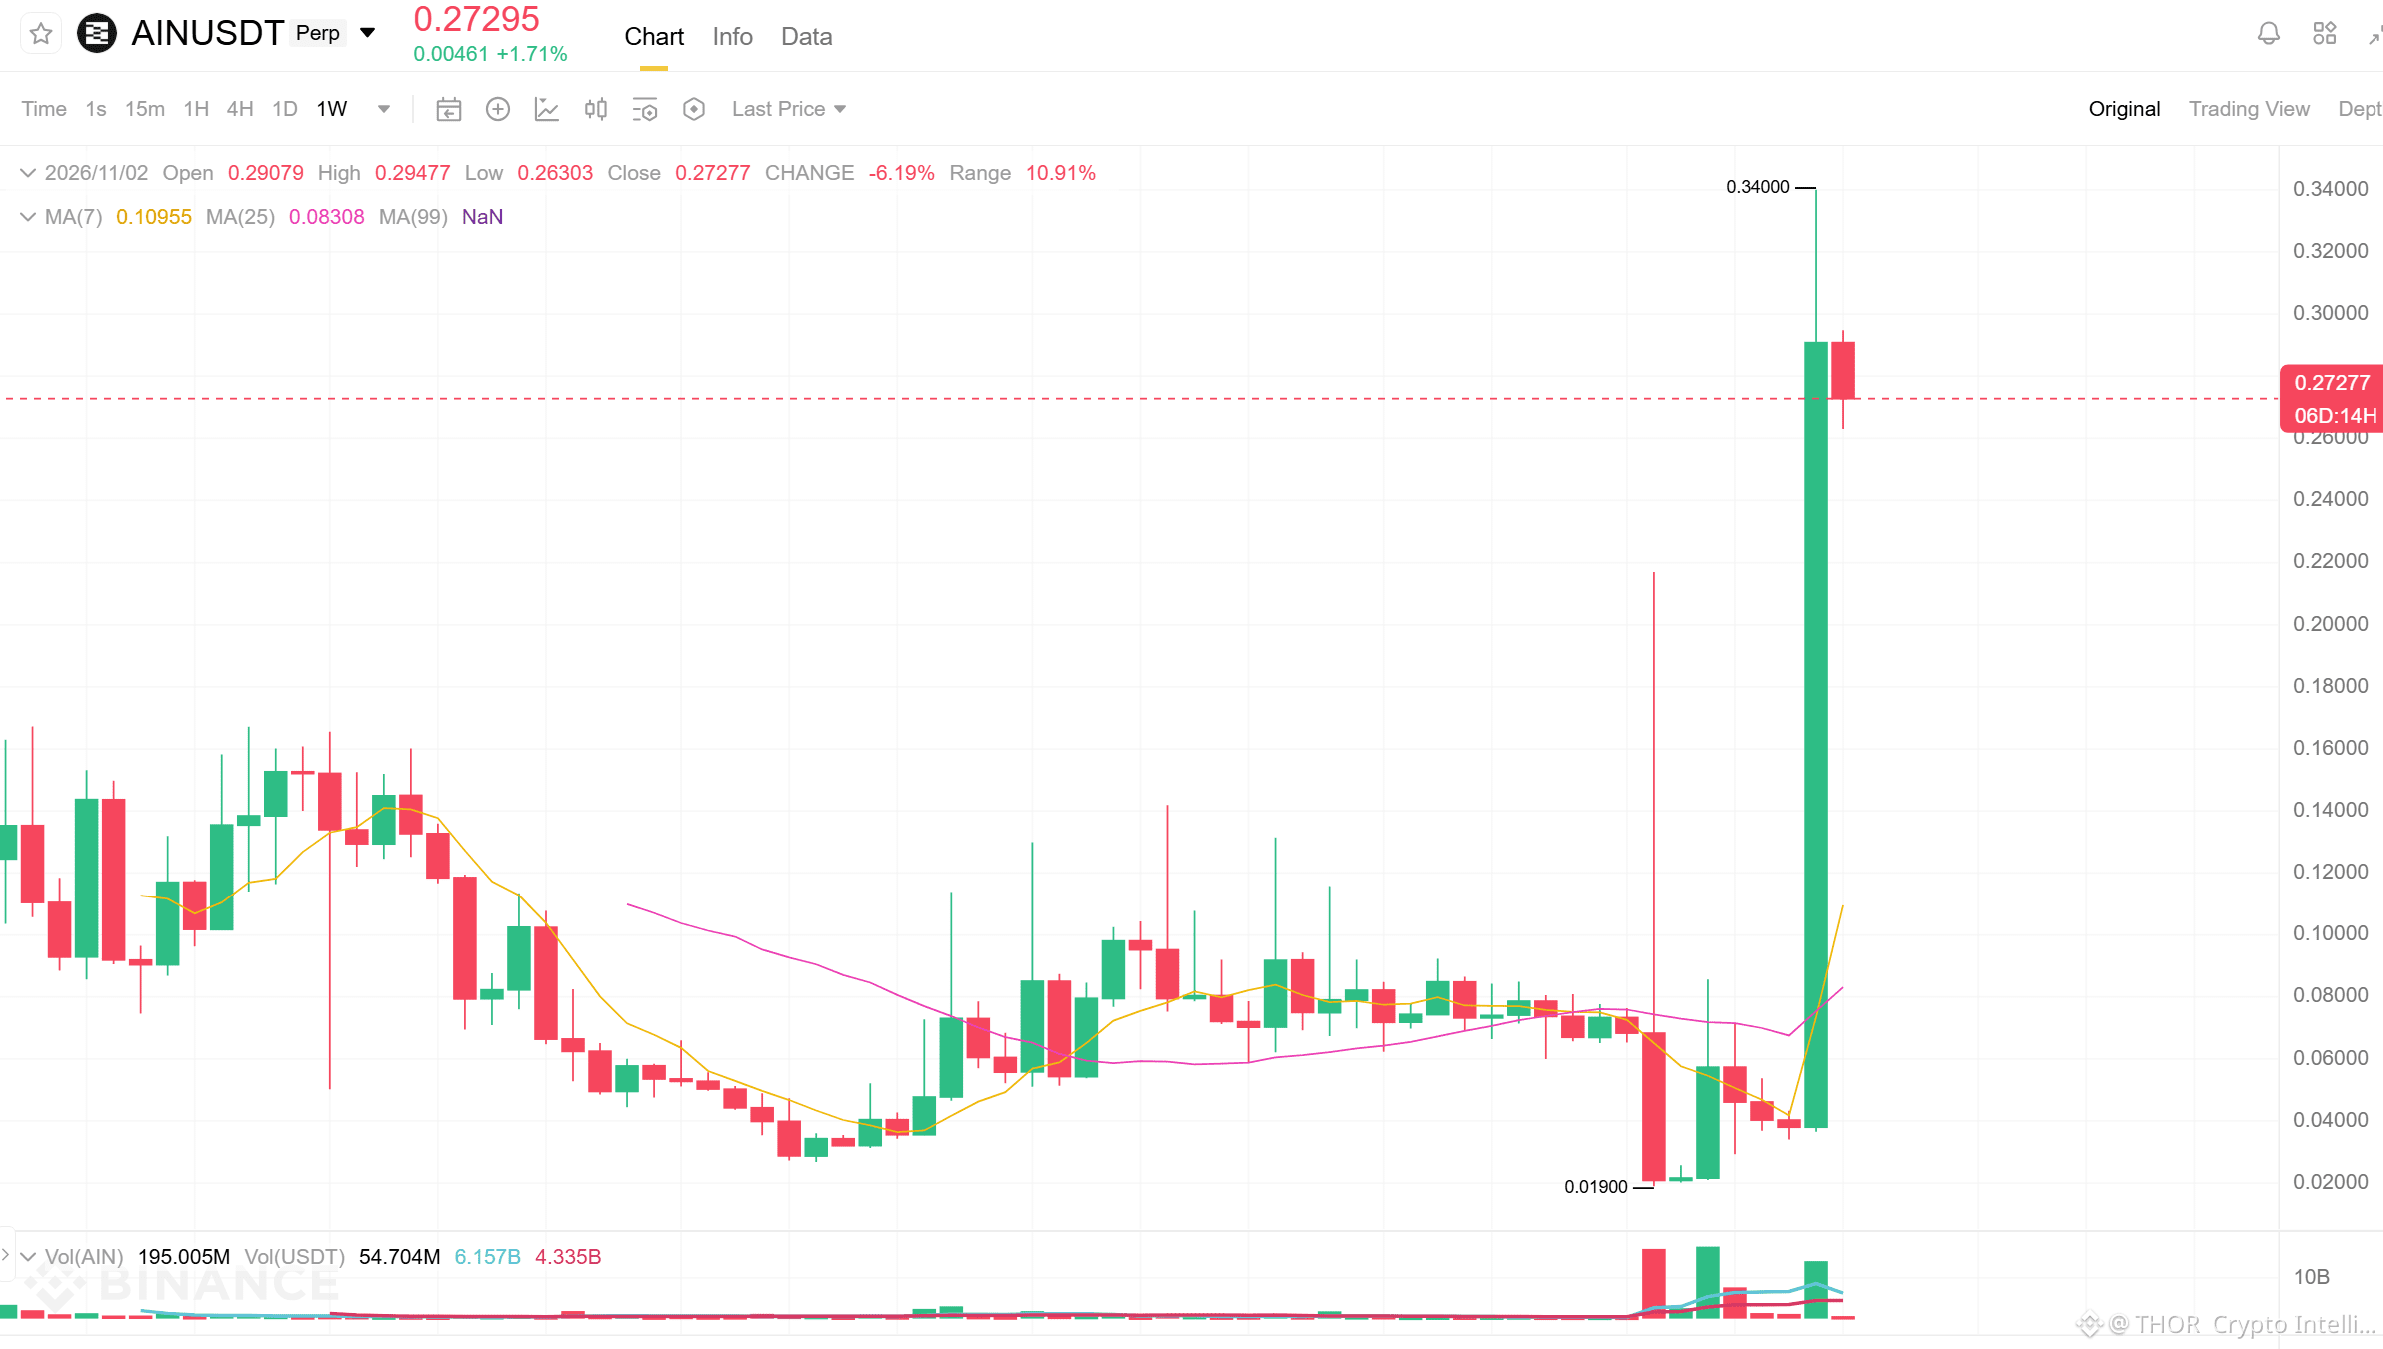
🚨 $AIN 'S MEGA RALLY HITS RESISTANCE — $0.34 IS THE NEXT TEST!
#AIN has exploded from near $0.02 to $0.34, but the weekly chart now shows its first significant rejection.
⚡ THOR Weekly Update
📍 Current: $0.2728
🔺 Weekly high: $0.3400
🔴 Immediate resistance: $0.2950
🟢 Near-term support: $0.2630
📊 MA(7): $0.1096
📊 MA(25): $0.0831
🟢 Bull case: Reclaim $0.295 and challenge $0.34.
🔴 Bear case: Lose $0.263 and risk a deeper correction.
⚠️ THOR Risk Alert:
AIN has moved vertically and is trading far above its weekly averages. Extreme volatility and profit-taking risk remain high.
⚡ THOR Signal:
Major bullish breakout, but the weekly candle needs confirmation. Don't chase blindly.
👇 What's next?
🟢 Another rally
🟡 Consolidation
🔴 Sharp correction
#EsportsTrading #IDOL #LYN #WeeklyChart
{future}(AINUSDT)
$LYN
{future}(LYNUSDT)
$IDOL
{future}(IDOLUSDT)
🚨 $AIN 'S MEGA RALLY HITS RESISTANCE — $0.34 IS THE NEXT TEST!
#AIN has exploded from near $0.02 to $0.34, but the weekly chart now shows its first significant rejection.
⚡ THOR Weekly Update
📍 Current: $0.2728
🔺 Weekly high: $0.3400
🔴 Immediate resistance: $0.2950
🟢 Near-term support: $0.2630
📊 MA(7): $0.1096
📊 MA(25): $0.0831
🟢 Bull case: Reclaim $0.295 and challenge $0.34.
🔴 Bear case: Lose $0.263 and risk a deeper correction.
⚠️ THOR Risk Alert:
AIN has moved vertically and is trading far above its weekly averages. Extreme volatility and profit-taking risk remain high.
⚡ THOR Signal:
Major bullish breakout, but the weekly candle needs confirmation. Don't chase blindly.
👇 What's next?
🟢 Another rally
🟡 Consolidation
🔴 Sharp correction
#EsportsTrading #IDOL #LYN #WeeklyChart
$LYN
$IDOL
#AIN has exploded from near $0.02 to $0.34, but the weekly chart now shows its first significant rejection.
⚡ THOR Weekly Update
📍 Current: $0.2728
🔺 Weekly high: $0.3400
🔴 Immediate resistance: $0.2950
🟢 Near-term support: $0.2630
📊 MA(7): $0.1096
📊 MA(25): $0.0831
🟢 Bull case: Reclaim $0.295 and challenge $0.34.
🔴 Bear case: Lose $0.263 and risk a deeper correction.
⚠️ THOR Risk Alert:
AIN has moved vertically and is trading far above its weekly averages. Extreme volatility and profit-taking risk remain high.
⚡ THOR Signal:
Major bullish breakout, but the weekly candle needs confirmation. Don't chase blindly.
👇 What's next?
🟢 Another rally
🟡 Consolidation
🔴 Sharp correction
#EsportsTrading #IDOL #LYN #WeeklyChart
$LYN
$IDOL
770

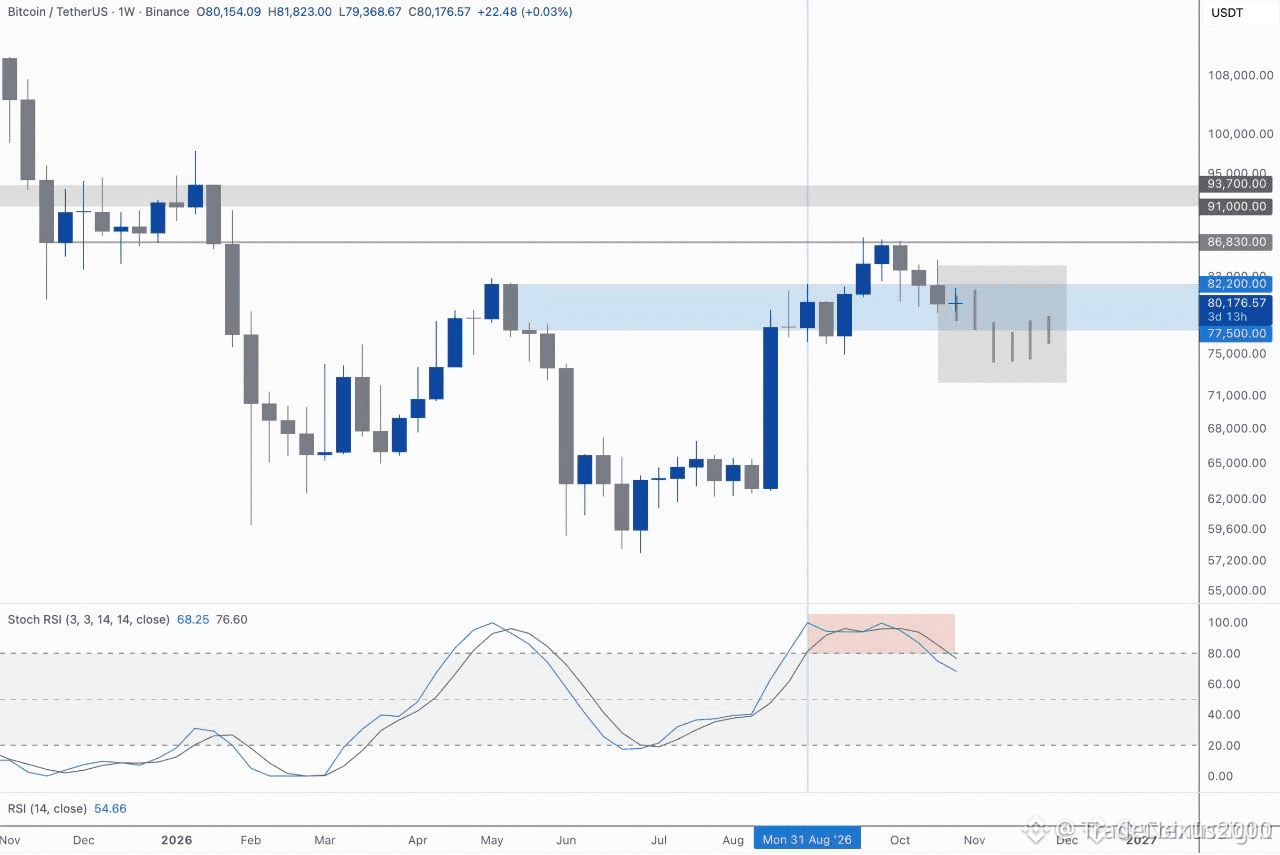
🚀 📈 $BTC STOKASTIC RSI BREAKS OVERBOUGHT ZONE – BULLS GAIN MOMENTUM
The weekly Stochastic RSI has finally escaped the overbought territory, snapping back below the 80% threshold. 📊 This divergence suggests that buying pressure remains intact while immediate sell‑off pressure is waning.
Coupled with a tepid correction that failed to breach the 30‑day moving average, the market structure stays bullish. ⚡ Smart money appears to be consolidating liquidity above the recent swing high, priming a clean upside thrust.
💬 Do you see the next leg targeting the next resistance zone, or are you waiting for a deeper pullback?
⚠️ Not financial advice. Always manage your risk. 🛡️
🏷️ #BTC #BullishSetup #StochRSI #WeeklyChart #Crypto
🔥 💎
🚀 📈 $BTC STOKASTIC RSI BREAKS OVERBOUGHT ZONE – BULLS GAIN MOMENTUM
The weekly Stochastic RSI has finally escaped the overbought territory, snapping back below the 80% threshold. 📊 This divergence suggests that buying pressure remains intact while immediate sell‑off pressure is waning.
Coupled with a tepid correction that failed to breach the 30‑day moving average, the market structure stays bullish. ⚡ Smart money appears to be consolidating liquidity above the recent swing high, priming a clean upside thrust.
💬 Do you see the next leg targeting the next resistance zone, or are you waiting for a deeper pullback?
⚠️ Not financial advice. Always manage your risk. 🛡️
🏷️ #BTC #BullishSetup #StochRSI #WeeklyChart #Crypto
🔥 💎
The weekly Stochastic RSI has finally escaped the overbought territory, snapping back below the 80% threshold. 📊 This divergence suggests that buying pressure remains intact while immediate sell‑off pressure is waning.
Coupled with a tepid correction that failed to breach the 30‑day moving average, the market structure stays bullish. ⚡ Smart money appears to be consolidating liquidity above the recent swing high, priming a clean upside thrust.
💬 Do you see the next leg targeting the next resistance zone, or are you waiting for a deeper pullback?
⚠️ Not financial advice. Always manage your risk. 🛡️
🏷️ #BTC #BullishSetup #StochRSI #WeeklyChart #Crypto
🔥 💎
3
$XRP JUST HIT THE LEVEL THAT BOTTOMED THE 2021-2023 CYCLE 🚨🟢
Body
📌 A weekly chart analyst spotted it first: XRP is trading near the exact 50% midpoint of its current range, the same spot that formed a major cycle bottom in the past. Price action now mirrors the 2021–2023 structure, where that zone ignited a multi-month recovery and eventual breakout above $1.90.
💡 On the 4H, buyers are stepping in hard at $1.09–1.10, pushing the Ultimate Oscillator back above 50 and Stochastic RSI out of oversold. Momentum is shifting, but a clean break above $1.16 is needed to flip the short-term structure. If this historical fractal repeats, the stage is set for a major higher-timeframe bounce. 💬 Do you trust the 50% level to hold like it did last time, or are you waiting for confirmation above $1.16? 👇
⚠️ Not financial advice. Always manage your risk. 🛡️
🏷️ #XRP #LongSetup #CryptoAnalysis #WeeklyChart #Altcoins
🦈 🔍
$XRP JUST HIT THE LEVEL THAT BOTTOMED THE 2021-2023 CYCLE 🚨🟢
Body
📌 A weekly chart analyst spotted it first: XRP is trading near the exact 50% midpoint of its current range, the same spot that formed a major cycle bottom in the past. Price action now mirrors the 2021–2023 structure, where that zone ignited a multi-month recovery and eventual breakout above $1.90.
💡 On the 4H, buyers are stepping in hard at $1.09–1.10, pushing the Ultimate Oscillator back above 50 and Stochastic RSI out of oversold. Momentum is shifting, but a clean break above $1.16 is needed to flip the short-term structure. If this historical fractal repeats, the stage is set for a major higher-timeframe bounce. 💬 Do you trust the 50% level to hold like it did last time, or are you waiting for confirmation above $1.16? 👇
⚠️ Not financial advice. Always manage your risk. 🛡️
🏷️ #XRP #LongSetup #CryptoAnalysis #WeeklyChart #Altcoins
🦈 🔍
Body
📌 A weekly chart analyst spotted it first: XRP is trading near the exact 50% midpoint of its current range, the same spot that formed a major cycle bottom in the past. Price action now mirrors the 2021–2023 structure, where that zone ignited a multi-month recovery and eventual breakout above $1.90.
💡 On the 4H, buyers are stepping in hard at $1.09–1.10, pushing the Ultimate Oscillator back above 50 and Stochastic RSI out of oversold. Momentum is shifting, but a clean break above $1.16 is needed to flip the short-term structure. If this historical fractal repeats, the stage is set for a major higher-timeframe bounce. 💬 Do you trust the 50% level to hold like it did last time, or are you waiting for confirmation above $1.16? 👇
⚠️ Not financial advice. Always manage your risk. 🛡️
🏷️ #XRP #LongSetup #CryptoAnalysis #WeeklyChart #Altcoins
🦈 🔍
61

·
--
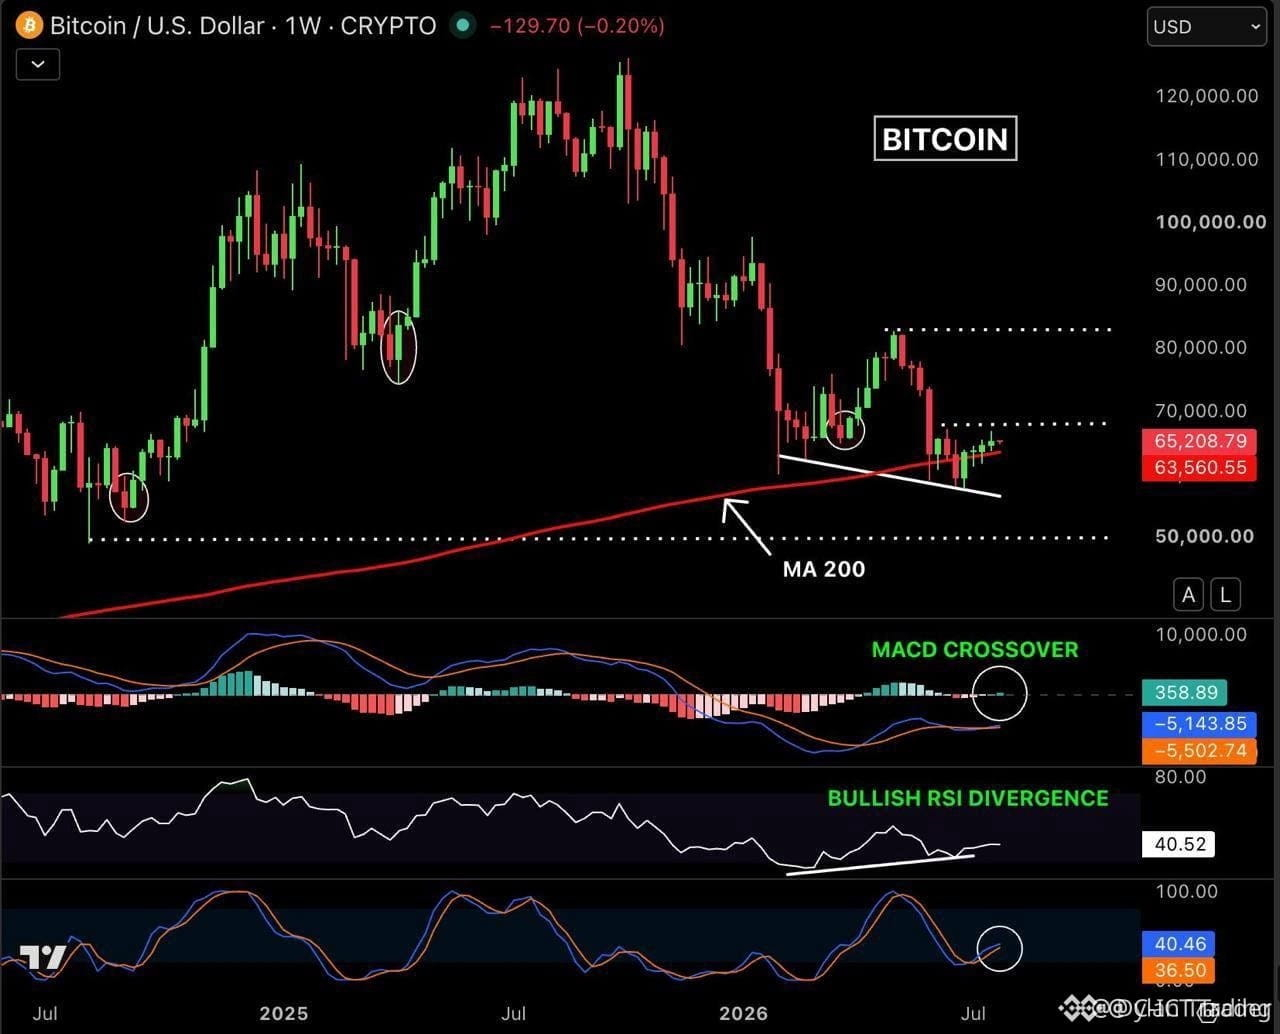
🚨 $BTC WEEKLY MACD BULLISH CROSS – PRICE HOLDS 200-WEEK MA! 🐂📊
📊 Bitcoin closed the week green, printing a textbook bullish MACD crossover on the weekly while RSI divergence remains structurally intact. 🐂 Price continues to respect the rising 200-week moving average as dynamic support — a zone that has historically marked macro bottoms.
💡 The real catalyst comes if price can clear $67,000 with conviction. That barrier represents a liquidity pool from prior distribution, and a clean reclaim would open the door for a sustained move higher. 📌 Are you positioned for the breakout or waiting for one more retest of the demand zone? 💬
⚠️ Not financial advice. Always manage your risk. 🛡️
🏷️ #BTC #WeeklyChart #BullishCrossover #Bitcoin #Crypto
🐂 📊
🚨 $BTC WEEKLY MACD BULLISH CROSS – PRICE HOLDS 200-WEEK MA! 🐂📊
📊 Bitcoin closed the week green, printing a textbook bullish MACD crossover on the weekly while RSI divergence remains structurally intact. 🐂 Price continues to respect the rising 200-week moving average as dynamic support — a zone that has historically marked macro bottoms.
💡 The real catalyst comes if price can clear $67,000 with conviction. That barrier represents a liquidity pool from prior distribution, and a clean reclaim would open the door for a sustained move higher. 📌 Are you positioned for the breakout or waiting for one more retest of the demand zone? 💬
⚠️ Not financial advice. Always manage your risk. 🛡️
🏷️ #BTC #WeeklyChart #BullishCrossover #Bitcoin #Crypto
🐂 📊
📊 Bitcoin closed the week green, printing a textbook bullish MACD crossover on the weekly while RSI divergence remains structurally intact. 🐂 Price continues to respect the rising 200-week moving average as dynamic support — a zone that has historically marked macro bottoms.
💡 The real catalyst comes if price can clear $67,000 with conviction. That barrier represents a liquidity pool from prior distribution, and a clean reclaim would open the door for a sustained move higher. 📌 Are you positioned for the breakout or waiting for one more retest of the demand zone? 💬
⚠️ Not financial advice. Always manage your risk. 🛡️
🏷️ #BTC #WeeklyChart #BullishCrossover #Bitcoin #Crypto
🐂 📊
43

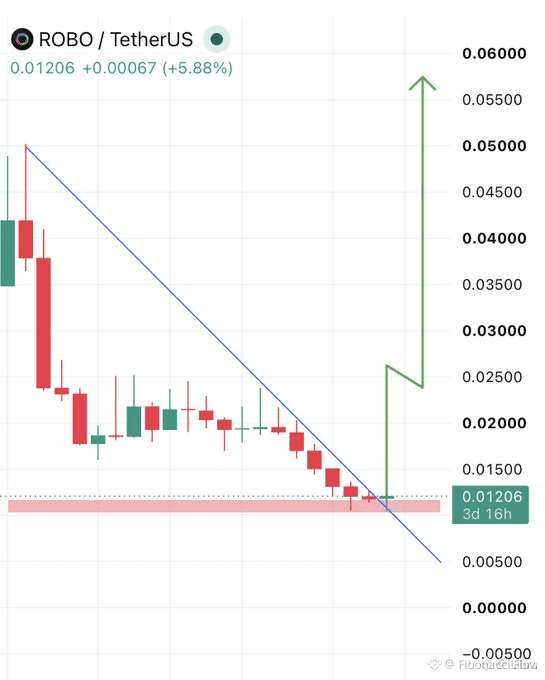
🚨 $ROBO DOUBLE BOTTOM ON THE WEEKLY — THE WHALES ARE LOADING 💥
📌 This isn't a scalp — this is a structural shift. The weekly double bottom pattern on $ROBO signals a massive absorption of supply at the lows, with buyers aggressively defending that zone over multiple weeks. 📊 Volume profiles show accumulation accelerating as each retest of the support base is met with shrinking sell pressure.
💡 When a double bottom prints on the weekly, it often precedes multi-week momentum expansion. The path of least resistance is tilting bullish, and the smart money has already placed their bids. 💬 Are you watching for the weekly close confirmation, or waiting for a cleaner breakout entry? 👇
⚠️ Not financial advice. Always manage your risk. 🛡️
🏷️ #ROBO #DoubleBottom #WeeklyChart #Crypto #Bullish
🐂 📈
🚨 $ROBO DOUBLE BOTTOM ON THE WEEKLY — THE WHALES ARE LOADING 💥
📌 This isn't a scalp — this is a structural shift. The weekly double bottom pattern on $ROBO signals a massive absorption of supply at the lows, with buyers aggressively defending that zone over multiple weeks. 📊 Volume profiles show accumulation accelerating as each retest of the support base is met with shrinking sell pressure.
💡 When a double bottom prints on the weekly, it often precedes multi-week momentum expansion. The path of least resistance is tilting bullish, and the smart money has already placed their bids. 💬 Are you watching for the weekly close confirmation, or waiting for a cleaner breakout entry? 👇
⚠️ Not financial advice. Always manage your risk. 🛡️
🏷️ #ROBO #DoubleBottom #WeeklyChart #Crypto #Bullish
🐂 📈
📌 This isn't a scalp — this is a structural shift. The weekly double bottom pattern on $ROBO signals a massive absorption of supply at the lows, with buyers aggressively defending that zone over multiple weeks. 📊 Volume profiles show accumulation accelerating as each retest of the support base is met with shrinking sell pressure.
💡 When a double bottom prints on the weekly, it often precedes multi-week momentum expansion. The path of least resistance is tilting bullish, and the smart money has already placed their bids. 💬 Are you watching for the weekly close confirmation, or waiting for a cleaner breakout entry? 👇
⚠️ Not financial advice. Always manage your risk. 🛡️
🏷️ #ROBO #DoubleBottom #WeeklyChart #Crypto #Bullish
🐂 📈
113

·
--
$NEAR 🚀
Those who left behind
Next stop: $7 coming 🎯
NEAR weekly resistance breakout loading… 💥
Breakout confirmed = bulls in control 🚀🚀
{spot}(NEARUSDT)
𝗙𝗢𝗟𝗟𝗢𝗪 𝗙𝗢𝗥 𝗠𝗢𝗥𝗘 𝗨𝗣𝗗𝗔𝗧𝗘𝗦 🔔
#NEAR #Crypto #Altcoin #Breakout
#WeeklyChart
⚠️ Not financial advice. Always do your own research. 🧠
$NEAR 🚀
Those who left behind
Next stop: $7 coming 🎯
NEAR weekly resistance breakout loading… 💥
Breakout confirmed = bulls in control 🚀🚀
𝗙𝗢𝗟𝗟𝗢𝗪 𝗙𝗢𝗥 𝗠𝗢𝗥𝗘 𝗨𝗣𝗗𝗔𝗧𝗘𝗦 🔔
#NEAR #Crypto #Altcoin #Breakout
#WeeklyChart
⚠️ Not financial advice. Always do your own research. 🧠
Those who left behind
Next stop: $7 coming 🎯
NEAR weekly resistance breakout loading… 💥
Breakout confirmed = bulls in control 🚀🚀
𝗙𝗢𝗟𝗟𝗢𝗪 𝗙𝗢𝗥 𝗠𝗢𝗥𝗘 𝗨𝗣𝗗𝗔𝗧𝗘𝗦 🔔
#NEAR #Crypto #Altcoin #Breakout
#WeeklyChart
⚠️ Not financial advice. Always do your own research. 🧠
52

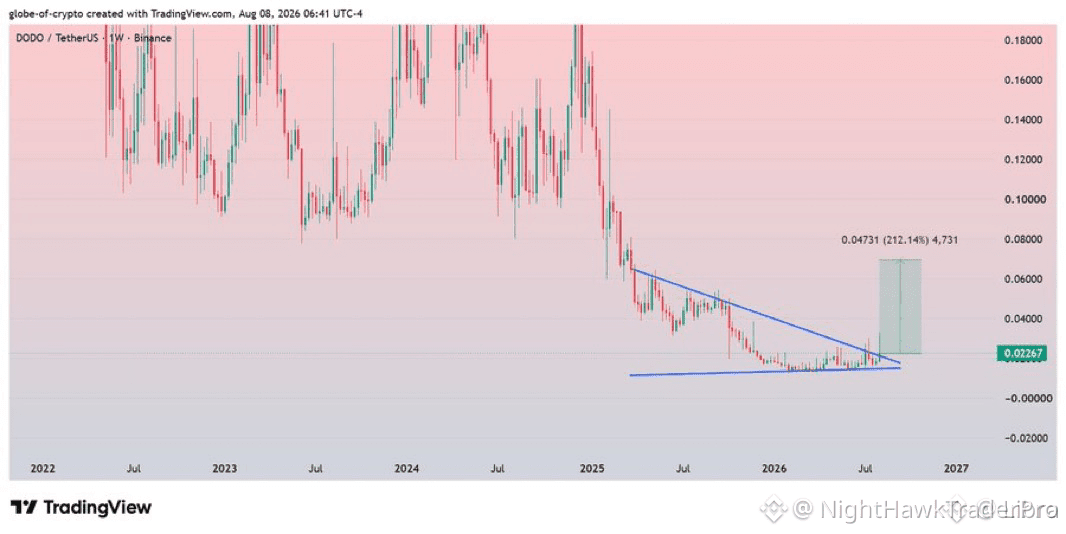
💥 $DODO BREAKS OUT OF DESCENDING TRIANGLE ON WEEKLY — 150-200% RECOVERY IN PLAY? 🐂
The weekly chart just lit up with a textbook descending triangle breakout after months of grinding lower. This pattern has a habit of sparking violent moves once the last seller steps aside, and $DODO is now leaning into that momentum. 📊
A successful breakout opens the door to a 150-200% recovery window in the weeks ahead. Volume confirmation and weekly closes above the trendline will be the tell. Watch for buyers to defend this zone like it's the last bid on the board. 🔍
💬 Is this the start of a genuine reversal, or will sellers drag it back inside the triangle for one last trap? 👇
⚠️ Not financial advice. Always manage your risk. 🛡️
🏷️ #DODO #TriangleBreakout #WeeklyChart #Crypto #Momentum
🐂 🌕
💥 $DODO BREAKS OUT OF DESCENDING TRIANGLE ON WEEKLY — 150-200% RECOVERY IN PLAY? 🐂
The weekly chart just lit up with a textbook descending triangle breakout after months of grinding lower. This pattern has a habit of sparking violent moves once the last seller steps aside, and $DODO is now leaning into that momentum. 📊
A successful breakout opens the door to a 150-200% recovery window in the weeks ahead. Volume confirmation and weekly closes above the trendline will be the tell. Watch for buyers to defend this zone like it's the last bid on the board. 🔍
💬 Is this the start of a genuine reversal, or will sellers drag it back inside the triangle for one last trap? 👇
⚠️ Not financial advice. Always manage your risk. 🛡️
🏷️ #DODO #TriangleBreakout #WeeklyChart #Crypto #Momentum
🐂 🌕
The weekly chart just lit up with a textbook descending triangle breakout after months of grinding lower. This pattern has a habit of sparking violent moves once the last seller steps aside, and $DODO is now leaning into that momentum. 📊
A successful breakout opens the door to a 150-200% recovery window in the weeks ahead. Volume confirmation and weekly closes above the trendline will be the tell. Watch for buyers to defend this zone like it's the last bid on the board. 🔍
💬 Is this the start of a genuine reversal, or will sellers drag it back inside the triangle for one last trap? 👇
⚠️ Not financial advice. Always manage your risk. 🛡️
🏷️ #DODO #TriangleBreakout #WeeklyChart #Crypto #Momentum
🐂 🌕
89
Log in to explore more content
Join global crypto users on Binance Square
⚡️ Get latest and useful information about crypto.
💬 Trusted by the world’s largest crypto exchange.
👍 Discover real insights from verified creators.
Email / Phone number
Trending Topics
1
#CanBTCReboundAfterFallingBelow60K?
374,440 views
1,588 Discussing
2
#GlobalStocksFaceLongestLosingStreakSince2023
123,905 views
1,122 Discussing
3
#BlackRockIBITPostsRecord$541MSingleDayOutflow
721 views
17 Discussing
4
#AnthropicPlungesTowardIPOPriceonDay2
59,580 views
605 Discussing
5
#TwentyOneCapitalAdds172.25BTC
12,105 views
165 Discussing
6
#HKBillWouldExcludeTokenizedDepositsFromVirtualAssets
1,017 views
15 Discussing
7
#BNBDropsBelow540USDTWith8.46%DailyDecline
32,808 views
284 Discussing
8
#HKBillProposesHK$100KFineForUnauthorizedCryptoTitles
1,079 views
16 Discussing
9
#BitMineFaces$10.1BUnrealizedETHLoss
2,028 views
19 Discussing
10
#StrategyReports$35BNetReserves
2,046 views
18 Discussing