
#vix
vix
73,688 views
330 Discussing
Hot
Latest

·
--
Article
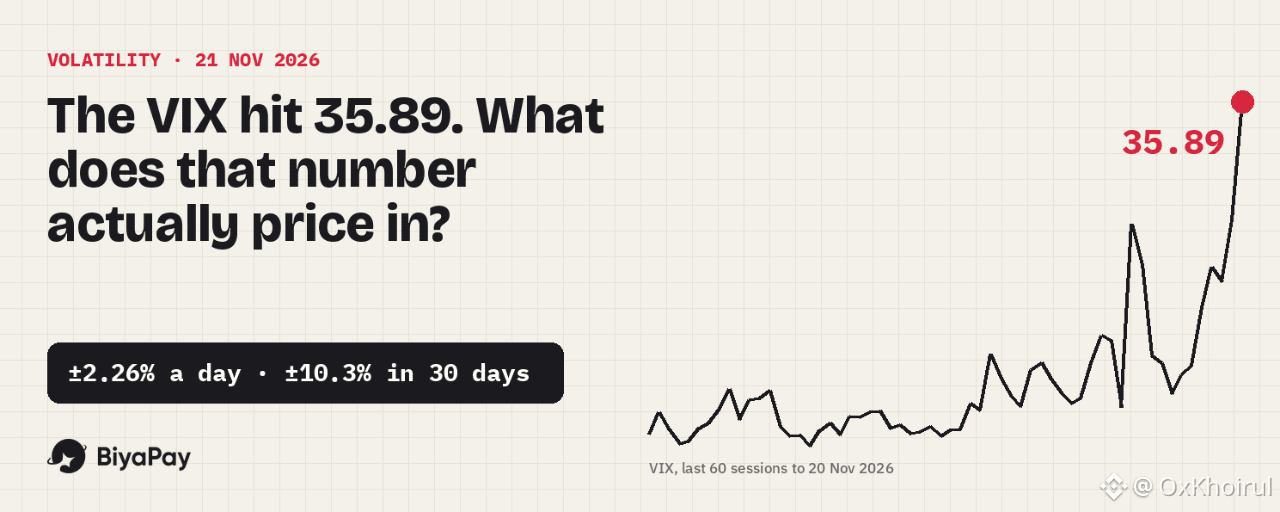
VIX at 35.89: How Big a Daily Swing It Prices In, and How Long Past Spikes LastedDisclosure: It is not financial advice
What happened on Friday
On Friday 20 November 2026 the S&P 500 fell 3.7% to 6,910.39 and the Nasdaq Composite lost 5.28% to 22,617.73, according to CNBC. The S&P 500 and the Dow both closed more than 10% below their records, and the Nasdaq-100 briefly traded 20% below its high. Nvidia fell about 14% and AMD more than 13%.
The number that moved the most was the Cboe Volatility Index. The VIX closed at 35.89, up from 28.44 on Thursday and 19.30 a week earlier. During the session it touched 40.03. In Yahoo Finance's daily data, that is the highest close since 11 April 2025.
"Fear index near 36" makes a good headline, but it does not tell you much on its own. I wanted two answers: what the number means in dollars, and what usually happened to the VIX after a reading like this.
What 35.89 means in dollars
The VIX is built from S&P 500 option prices. It expresses the move the options market expects over the next 30 days, as an annualised percentage. Two conversions make it usable:
Daily: divide by √252, which is about 15.87. 35.89 ÷ 15.87 = about 2.26% a day.30 days: multiply by √(30/365), about 0.287. 35.89 × 0.287 = about 10.3%.
Both are one-standard-deviation figures, so roughly two days out of three should land inside them.
On $10,000 in an S&P 500 fund, that is a ±$226 day and a ±$1,029 month. On the index itself it is about ±156 points a day from 6,910. On 6 October, the day of the record close, the VIX was 15.01, which priced a ±$95 day on the same $10,000. The same position now carries 2.4 times the expected daily swing.
Friday also showed the limit of the estimate. Thursday's close of 28.44 priced a ±1.79% day. The index fell 3.70%, about 2.1 standard deviations. An expected move describes a typical day. It is not a ceiling.
How long did past spikes last?
I went back to 1990 and marked every time the VIX first closed at 35 or higher after at least three months (63 trading days) without such a close. That gives 17 earlier episodes. For each one I counted the trading days until the VIX closed back below 25, and I measured how volatile the S&P 500 actually was over the next 21 trading days.
Median time back below 25: 14 trading days. 8 of the 17 got there within 10 days, for example 3 days in August 2024 and 5 days in December 2018.6 of 17 took 45 trading days or more: 1998, 2001, 2002, 2008, 2011 and 2020. The 2008 episode took 209.Getting back below 20 took much longer, with a median of 73 trading days.In 7 of 17 the VIX climbed further after that first close above 35, as high as 80.86 in 2008 and 82.69 in 2020.
Implied versus what actually happened
This was the part I found most useful. In 13 of the 17 episodes, the S&P 500's realised volatility over the next 21 trading days came in below the VIX reading on the first day. The median realised figure was 25.5, against a median VIX of 38.55. Options were priced for more turbulence than usually arrived, which matches what Cboe itself describes as implied volatility tending to trade at a premium to realised volatility.
The four exceptions were the episodes that turned into crises: 1998 (realised 42.0 against a VIX of 38.55), 2002 (45.3 against 35.03), 2008 (80.2 against 36.22) and 2020 (95.4 against 39.16). So the VIX usually overstates the next month, and occasionally understates it by a wide margin. Nobody is told in advance which kind of month it will be.
One more reading from this week: the VIX closed above the three-month VIX3M, 35.89 against 30.94, a ratio of 1.16. Since July 2006 the VIX has closed above the VIX3M on 10.9% of trading days. It means the market is paying more for protection over the next month than over the next three.
Why buying the VIX is not what it sounds like
The VIX itself cannot be bought. Exchange-traded products such as VIXY hold short-term VIX futures and roll them forward. When later futures cost more than nearer ones, which is the usual shape of the curve, every roll loses a little.
The last twelve months show how much that adds up to. From 20 November 2025 to 20 November 2026 the VIX rose from 26.42 to 35.89, up 35.8%. VIXY went from $38.20 to $25.95, down 32.1%. Even this week, when the VIX jumped 86% from 19.30, VIXY rose 44.6%, from $17.94 to $25.95.
A volatility ETF can pay off over a few days of panic. Held for months, it has to beat its own roll cost first.
Trading a high-VIX week on BiyaPay
BiyaPay gives access to US-listed stocks and ETFs, including SPY, QQQ and VIXY, for users outside the United States. In a week like this, a few features matter more than usual:
Extended hours: orders can run in the pre-market, regular and after-hours sessions. After Friday's close, VIXY traded at 24.80 after hours (−4.43%) and SPY at 697.49 (+1.11%), so Monday's starting price can already be far from Friday's close.Order types: Limit, Market and Stop order. When spreads widen, a limit order fixes the price you pay, while a market order only guarantees that you get filled.Options: US stock and ETF options sit under the Option tab of each stock page and trade in the regular session only, 09:30–16:00 New York time, which is 21:30–04:00 WIB at the moment.Fees: commission is $0. The platform fee is $0.005 per share with a $0.99 minimum per order, settlement is $0.003 per share, and sells add the SEC fee and the trading activity fee.Funding: deposit USDT or fiat, then convert to USD inside the app. Currency exchange runs 24 hours a day with no commission, at the live rate.
Here is how I turn the VIX into a position size. I decide the typical daily swing I can live with, say $150, and divide it by the daily move.
At a VIX of 15.01 (about 0.95% a day): about $15,860, or 22 SPY shares at $689.81 ($15,175.82).At a VIX of 35.89 (about 2.26% a day): about $6,634, or 9 SPY shares ($6,208.29).
Same risk budget, less than half the position. Buying those 9 shares costs the $0.99 minimum platform fee plus $0.027 settlement, about $1.02. Selling them at the same price adds an SEC fee of about $0.13 and the $0.01 minimum trading activity fee, about $1.16. The round trip is about $2.17, or 0.035%. Next to a ±$140 typical day on that position, the fee is a rounding error. The size is what decides the outcome.
My take
I read the VIX as a sizing input, not as a buy or sell signal. History says a first close above 35 usually fades within a few weeks, and that the month after is usually calmer than options priced. But the four times it was not calmer are exactly the ones that hurt, so I size for the exception rather than the median.
What I actually do in a week like this:
Recalculate each position's typical daily swing in dollars with VIX ÷ √252, not in percent.If that number is bigger than I can accept, cut the size now instead of waiting for a bounce.Leave margin alone while the VIX is above 30. BiyaPay allows up to 4x buying power on stocks, but 4x on a 2.26% day is a 9% day.Do not hold a VIX futures ETF as a long-term hedge. The last year showed what the roll does to it.Use limit orders around the open, because after-hours prices can gap away from the last close.
A VIX of 35.89 does not say whether the low is in. It says how wide the road is, and that is enough to decide how fast to drive.
Source: CNBC, "Stock market news for Nov. 20, 2026" (20 Nov 2026); AP, "S&P 500 sinks 3.7% and the Nasdaq composite goes negative for the year" (20 Nov 2026); Cboe, VIX Index overview and trade data as of 20 Nov 2026; Yahoo Finance daily closes for ^VIX (Jan 1990 to 20 Nov 2026), ^VIX3M (Jul 2006 to 20 Nov 2026), ^GSPC, VIXY and SPY (checked 21 Nov 2026). Episode counts, realised volatility, sizing and fee arithmetic are my own calculations.
#BiyaPay #VIX #SP500 #Volatility #StockMarket
VIX at 35.89: How Big a Daily Swing It Prices In, and How Long Past Spikes Lasted
Disclosure: It is not financial advice
What happened on Friday
On Friday 20 November 2026 the S&P 500 fell 3.7% to 6,910.39 and the Nasdaq Composite lost 5.28% to 22,617.73, according to CNBC. The S&P 500 and the Dow both closed more than 10% below their records, and the Nasdaq-100 briefly traded 20% below its high. Nvidia fell about 14% and AMD more than 13%.
The number that moved the most was the Cboe Volatility Index. The VIX closed at 35.89, up from 28.44 on Thursday and 19.30 a week earlier. During the session it touched 40.03. In Yahoo Finance's daily data, that is the highest close since 11 April 2025.
"Fear index near 36" makes a good headline, but it does not tell you much on its own. I wanted two answers: what the number means in dollars, and what usually happened to the VIX after a reading like this.
What 35.89 means in dollars
The VIX is built from S&P 500 option prices. It expresses the move the options market expects over the next 30 days, as an annualised percentage. Two conversions make it usable:
Daily: divide by √252, which is about 15.87. 35.89 ÷ 15.87 = about 2.26% a day.30 days: multiply by √(30/365), about 0.287. 35.89 × 0.287 = about 10.3%.
Both are one-standard-deviation figures, so roughly two days out of three should land inside them.
On $10,000 in an S&P 500 fund, that is a ±$226 day and a ±$1,029 month. On the index itself it is about ±156 points a day from 6,910. On 6 October, the day of the record close, the VIX was 15.01, which priced a ±$95 day on the same $10,000. The same position now carries 2.4 times the expected daily swing.
Friday also showed the limit of the estimate. Thursday's close of 28.44 priced a ±1.79% day. The index fell 3.70%, about 2.1 standard deviations. An expected move describes a typical day. It is not a ceiling.
How long did past spikes last?
I went back to 1990 and marked every time the VIX first closed at 35 or higher after at least three months (63 trading days) without such a close. That gives 17 earlier episodes. For each one I counted the trading days until the VIX closed back below 25, and I measured how volatile the S&P 500 actually was over the next 21 trading days.
Median time back below 25: 14 trading days. 8 of the 17 got there within 10 days, for example 3 days in August 2024 and 5 days in December 2018.6 of 17 took 45 trading days or more: 1998, 2001, 2002, 2008, 2011 and 2020. The 2008 episode took 209.Getting back below 20 took much longer, with a median of 73 trading days.In 7 of 17 the VIX climbed further after that first close above 35, as high as 80.86 in 2008 and 82.69 in 2020.
Implied versus what actually happened
This was the part I found most useful. In 13 of the 17 episodes, the S&P 500's realised volatility over the next 21 trading days came in below the VIX reading on the first day. The median realised figure was 25.5, against a median VIX of 38.55. Options were priced for more turbulence than usually arrived, which matches what Cboe itself describes as implied volatility tending to trade at a premium to realised volatility.
The four exceptions were the episodes that turned into crises: 1998 (realised 42.0 against a VIX of 38.55), 2002 (45.3 against 35.03), 2008 (80.2 against 36.22) and 2020 (95.4 against 39.16). So the VIX usually overstates the next month, and occasionally understates it by a wide margin. Nobody is told in advance which kind of month it will be.
One more reading from this week: the VIX closed above the three-month VIX3M, 35.89 against 30.94, a ratio of 1.16. Since July 2006 the VIX has closed above the VIX3M on 10.9% of trading days. It means the market is paying more for protection over the next month than over the next three.
Why buying the VIX is not what it sounds like
The VIX itself cannot be bought. Exchange-traded products such as VIXY hold short-term VIX futures and roll them forward. When later futures cost more than nearer ones, which is the usual shape of the curve, every roll loses a little.
The last twelve months show how much that adds up to. From 20 November 2025 to 20 November 2026 the VIX rose from 26.42 to 35.89, up 35.8%. VIXY went from $38.20 to $25.95, down 32.1%. Even this week, when the VIX jumped 86% from 19.30, VIXY rose 44.6%, from $17.94 to $25.95.
A volatility ETF can pay off over a few days of panic. Held for months, it has to beat its own roll cost first.
Trading a high-VIX week on BiyaPay
BiyaPay gives access to US-listed stocks and ETFs, including SPY, QQQ and VIXY, for users outside the United States. In a week like this, a few features matter more than usual:
Extended hours: orders can run in the pre-market, regular and after-hours sessions. After Friday's close, VIXY traded at 24.80 after hours (−4.43%) and SPY at 697.49 (+1.11%), so Monday's starting price can already be far from Friday's close.Order types: Limit, Market and Stop order. When spreads widen, a limit order fixes the price you pay, while a market order only guarantees that you get filled.Options: US stock and ETF options sit under the Option tab of each stock page and trade in the regular session only, 09:30–16:00 New York time, which is 21:30–04:00 WIB at the moment.Fees: commission is $0. The platform fee is $0.005 per share with a $0.99 minimum per order, settlement is $0.003 per share, and sells add the SEC fee and the trading activity fee.Funding: deposit USDT or fiat, then convert to USD inside the app. Currency exchange runs 24 hours a day with no commission, at the live rate.
Here is how I turn the VIX into a position size. I decide the typical daily swing I can live with, say $150, and divide it by the daily move.
At a VIX of 15.01 (about 0.95% a day): about $15,860, or 22 SPY shares at $689.81 ($15,175.82).At a VIX of 35.89 (about 2.26% a day): about $6,634, or 9 SPY shares ($6,208.29).
Same risk budget, less than half the position. Buying those 9 shares costs the $0.99 minimum platform fee plus $0.027 settlement, about $1.02. Selling them at the same price adds an SEC fee of about $0.13 and the $0.01 minimum trading activity fee, about $1.16. The round trip is about $2.17, or 0.035%. Next to a ±$140 typical day on that position, the fee is a rounding error. The size is what decides the outcome.
My take
I read the VIX as a sizing input, not as a buy or sell signal. History says a first close above 35 usually fades within a few weeks, and that the month after is usually calmer than options priced. But the four times it was not calmer are exactly the ones that hurt, so I size for the exception rather than the median.
What I actually do in a week like this:
Recalculate each position's typical daily swing in dollars with VIX ÷ √252, not in percent.If that number is bigger than I can accept, cut the size now instead of waiting for a bounce.Leave margin alone while the VIX is above 30. BiyaPay allows up to 4x buying power on stocks, but 4x on a 2.26% day is a 9% day.Do not hold a VIX futures ETF as a long-term hedge. The last year showed what the roll does to it.Use limit orders around the open, because after-hours prices can gap away from the last close.
A VIX of 35.89 does not say whether the low is in. It says how wide the road is, and that is enough to decide how fast to drive.
Source: CNBC, "Stock market news for Nov. 20, 2026" (20 Nov 2026); AP, "S&P 500 sinks 3.7% and the Nasdaq composite goes negative for the year" (20 Nov 2026); Cboe, VIX Index overview and trade data as of 20 Nov 2026; Yahoo Finance daily closes for ^VIX (Jan 1990 to 20 Nov 2026), ^VIX3M (Jul 2006 to 20 Nov 2026), ^GSPC, VIXY and SPY (checked 21 Nov 2026). Episode counts, realised volatility, sizing and fee arithmetic are my own calculations.
#BiyaPay #VIX #SP500 #Volatility #StockMarket
What happened on Friday
On Friday 20 November 2026 the S&P 500 fell 3.7% to 6,910.39 and the Nasdaq Composite lost 5.28% to 22,617.73, according to CNBC. The S&P 500 and the Dow both closed more than 10% below their records, and the Nasdaq-100 briefly traded 20% below its high. Nvidia fell about 14% and AMD more than 13%.
The number that moved the most was the Cboe Volatility Index. The VIX closed at 35.89, up from 28.44 on Thursday and 19.30 a week earlier. During the session it touched 40.03. In Yahoo Finance's daily data, that is the highest close since 11 April 2025.
"Fear index near 36" makes a good headline, but it does not tell you much on its own. I wanted two answers: what the number means in dollars, and what usually happened to the VIX after a reading like this.
What 35.89 means in dollars
The VIX is built from S&P 500 option prices. It expresses the move the options market expects over the next 30 days, as an annualised percentage. Two conversions make it usable:
Daily: divide by √252, which is about 15.87. 35.89 ÷ 15.87 = about 2.26% a day.30 days: multiply by √(30/365), about 0.287. 35.89 × 0.287 = about 10.3%.
Both are one-standard-deviation figures, so roughly two days out of three should land inside them.
On $10,000 in an S&P 500 fund, that is a ±$226 day and a ±$1,029 month. On the index itself it is about ±156 points a day from 6,910. On 6 October, the day of the record close, the VIX was 15.01, which priced a ±$95 day on the same $10,000. The same position now carries 2.4 times the expected daily swing.
Friday also showed the limit of the estimate. Thursday's close of 28.44 priced a ±1.79% day. The index fell 3.70%, about 2.1 standard deviations. An expected move describes a typical day. It is not a ceiling.
How long did past spikes last?
I went back to 1990 and marked every time the VIX first closed at 35 or higher after at least three months (63 trading days) without such a close. That gives 17 earlier episodes. For each one I counted the trading days until the VIX closed back below 25, and I measured how volatile the S&P 500 actually was over the next 21 trading days.
Median time back below 25: 14 trading days. 8 of the 17 got there within 10 days, for example 3 days in August 2024 and 5 days in December 2018.6 of 17 took 45 trading days or more: 1998, 2001, 2002, 2008, 2011 and 2020. The 2008 episode took 209.Getting back below 20 took much longer, with a median of 73 trading days.In 7 of 17 the VIX climbed further after that first close above 35, as high as 80.86 in 2008 and 82.69 in 2020.
Implied versus what actually happened
This was the part I found most useful. In 13 of the 17 episodes, the S&P 500's realised volatility over the next 21 trading days came in below the VIX reading on the first day. The median realised figure was 25.5, against a median VIX of 38.55. Options were priced for more turbulence than usually arrived, which matches what Cboe itself describes as implied volatility tending to trade at a premium to realised volatility.
The four exceptions were the episodes that turned into crises: 1998 (realised 42.0 against a VIX of 38.55), 2002 (45.3 against 35.03), 2008 (80.2 against 36.22) and 2020 (95.4 against 39.16). So the VIX usually overstates the next month, and occasionally understates it by a wide margin. Nobody is told in advance which kind of month it will be.
One more reading from this week: the VIX closed above the three-month VIX3M, 35.89 against 30.94, a ratio of 1.16. Since July 2006 the VIX has closed above the VIX3M on 10.9% of trading days. It means the market is paying more for protection over the next month than over the next three.
Why buying the VIX is not what it sounds like
The VIX itself cannot be bought. Exchange-traded products such as VIXY hold short-term VIX futures and roll them forward. When later futures cost more than nearer ones, which is the usual shape of the curve, every roll loses a little.
The last twelve months show how much that adds up to. From 20 November 2025 to 20 November 2026 the VIX rose from 26.42 to 35.89, up 35.8%. VIXY went from $38.20 to $25.95, down 32.1%. Even this week, when the VIX jumped 86% from 19.30, VIXY rose 44.6%, from $17.94 to $25.95.
A volatility ETF can pay off over a few days of panic. Held for months, it has to beat its own roll cost first.
Trading a high-VIX week on BiyaPay
BiyaPay gives access to US-listed stocks and ETFs, including SPY, QQQ and VIXY, for users outside the United States. In a week like this, a few features matter more than usual:
Extended hours: orders can run in the pre-market, regular and after-hours sessions. After Friday's close, VIXY traded at 24.80 after hours (−4.43%) and SPY at 697.49 (+1.11%), so Monday's starting price can already be far from Friday's close.Order types: Limit, Market and Stop order. When spreads widen, a limit order fixes the price you pay, while a market order only guarantees that you get filled.Options: US stock and ETF options sit under the Option tab of each stock page and trade in the regular session only, 09:30–16:00 New York time, which is 21:30–04:00 WIB at the moment.Fees: commission is $0. The platform fee is $0.005 per share with a $0.99 minimum per order, settlement is $0.003 per share, and sells add the SEC fee and the trading activity fee.Funding: deposit USDT or fiat, then convert to USD inside the app. Currency exchange runs 24 hours a day with no commission, at the live rate.
Here is how I turn the VIX into a position size. I decide the typical daily swing I can live with, say $150, and divide it by the daily move.
At a VIX of 15.01 (about 0.95% a day): about $15,860, or 22 SPY shares at $689.81 ($15,175.82).At a VIX of 35.89 (about 2.26% a day): about $6,634, or 9 SPY shares ($6,208.29).
Same risk budget, less than half the position. Buying those 9 shares costs the $0.99 minimum platform fee plus $0.027 settlement, about $1.02. Selling them at the same price adds an SEC fee of about $0.13 and the $0.01 minimum trading activity fee, about $1.16. The round trip is about $2.17, or 0.035%. Next to a ±$140 typical day on that position, the fee is a rounding error. The size is what decides the outcome.
My take
I read the VIX as a sizing input, not as a buy or sell signal. History says a first close above 35 usually fades within a few weeks, and that the month after is usually calmer than options priced. But the four times it was not calmer are exactly the ones that hurt, so I size for the exception rather than the median.
What I actually do in a week like this:
Recalculate each position's typical daily swing in dollars with VIX ÷ √252, not in percent.If that number is bigger than I can accept, cut the size now instead of waiting for a bounce.Leave margin alone while the VIX is above 30. BiyaPay allows up to 4x buying power on stocks, but 4x on a 2.26% day is a 9% day.Do not hold a VIX futures ETF as a long-term hedge. The last year showed what the roll does to it.Use limit orders around the open, because after-hours prices can gap away from the last close.
A VIX of 35.89 does not say whether the low is in. It says how wide the road is, and that is enough to decide how fast to drive.
Source: CNBC, "Stock market news for Nov. 20, 2026" (20 Nov 2026); AP, "S&P 500 sinks 3.7% and the Nasdaq composite goes negative for the year" (20 Nov 2026); Cboe, VIX Index overview and trade data as of 20 Nov 2026; Yahoo Finance daily closes for ^VIX (Jan 1990 to 20 Nov 2026), ^VIX3M (Jul 2006 to 20 Nov 2026), ^GSPC, VIXY and SPY (checked 21 Nov 2026). Episode counts, realised volatility, sizing and fee arithmetic are my own calculations.
#BiyaPay #VIX #SP500 #Volatility #StockMarket
335

·
--
Bullish
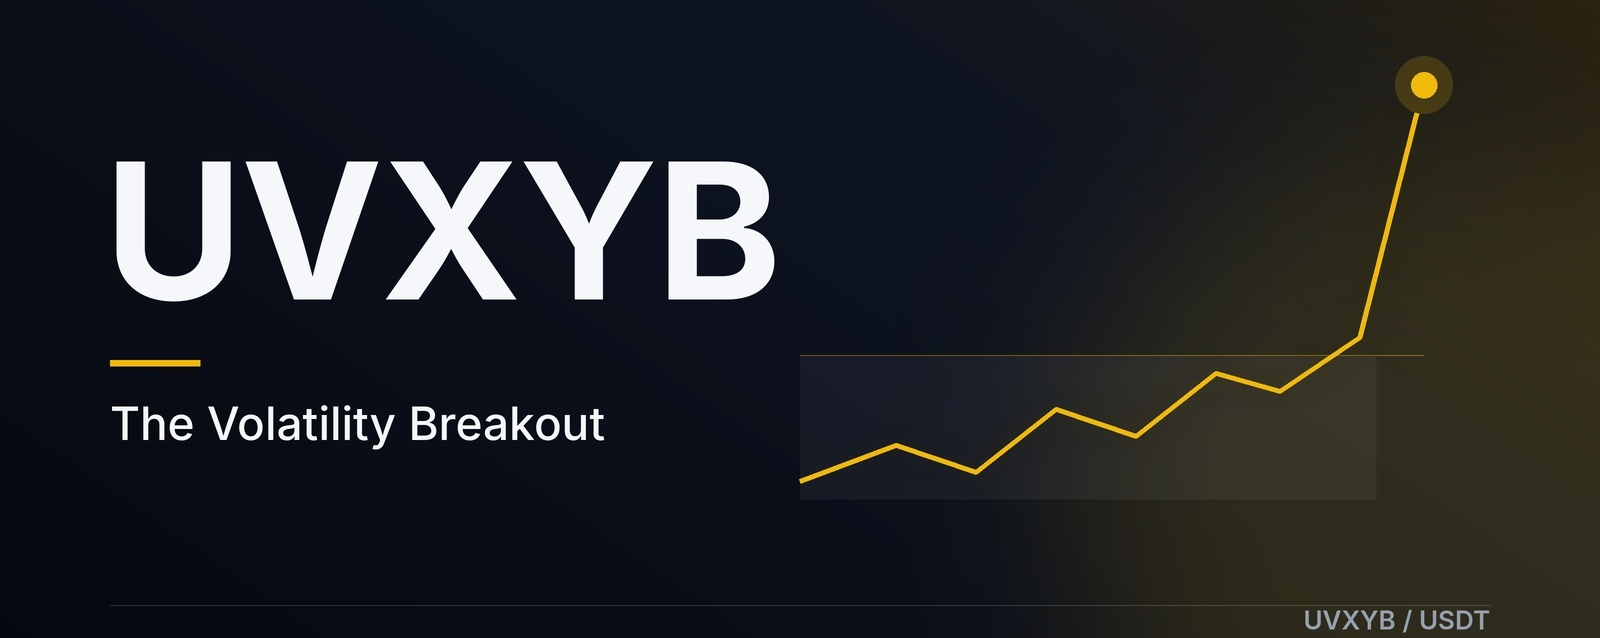
⚡ UVXYB: A Different Kind of Opportunity in the Crypto Market!
Not every interesting asset in the crypto market is a traditional cryptocurrency.
Today, I want to highlight UVXYB, a tokenized bStock connected to the ProShares Ultra VIX Short-Term Futures ETF.
What makes UVXYB different?
🔹 Market Volatility: It provides exposure to a product designed around short-term market volatility.
🔹 Tokenized Asset: It brings traditional financial market exposure into Binance's bStocks ecosystem.
🔹 Spot Trading: UVXYB is available through the Binance Spot market, subject to regional eligibility.
🔹 A Different Strategy: Unlike ordinary crypto tokens, its performance is linked to volatility futures rather than the usual crypto market narrative.
⚠️ Important Risk: UVXYB is linked to a leveraged volatility ETF. Its value can change sharply, and holding it over time can involve significant losses due to futures structure and daily leverage effects.
I believe understanding an asset is more important than simply following its price movement.
What do you think about tokenized assets like $UVXYB? Could they become an important part of the future financial market?
#UVXYB #TokenizedAssets #Crypto #VIX #Trading
$UVXYB
{spot}(UVXYBUSDT)
$UVXY
$BYD
{future}(BYDUSDT)
⚡ UVXYB: A Different Kind of Opportunity in the Crypto Market!
Not every interesting asset in the crypto market is a traditional cryptocurrency.
Today, I want to highlight UVXYB, a tokenized bStock connected to the ProShares Ultra VIX Short-Term Futures ETF.
What makes UVXYB different?
🔹 Market Volatility: It provides exposure to a product designed around short-term market volatility.
🔹 Tokenized Asset: It brings traditional financial market exposure into Binance's bStocks ecosystem.
🔹 Spot Trading: UVXYB is available through the Binance Spot market, subject to regional eligibility.
🔹 A Different Strategy: Unlike ordinary crypto tokens, its performance is linked to volatility futures rather than the usual crypto market narrative.
⚠️ Important Risk: UVXYB is linked to a leveraged volatility ETF. Its value can change sharply, and holding it over time can involve significant losses due to futures structure and daily leverage effects.
I believe understanding an asset is more important than simply following its price movement.
What do you think about tokenized assets like $UVXYB ? Could they become an important part of the future financial market?
#UVXYB #TokenizedAssets #Crypto #VIX #Trading
$UVXYB
$UVXY
$BYD
Not every interesting asset in the crypto market is a traditional cryptocurrency.
Today, I want to highlight UVXYB, a tokenized bStock connected to the ProShares Ultra VIX Short-Term Futures ETF.
What makes UVXYB different?
🔹 Market Volatility: It provides exposure to a product designed around short-term market volatility.
🔹 Tokenized Asset: It brings traditional financial market exposure into Binance's bStocks ecosystem.
🔹 Spot Trading: UVXYB is available through the Binance Spot market, subject to regional eligibility.
🔹 A Different Strategy: Unlike ordinary crypto tokens, its performance is linked to volatility futures rather than the usual crypto market narrative.
⚠️ Important Risk: UVXYB is linked to a leveraged volatility ETF. Its value can change sharply, and holding it over time can involve significant losses due to futures structure and daily leverage effects.
I believe understanding an asset is more important than simply following its price movement.
What do you think about tokenized assets like $UVXYB ? Could they become an important part of the future financial market?
#UVXYB #TokenizedAssets #Crypto #VIX #Trading
$UVXYB
$UVXY
$BYD

1
228

·
--
Article
🚨 UVXYB: The "Fear Index" Token Just Broke Out. Should You Panic?📉 First, what is UVXYB?
$UVXYB is a bStock on Binance: a BEP-20 token on BNB Smart Chain that tracks the ProShares Ultra VIX Short-Term Futures ETF (UVXY).
🔹 Backed 1:1 by ETF shares held with a regulated custodian
🔹 Listed on Binance Spot (UVXYB/USDT) on October 14, 2026
🔹 The first leveraged ETF product in Binance's bStocks lineup
🔹 Tracks the underlying ETF price, no staking, no inflation
In plain English: it's a bet on market fear. When Wall Street gets nervous, the VIX spikes and UVXYB tends to jump. When things calm down, it usually bleeds. Think of it as a smoke detector: very useful, but you don't want it ringing all day. 🔥
⚠️ Important: this is NOT a normal stock token. UVXY uses daily leverage and suffers from contango decay, so it is structurally built to lose value over time. It has even needed reverse splits to keep its price afloat. Treat it as a trading tool, not a long-term hold.
📊 TECHNICAL ANALYSIS (price ≈ 25.80 USDT, +19%)
🗓 Daily (1D)
🔹 Range between ~15.7 and ~24 since the listing
🔹 Today: a big green breakout candle, new high at 25.89
🔹 RSI at 67.9: strong, but not extreme yet
🔹 Volume still below its average, but the day isn't over
⏱ 4-Hour (4H)
🔹 All EMAs are bullish and perfectly stacked (9 > 21 > 50 > 100 > 200)
🔹 RSI at 72.8, OBV at its highs: buyers are in control
🔹 The old 16 to 24 range was broken in basically one candle 🚀
🕐 1-Hour (1H)
👀 The "easy there, champ" timeframe
🔹 RSI at 82.4: clearly overbought
🔹 Price sits ~8% above the EMA 9 (23.91)
🔹 The last candle is near vertical on very thin volume: it looks more like a liquidity spike than steady accumulation
🎯 KEY LEVELS
🔹 Resistance: 25.89, then 26.36 to 26.40
🔹 Supports: 23.9 (EMA 9 1H), 22.7 (EMA 9 4H), 21.5 to 21.7 (EMA 21/50)
🔹 Bullish structure invalidated below ~20.2 (EMA 200 1H)
🧭 SCENARIOS
🔹 Most likely short term: a pullback toward 23.9 to 22.7 to cool the overbought RSI. Healthy, not scary.
🔹 Bullish continuation: a successful retest of the 24 to 25 zone with real volume could open the path to 26.4.
🧠 THE REAL DRIVER
Don't just stare at the chart. UVXYB follows the VIX, so watch Wall Street's mood. When equities wobble, this token wakes up. When markets relax, gravity usually wins. 🍿
💬 Are you trading the fear, or fading it?
⚠️ Not financial advice. Leveraged volatility products are high risk. Always DYOR and manage your risk.
#UVXYB #bStocks #VIX
🚨 UVXYB: The "Fear Index" Token Just Broke Out. Should You Panic?
📉 First, what is UVXYB?
$UVXYB is a bStock on Binance: a BEP-20 token on BNB Smart Chain that tracks the ProShares Ultra VIX Short-Term Futures ETF (UVXY).
🔹 Backed 1:1 by ETF shares held with a regulated custodian
🔹 Listed on Binance Spot (UVXYB/USDT) on October 14, 2026
🔹 The first leveraged ETF product in Binance's bStocks lineup
🔹 Tracks the underlying ETF price, no staking, no inflation
In plain English: it's a bet on market fear. When Wall Street gets nervous, the VIX spikes and UVXYB tends to jump. When things calm down, it usually bleeds. Think of it as a smoke detector: very useful, but you don't want it ringing all day. 🔥
⚠️ Important: this is NOT a normal stock token. UVXY uses daily leverage and suffers from contango decay, so it is structurally built to lose value over time. It has even needed reverse splits to keep its price afloat. Treat it as a trading tool, not a long-term hold.
📊 TECHNICAL ANALYSIS (price ≈ 25.80 USDT, +19%)
🗓 Daily (1D)
🔹 Range between ~15.7 and ~24 since the listing
🔹 Today: a big green breakout candle, new high at 25.89
🔹 RSI at 67.9: strong, but not extreme yet
🔹 Volume still below its average, but the day isn't over
⏱ 4-Hour (4H)
🔹 All EMAs are bullish and perfectly stacked (9 > 21 > 50 > 100 > 200)
🔹 RSI at 72.8, OBV at its highs: buyers are in control
🔹 The old 16 to 24 range was broken in basically one candle 🚀
🕐 1-Hour (1H)
👀 The "easy there, champ" timeframe
🔹 RSI at 82.4: clearly overbought
🔹 Price sits ~8% above the EMA 9 (23.91)
🔹 The last candle is near vertical on very thin volume: it looks more like a liquidity spike than steady accumulation
🎯 KEY LEVELS
🔹 Resistance: 25.89, then 26.36 to 26.40
🔹 Supports: 23.9 (EMA 9 1H), 22.7 (EMA 9 4H), 21.5 to 21.7 (EMA 21/50)
🔹 Bullish structure invalidated below ~20.2 (EMA 200 1H)
🧭 SCENARIOS
🔹 Most likely short term: a pullback toward 23.9 to 22.7 to cool the overbought RSI. Healthy, not scary.
🔹 Bullish continuation: a successful retest of the 24 to 25 zone with real volume could open the path to 26.4.
🧠 THE REAL DRIVER
Don't just stare at the chart. UVXYB follows the VIX, so watch Wall Street's mood. When equities wobble, this token wakes up. When markets relax, gravity usually wins. 🍿
💬 Are you trading the fear, or fading it?
⚠️ Not financial advice. Leveraged volatility products are high risk. Always DYOR and manage your risk.
#UVXYB #bStocks #VIX
$UVXYB is a bStock on Binance: a BEP-20 token on BNB Smart Chain that tracks the ProShares Ultra VIX Short-Term Futures ETF (UVXY).
🔹 Backed 1:1 by ETF shares held with a regulated custodian
🔹 Listed on Binance Spot (UVXYB/USDT) on October 14, 2026
🔹 The first leveraged ETF product in Binance's bStocks lineup
🔹 Tracks the underlying ETF price, no staking, no inflation
In plain English: it's a bet on market fear. When Wall Street gets nervous, the VIX spikes and UVXYB tends to jump. When things calm down, it usually bleeds. Think of it as a smoke detector: very useful, but you don't want it ringing all day. 🔥
⚠️ Important: this is NOT a normal stock token. UVXY uses daily leverage and suffers from contango decay, so it is structurally built to lose value over time. It has even needed reverse splits to keep its price afloat. Treat it as a trading tool, not a long-term hold.
📊 TECHNICAL ANALYSIS (price ≈ 25.80 USDT, +19%)
🗓 Daily (1D)
🔹 Range between ~15.7 and ~24 since the listing
🔹 Today: a big green breakout candle, new high at 25.89
🔹 RSI at 67.9: strong, but not extreme yet
🔹 Volume still below its average, but the day isn't over
⏱ 4-Hour (4H)
🔹 All EMAs are bullish and perfectly stacked (9 > 21 > 50 > 100 > 200)
🔹 RSI at 72.8, OBV at its highs: buyers are in control
🔹 The old 16 to 24 range was broken in basically one candle 🚀
🕐 1-Hour (1H)
👀 The "easy there, champ" timeframe
🔹 RSI at 82.4: clearly overbought
🔹 Price sits ~8% above the EMA 9 (23.91)
🔹 The last candle is near vertical on very thin volume: it looks more like a liquidity spike than steady accumulation
🎯 KEY LEVELS
🔹 Resistance: 25.89, then 26.36 to 26.40
🔹 Supports: 23.9 (EMA 9 1H), 22.7 (EMA 9 4H), 21.5 to 21.7 (EMA 21/50)
🔹 Bullish structure invalidated below ~20.2 (EMA 200 1H)
🧭 SCENARIOS
🔹 Most likely short term: a pullback toward 23.9 to 22.7 to cool the overbought RSI. Healthy, not scary.
🔹 Bullish continuation: a successful retest of the 24 to 25 zone with real volume could open the path to 26.4.
🧠 THE REAL DRIVER
Don't just stare at the chart. UVXYB follows the VIX, so watch Wall Street's mood. When equities wobble, this token wakes up. When markets relax, gravity usually wins. 🍿
💬 Are you trading the fear, or fading it?
⚠️ Not financial advice. Leveraged volatility products are high risk. Always DYOR and manage your risk.
#UVXYB #bStocks #VIX
170

·
--
Verified
The VIX closed at 35.9 on Friday, compared with just 17.5 on November 11.
In seven trading days, the fear index more than doubled. Over the same period, the S&P fell from 7619 to 6910, down a little over 9%. Fuck, the index is the S&P, and it lost nearly a tenth in just over a week.
Honestly, when the VIX climbs above 35, historically it often means we're not far from a near-term bottom. But “not far” could mean three days or three weeks—and plenty of times there's another leg down in between. This number can only tell us that people are scared; it can't tell us who's willing to step in.
U.S. markets are closed for the weekend, but BTC has already bounced back above 60,000. It's now at 60421, still down 1.7% over the past 24 hours. Until U.S. markets open on Monday, crypto is the only risk appetite thermometer worth watching these next couple of days.
If the VIX is still above 30 on Monday, don't read too much into this weekend's bounce just yet.
#美股 #VIX #比特币 $BTC
The VIX closed at 35.9 on Friday, compared with just 17.5 on November 11.
In seven trading days, the fear index more than doubled. Over the same period, the S&P fell from 7619 to 6910, down a little over 9%. Fuck, the index is the S&P, and it lost nearly a tenth in just over a week.
Honestly, when the VIX climbs above 35, historically it often means we're not far from a near-term bottom. But “not far” could mean three days or three weeks—and plenty of times there's another leg down in between. This number can only tell us that people are scared; it can't tell us who's willing to step in.
U.S. markets are closed for the weekend, but BTC has already bounced back above 60,000. It's now at 60421, still down 1.7% over the past 24 hours. Until U.S. markets open on Monday, crypto is the only risk appetite thermometer worth watching these next couple of days.
If the VIX is still above 30 on Monday, don't read too much into this weekend's bounce just yet.
#美股 #VIX #比特币 $BTC
In seven trading days, the fear index more than doubled. Over the same period, the S&P fell from 7619 to 6910, down a little over 9%. Fuck, the index is the S&P, and it lost nearly a tenth in just over a week.
Honestly, when the VIX climbs above 35, historically it often means we're not far from a near-term bottom. But “not far” could mean three days or three weeks—and plenty of times there's another leg down in between. This number can only tell us that people are scared; it can't tell us who's willing to step in.
U.S. markets are closed for the weekend, but BTC has already bounced back above 60,000. It's now at 60421, still down 1.7% over the past 24 hours. Until U.S. markets open on Monday, crypto is the only risk appetite thermometer worth watching these next couple of days.
If the VIX is still above 30 on Monday, don't read too much into this weekend's bounce just yet.
#美股 #VIX #比特币 $BTC
558

·
--
🎯 Fear index hits an extreme; tech stocks are draining liquidity
📰 Goldman Sachs traders warn that the fear index is nearing extreme levels. The Nasdaq fell 5.28% in a single day, is down 20% from its peak, and Nvidia has lost 47% of its value in a month.
💬 Don’t just watch the candlesticks—the pump is next door. When tech stocks crash, BTC becomes an ATM, faring even worse than gold. With outside markets unstable, crypto can’t save itself. First, watch their mood.
🏷️#VIX #纳指 #风险资产 #CrossMarket
🎯 Fear index hits an extreme; tech stocks are draining liquidity
📰 Goldman Sachs traders warn that the fear index is nearing extreme levels. The Nasdaq fell 5.28% in a single day, is down 20% from its peak, and Nvidia has lost 47% of its value in a month.
💬 Don’t just watch the candlesticks—the pump is next door. When tech stocks crash, BTC becomes an ATM, faring even worse than gold. With outside markets unstable, crypto can’t save itself. First, watch their mood.
🏷️#VIX #纳指 #风险资产 #CrossMarket
📰 Goldman Sachs traders warn that the fear index is nearing extreme levels. The Nasdaq fell 5.28% in a single day, is down 20% from its peak, and Nvidia has lost 47% of its value in a month.
💬 Don’t just watch the candlesticks—the pump is next door. When tech stocks crash, BTC becomes an ATM, faring even worse than gold. With outside markets unstable, crypto can’t save itself. First, watch their mood.
🏷️#VIX #纳指 #风险资产 #CrossMarket
312

·
--
Bullish
🚨🔥 $UVXY sets off the fear alarm on Wall Street! Is a new market storm approaching?
The $UVXY fund is back in the trading spotlight with a notable jump during November sessions, signaling growing concern about volatility and risks in U.S. markets.
📊 What’s happening now?
- Closed near $27.75 on November 20.
- Daily gains of around 9.17%.
- Session high: $27.92.
- Trading volume exceeded 10.6 million shares.
- The fund has posted consecutive gains over the past several sessions.
🔥 Analysis and what may come next:
🐂 A breakout above $27.92 and holding there could strengthen bullish momentum and open the way to test higher levels.
🐻 A drop back below $25.42, on the other hand, could signal weakening momentum and the possibility of a price correction.
🐋 Why are investors watching UVXY?
Because its movements are linked to VIX futures contracts. It is used to gain exposure to U.S. market volatility and may benefit from rising fear and market turmoil.
.
Are U.S. markets preparing for another surge in volatility? Or is UVXY’s rise just a temporary wave?
$UVXY
{future}(UVXYUSDT)
#UVXY #VIX #WallStreet #Trading
🚨🔥 $UVXY sets off the fear alarm on Wall Street! Is a new market storm approaching?
The $UVXY fund is back in the trading spotlight with a notable jump during November sessions, signaling growing concern about volatility and risks in U.S. markets.
📊 What’s happening now?
- Closed near $27.75 on November 20.
- Daily gains of around 9.17%.
- Session high: $27.92.
- Trading volume exceeded 10.6 million shares.
- The fund has posted consecutive gains over the past several sessions.
🔥 Analysis and what may come next:
🐂 A breakout above $27.92 and holding there could strengthen bullish momentum and open the way to test higher levels.
🐻 A drop back below $25.42, on the other hand, could signal weakening momentum and the possibility of a price correction.
🐋 Why are investors watching UVXY?
Because its movements are linked to VIX futures contracts. It is used to gain exposure to U.S. market volatility and may benefit from rising fear and market turmoil.
.
Are U.S. markets preparing for another surge in volatility? Or is UVXY’s rise just a temporary wave?
$UVXY
#UVXY #VIX #WallStreet #Trading
The $UVXY fund is back in the trading spotlight with a notable jump during November sessions, signaling growing concern about volatility and risks in U.S. markets.
📊 What’s happening now?
- Closed near $27.75 on November 20.
- Daily gains of around 9.17%.
- Session high: $27.92.
- Trading volume exceeded 10.6 million shares.
- The fund has posted consecutive gains over the past several sessions.
🔥 Analysis and what may come next:
🐂 A breakout above $27.92 and holding there could strengthen bullish momentum and open the way to test higher levels.
🐻 A drop back below $25.42, on the other hand, could signal weakening momentum and the possibility of a price correction.
🐋 Why are investors watching UVXY?
Because its movements are linked to VIX futures contracts. It is used to gain exposure to U.S. market volatility and may benefit from rising fear and market turmoil.
.
Are U.S. markets preparing for another surge in volatility? Or is UVXY’s rise just a temporary wave?
$UVXY
#UVXY #VIX #WallStreet #Trading
1
138

·
--
All assets fell together today — and fear gauges across the board surged to their highest levels in months.
Key figures:
• VIX (S&P 500): 29.50 — briefly touched 30.04, its highest since March 30; up 52% this month and 81% this quarter (Reuters + CoinDesk, Nov 20)
• Bitcoin volatility (BVOL/Volmex): 52.2 — up 23% this month and 40% this quarter, its highest since the early-June crash (CoinDesk/Volmex, Nov 20)
• Gold volatility: 28.7 — up 10% this month and 21% this quarter (CoinDesk/Volmex, Nov 20)
My take: this isn’t a rotation — stocks, BTC, and gold are all being sold at the same time as demand for protection surges across all three. BTC itself briefly touched 62,158 tonight before returning to 61,582. But remember the limits: volatility measures the expected size of swings, not their direction — high volatility can precede either further declines or a sharp rebound.
What I’m watching next: tonight’s U.S. session close and whether the VIX holds above 28 or starts to ease, plus whether BTC’s weekly close is above or below 62,000.
Do you think this simultaneous volatility spike looks more like a sign of capitulation, or the start of even bigger swings?
Not financial advice — always DYOR.
#VIX #Volatilitas $BTC
All assets fell together today — and fear gauges across the board surged to their highest levels in months.
Key figures:
• VIX (S&P 500): 29.50 — briefly touched 30.04, its highest since March 30; up 52% this month and 81% this quarter (Reuters + CoinDesk, Nov 20)
• Bitcoin volatility (BVOL/Volmex): 52.2 — up 23% this month and 40% this quarter, its highest since the early-June crash (CoinDesk/Volmex, Nov 20)
• Gold volatility: 28.7 — up 10% this month and 21% this quarter (CoinDesk/Volmex, Nov 20)
My take: this isn’t a rotation — stocks, BTC, and gold are all being sold at the same time as demand for protection surges across all three. BTC itself briefly touched 62,158 tonight before returning to 61,582. But remember the limits: volatility measures the expected size of swings, not their direction — high volatility can precede either further declines or a sharp rebound.
What I’m watching next: tonight’s U.S. session close and whether the VIX holds above 28 or starts to ease, plus whether BTC’s weekly close is above or below 62,000.
Do you think this simultaneous volatility spike looks more like a sign of capitulation, or the start of even bigger swings?
Not financial advice — always DYOR.
#VIX #Volatilitas $BTC
Key figures:
• VIX (S&P 500): 29.50 — briefly touched 30.04, its highest since March 30; up 52% this month and 81% this quarter (Reuters + CoinDesk, Nov 20)
• Bitcoin volatility (BVOL/Volmex): 52.2 — up 23% this month and 40% this quarter, its highest since the early-June crash (CoinDesk/Volmex, Nov 20)
• Gold volatility: 28.7 — up 10% this month and 21% this quarter (CoinDesk/Volmex, Nov 20)
My take: this isn’t a rotation — stocks, BTC, and gold are all being sold at the same time as demand for protection surges across all three. BTC itself briefly touched 62,158 tonight before returning to 61,582. But remember the limits: volatility measures the expected size of swings, not their direction — high volatility can precede either further declines or a sharp rebound.
What I’m watching next: tonight’s U.S. session close and whether the VIX holds above 28 or starts to ease, plus whether BTC’s weekly close is above or below 62,000.
Do you think this simultaneous volatility spike looks more like a sign of capitulation, or the start of even bigger swings?
Not financial advice — always DYOR.
#VIX #Volatilitas $BTC
48

·
--
The U.S. stock market’s VIX is up 52% this month, reaching 29.5, while the Fear Index is still stuck at 12—and things aren’t exactly calm over here either: $BTC .
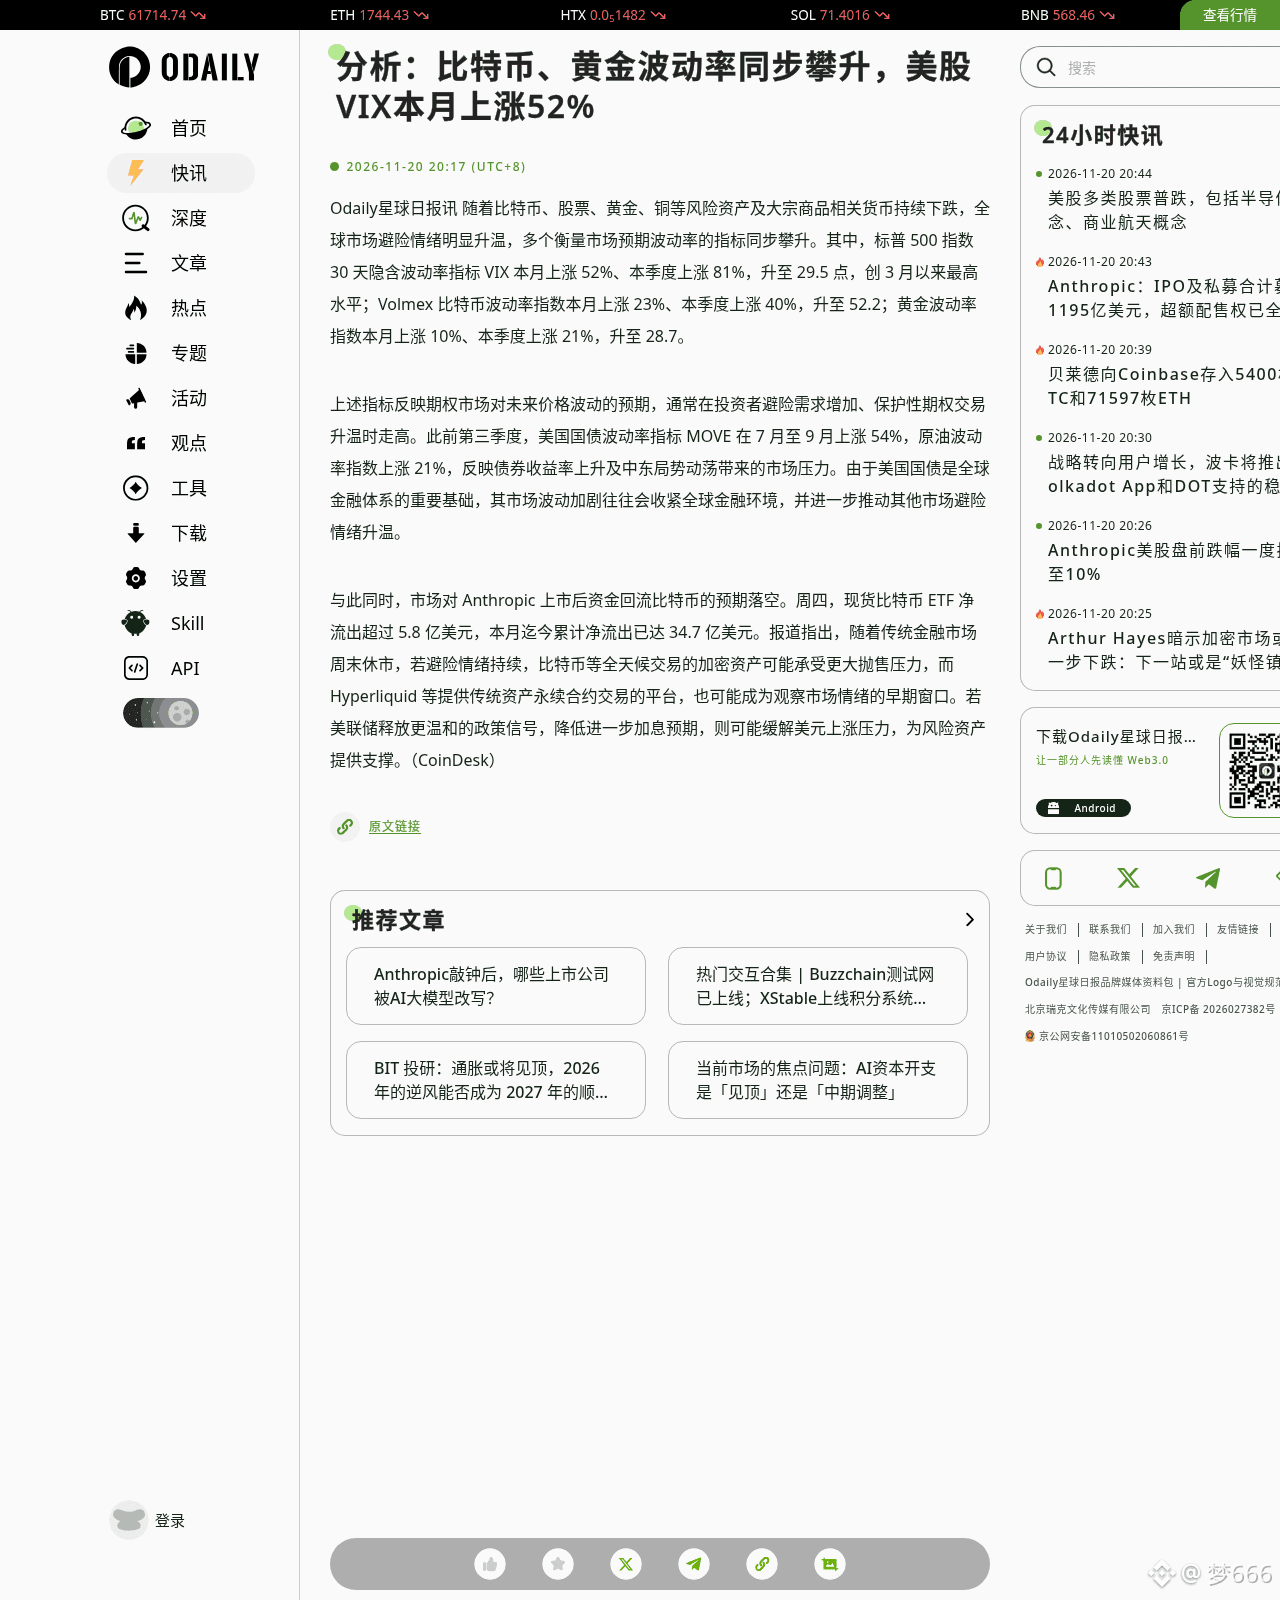
Odaily, citing CoinDesk: The S&P 500’s VIX is up 52% this month and 81% this quarter, hitting its highest level since March. The Volmex Bitcoin Volatility Index is up 23% this month to 52.2, and gold volatility is also rising. The same article says spot Bitcoin ETFs saw net outflows of more than $580 million on Thursday, bringing November’s total to $3.47 billion. Arthur Hayes dropped this line tonight: “Next stop, Freak Town. Everybody buckle up.” I’m only going to trim my positions a little more—I’m not buying the so-called dip. Are you all still sleeping soundly?
$ETH $SOL #恐慌指数 #VIX #比特币 #Market Sentiment
The U.S. stock market’s VIX is up 52% this month, reaching 29.5, while the Fear Index is still stuck at 12—and things aren’t exactly calm over here either: $BTC .
Odaily, citing CoinDesk: The S&P 500’s VIX is up 52% this month and 81% this quarter, hitting its highest level since March. The Volmex Bitcoin Volatility Index is up 23% this month to 52.2, and gold volatility is also rising. The same article says spot Bitcoin ETFs saw net outflows of more than $580 million on Thursday, bringing November’s total to $3.47 billion. Arthur Hayes dropped this line tonight: “Next stop, Freak Town. Everybody buckle up.” I’m only going to trim my positions a little more—I’m not buying the so-called dip. Are you all still sleeping soundly?
$ETH $SOL #恐慌指数 #VIX #比特币 #Market Sentiment
Odaily, citing CoinDesk: The S&P 500’s VIX is up 52% this month and 81% this quarter, hitting its highest level since March. The Volmex Bitcoin Volatility Index is up 23% this month to 52.2, and gold volatility is also rising. The same article says spot Bitcoin ETFs saw net outflows of more than $580 million on Thursday, bringing November’s total to $3.47 billion. Arthur Hayes dropped this line tonight: “Next stop, Freak Town. Everybody buckle up.” I’m only going to trim my positions a little more—I’m not buying the so-called dip. Are you all still sleeping soundly?
$ETH $SOL #恐慌指数 #VIX #比特币 #Market Sentiment
395

·
--
Fear gauge VIX hits its highest level since March
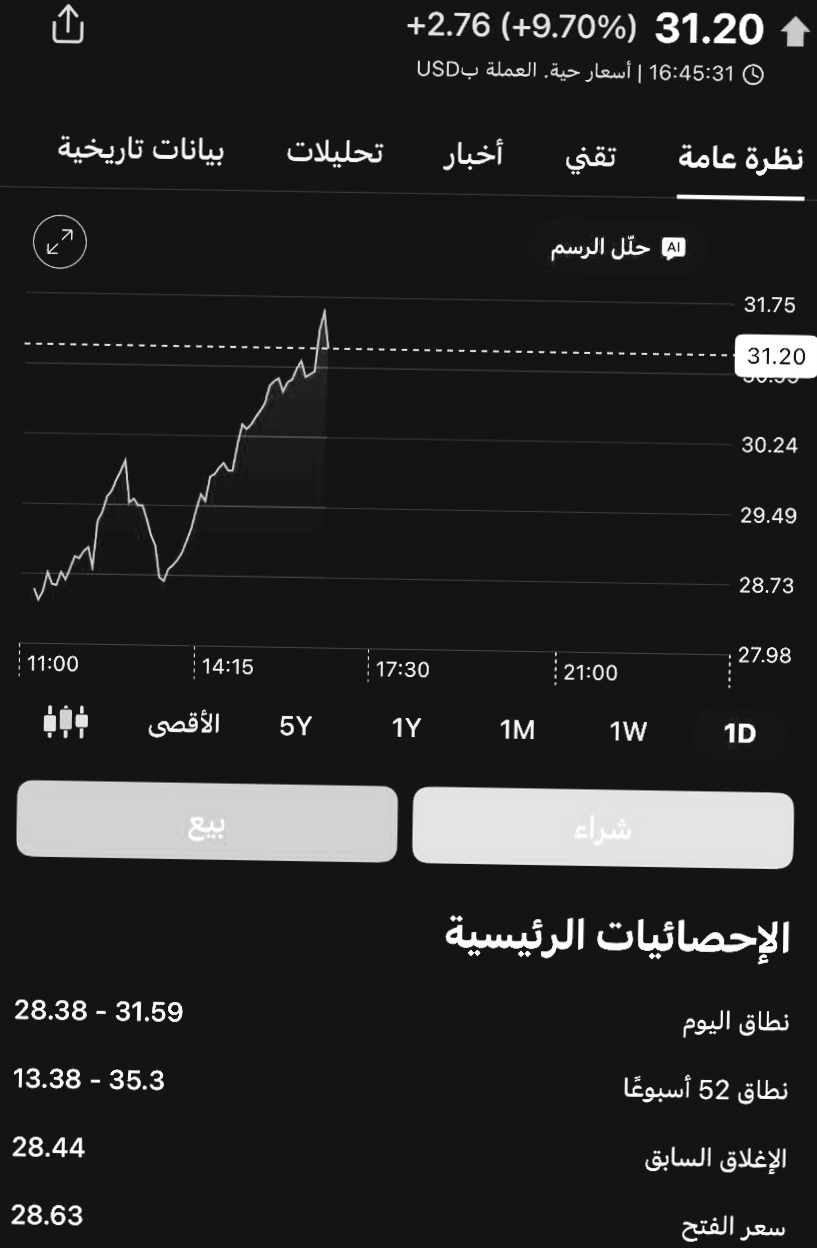
The CBOE VIX volatility index rose to 30.99 points on Friday morning,
surpassing 30 as selling pressure on U.S. stock futures intensified.
This comes amid ongoing concerns about the artificial intelligence sector
#VIX #BinanceSquare #تقلبات #السوق_الهابطة
Fear gauge VIX hits its highest level since March
The CBOE VIX volatility index rose to 30.99 points on Friday morning,
surpassing 30 as selling pressure on U.S. stock futures intensified.
This comes amid ongoing concerns about the artificial intelligence sector
#VIX #BinanceSquare #تقلبات #السوق_الهابطة
The CBOE VIX volatility index rose to 30.99 points on Friday morning,
surpassing 30 as selling pressure on U.S. stock futures intensified.
This comes amid ongoing concerns about the artificial intelligence sector
#VIX #BinanceSquare #تقلبات #السوق_الهابطة
2
182

·
--
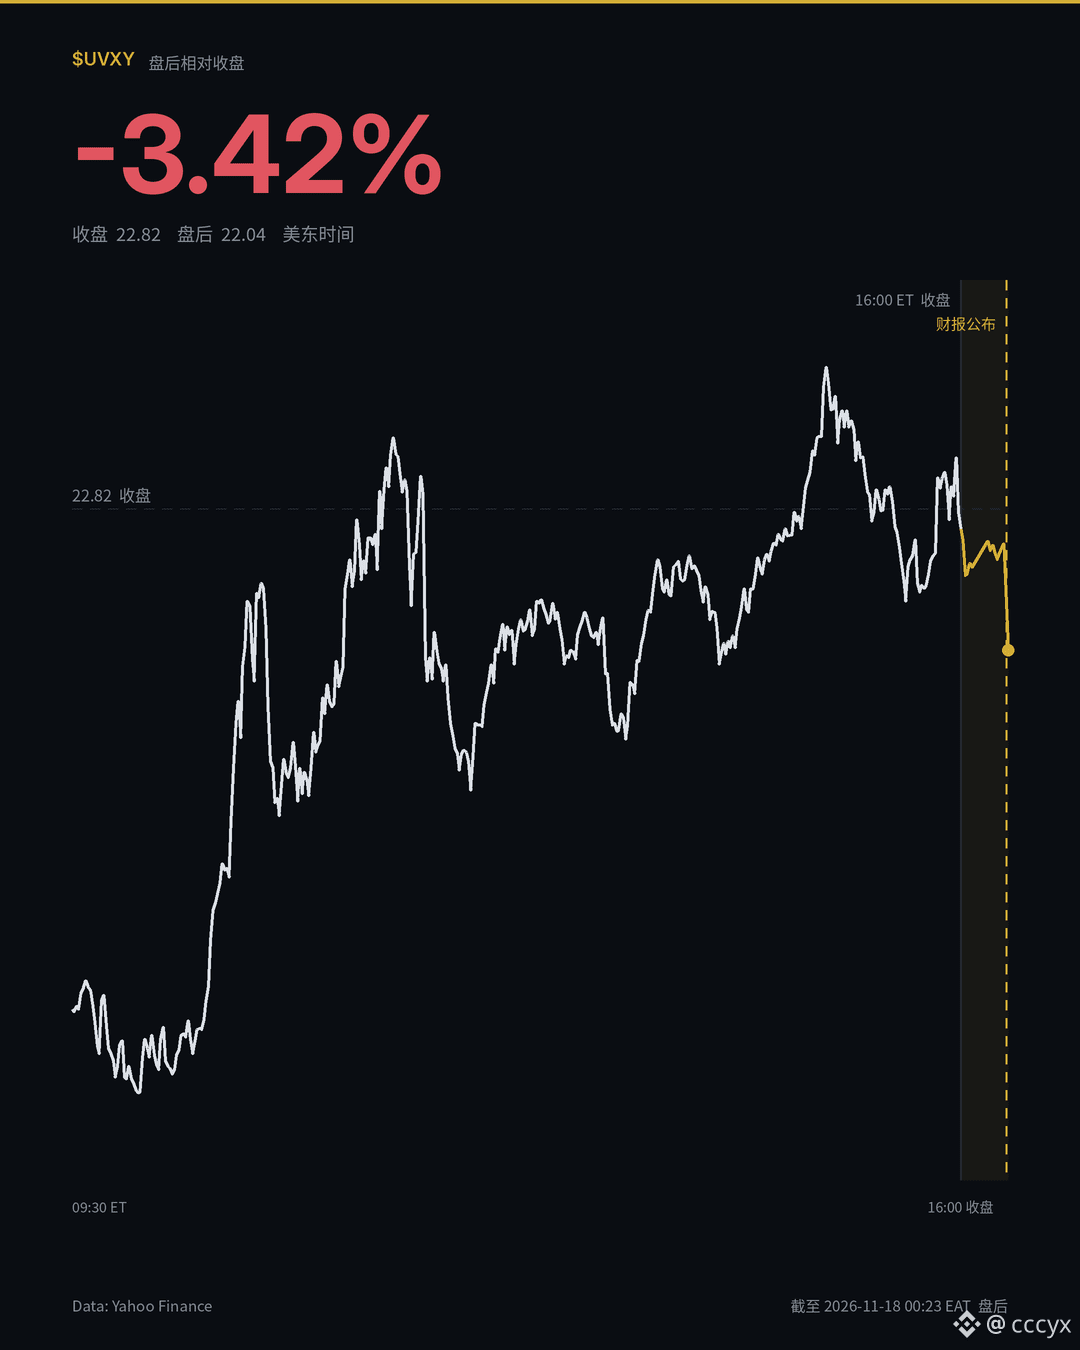
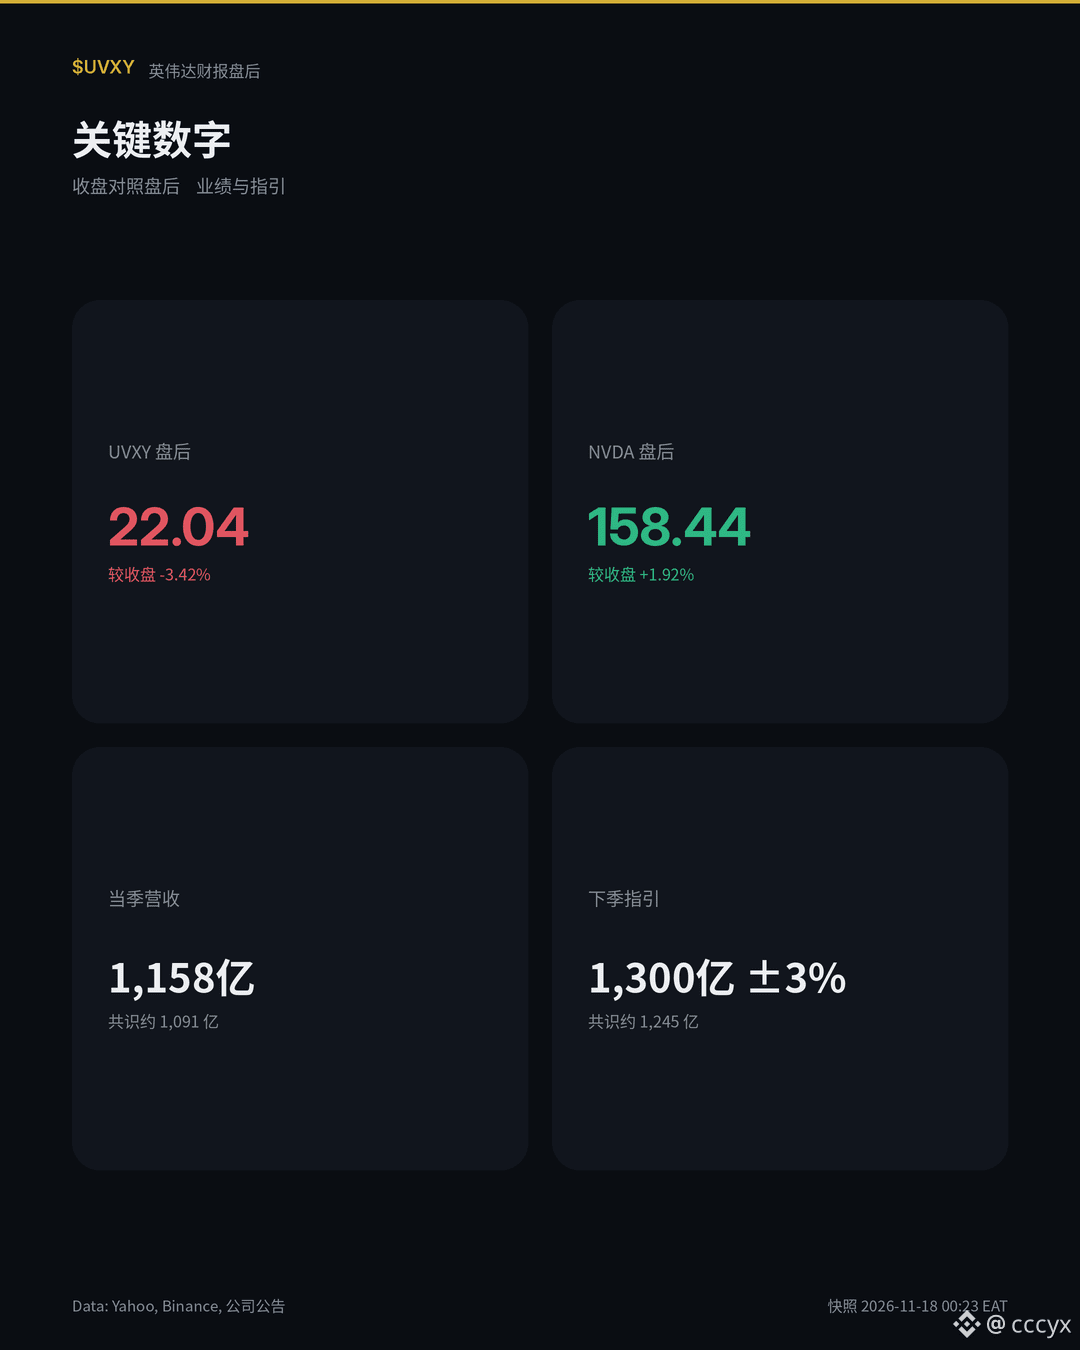
UVXY fell 3.4% after hours; Nvidia revenue and guidance both beat expectations
UVXY after hours 22.04 | vs. close -3.42% | NVDA after hours 158.44 | vs. close +1.92%
Earnings: Quarterly revenue was $115.8 billion, above the consensus estimate of about $109.1 billion and exceeding the upper end of the company’s original guidance of $108.0 billion ±2%. Non-GAAP earnings per share were $2.68, above expectations of $2.47. Data center revenue was $107.6 billion. Guidance for next quarter is $130.0 billion ±3%, above the market estimate of about $124.5 billion.
Volatility: UVXY is a 1.5x short-term VIX futures product. It initially rose 11.6% intraday. After the earnings release, event-driven volatility subsided. The latest after-hours trade was 22.04, down 3.4% from the closing price of 22.82; Binance’s $UVXYB is currently at 22.32. $NVDAB briefly surged about 3.9% before retreating.
Outlook: If the market views the guidance as confirmation of demand, UVXY may continue trading below 22.82. However, the gross margin outlook for next quarter has been lowered to 71%–72%, and the guidance does not include data center computing revenue from China, so volatility could still rise.
$UVXYB $NVDAB #UVXY #英伟达财报 #VIX
UVXY fell 3.4% after hours; Nvidia revenue and guidance both beat expectations
UVXY after hours 22.04 | vs. close -3.42% | NVDA after hours 158.44 | vs. close +1.92%
Earnings: Quarterly revenue was $115.8 billion, above the consensus estimate of about $109.1 billion and exceeding the upper end of the company’s original guidance of $108.0 billion ±2%. Non-GAAP earnings per share were $2.68, above expectations of $2.47. Data center revenue was $107.6 billion. Guidance for next quarter is $130.0 billion ±3%, above the market estimate of about $124.5 billion.
Volatility: UVXY is a 1.5x short-term VIX futures product. It initially rose 11.6% intraday. After the earnings release, event-driven volatility subsided. The latest after-hours trade was 22.04, down 3.4% from the closing price of 22.82; Binance’s $UVXYB is currently at 22.32. $NVDAB briefly surged about 3.9% before retreating.
Outlook: If the market views the guidance as confirmation of demand, UVXY may continue trading below 22.82. However, the gross margin outlook for next quarter has been lowered to 71%–72%, and the guidance does not include data center computing revenue from China, so volatility could still rise.
$UVXYB $NVDAB #UVXY #英伟达财报 #VIX
UVXY after hours 22.04 | vs. close -3.42% | NVDA after hours 158.44 | vs. close +1.92%
Earnings: Quarterly revenue was $115.8 billion, above the consensus estimate of about $109.1 billion and exceeding the upper end of the company’s original guidance of $108.0 billion ±2%. Non-GAAP earnings per share were $2.68, above expectations of $2.47. Data center revenue was $107.6 billion. Guidance for next quarter is $130.0 billion ±3%, above the market estimate of about $124.5 billion.
Volatility: UVXY is a 1.5x short-term VIX futures product. It initially rose 11.6% intraday. After the earnings release, event-driven volatility subsided. The latest after-hours trade was 22.04, down 3.4% from the closing price of 22.82; Binance’s $UVXYB is currently at 22.32. $NVDAB briefly surged about 3.9% before retreating.
Outlook: If the market views the guidance as confirmation of demand, UVXY may continue trading below 22.82. However, the gross margin outlook for next quarter has been lowered to 71%–72%, and the guidance does not include data center computing revenue from China, so volatility could still rise.
$UVXYB $NVDAB #UVXY #英伟达财报 #VIX
194


·
--
UVXY market volatility is picking up again! The tokenized Fear Index ETF (UVXY) surged 10.5% to above $21.3!
The tokenized Fear Index ETF (UVXY) rose 10.55% today to $21.37!
Mapping-driven move: Volatility expectations in overseas markets heated up overnight, strengthening VIX-related volatility assets and mechanically lifting UVXY in tandem with its underlying stock.
Conclusion: A traditional financial volatility derivative whose price is 100% tied to the US stock market’s VIX Fear Index. Not a crypto-native protocol; suitable for short-term intraday volatility hedging, with no positions held overnight.
#UVXY #VIX
$UVXY
{future}(UVXYUSDT)
UVXY market volatility is picking up again! The tokenized Fear Index ETF (UVXY) surged 10.5% to above $21.3!
The tokenized Fear Index ETF (UVXY) rose 10.55% today to $21.37!
Mapping-driven move: Volatility expectations in overseas markets heated up overnight, strengthening VIX-related volatility assets and mechanically lifting UVXY in tandem with its underlying stock.
Conclusion: A traditional financial volatility derivative whose price is 100% tied to the US stock market’s VIX Fear Index. Not a crypto-native protocol; suitable for short-term intraday volatility hedging, with no positions held overnight.
#UVXY #VIX
$UVXY
The tokenized Fear Index ETF (UVXY) rose 10.55% today to $21.37!
Mapping-driven move: Volatility expectations in overseas markets heated up overnight, strengthening VIX-related volatility assets and mechanically lifting UVXY in tandem with its underlying stock.
Conclusion: A traditional financial volatility derivative whose price is 100% tied to the US stock market’s VIX Fear Index. Not a crypto-native protocol; suitable for short-term intraday volatility hedging, with no positions held overnight.
#UVXY #VIX
$UVXY
1
344

🚨 Wall Street Fear Surpasses the Crypto Market 🧠
📊 | $BTC | $ETH | $BNB |
- Follow us, like, and leave a comment for the latest market insights 📈
- After the Nasdaq plunged, the VIX fear index surged 70%, while the CNN Fear and Greed Index fell to 20
- The crypto market sentiment index also fell to 28, signaling rising risk aversion
- Fear in traditional financial markets has clearly surpassed that among crypto traders
- This reversal highlights how quickly market risk appetite is changing 🔥
- If fear continues to spread, crypto assets may come under further pressure
- Institutional investors may adopt a cautious wait-and-see approach, with short-term volatility expected to remain high
- Whale activity is relatively steady, with no signs of large-scale selling so far
- Short-term price action may depend on macroeconomic data and policy signals
- What do you think about the divergence in sentiment between traditional and crypto markets?
- Follow us and share your thoughts in the comments
#Crypto #Bitcoin #VIX #Whales #Market
🚨 Wall Street Fear Surpasses the Crypto Market 🧠
📊 | $BTC | $ETH | $BNB |
- Follow us, like, and leave a comment for the latest market insights 📈
- After the Nasdaq plunged, the VIX fear index surged 70%, while the CNN Fear and Greed Index fell to 20
- The crypto market sentiment index also fell to 28, signaling rising risk aversion
- Fear in traditional financial markets has clearly surpassed that among crypto traders
- This reversal highlights how quickly market risk appetite is changing 🔥
- If fear continues to spread, crypto assets may come under further pressure
- Institutional investors may adopt a cautious wait-and-see approach, with short-term volatility expected to remain high
- Whale activity is relatively steady, with no signs of large-scale selling so far
- Short-term price action may depend on macroeconomic data and policy signals
- What do you think about the divergence in sentiment between traditional and crypto markets?
- Follow us and share your thoughts in the comments
#Crypto #Bitcoin #VIX #Whales #Market
📊 | $BTC | $ETH | $BNB |
- Follow us, like, and leave a comment for the latest market insights 📈
- After the Nasdaq plunged, the VIX fear index surged 70%, while the CNN Fear and Greed Index fell to 20
- The crypto market sentiment index also fell to 28, signaling rising risk aversion
- Fear in traditional financial markets has clearly surpassed that among crypto traders
- This reversal highlights how quickly market risk appetite is changing 🔥
- If fear continues to spread, crypto assets may come under further pressure
- Institutional investors may adopt a cautious wait-and-see approach, with short-term volatility expected to remain high
- Whale activity is relatively steady, with no signs of large-scale selling so far
- Short-term price action may depend on macroeconomic data and policy signals
- What do you think about the divergence in sentiment between traditional and crypto markets?
- Follow us and share your thoughts in the comments
#Crypto #Bitcoin #VIX #Whales #Market
150

·
--
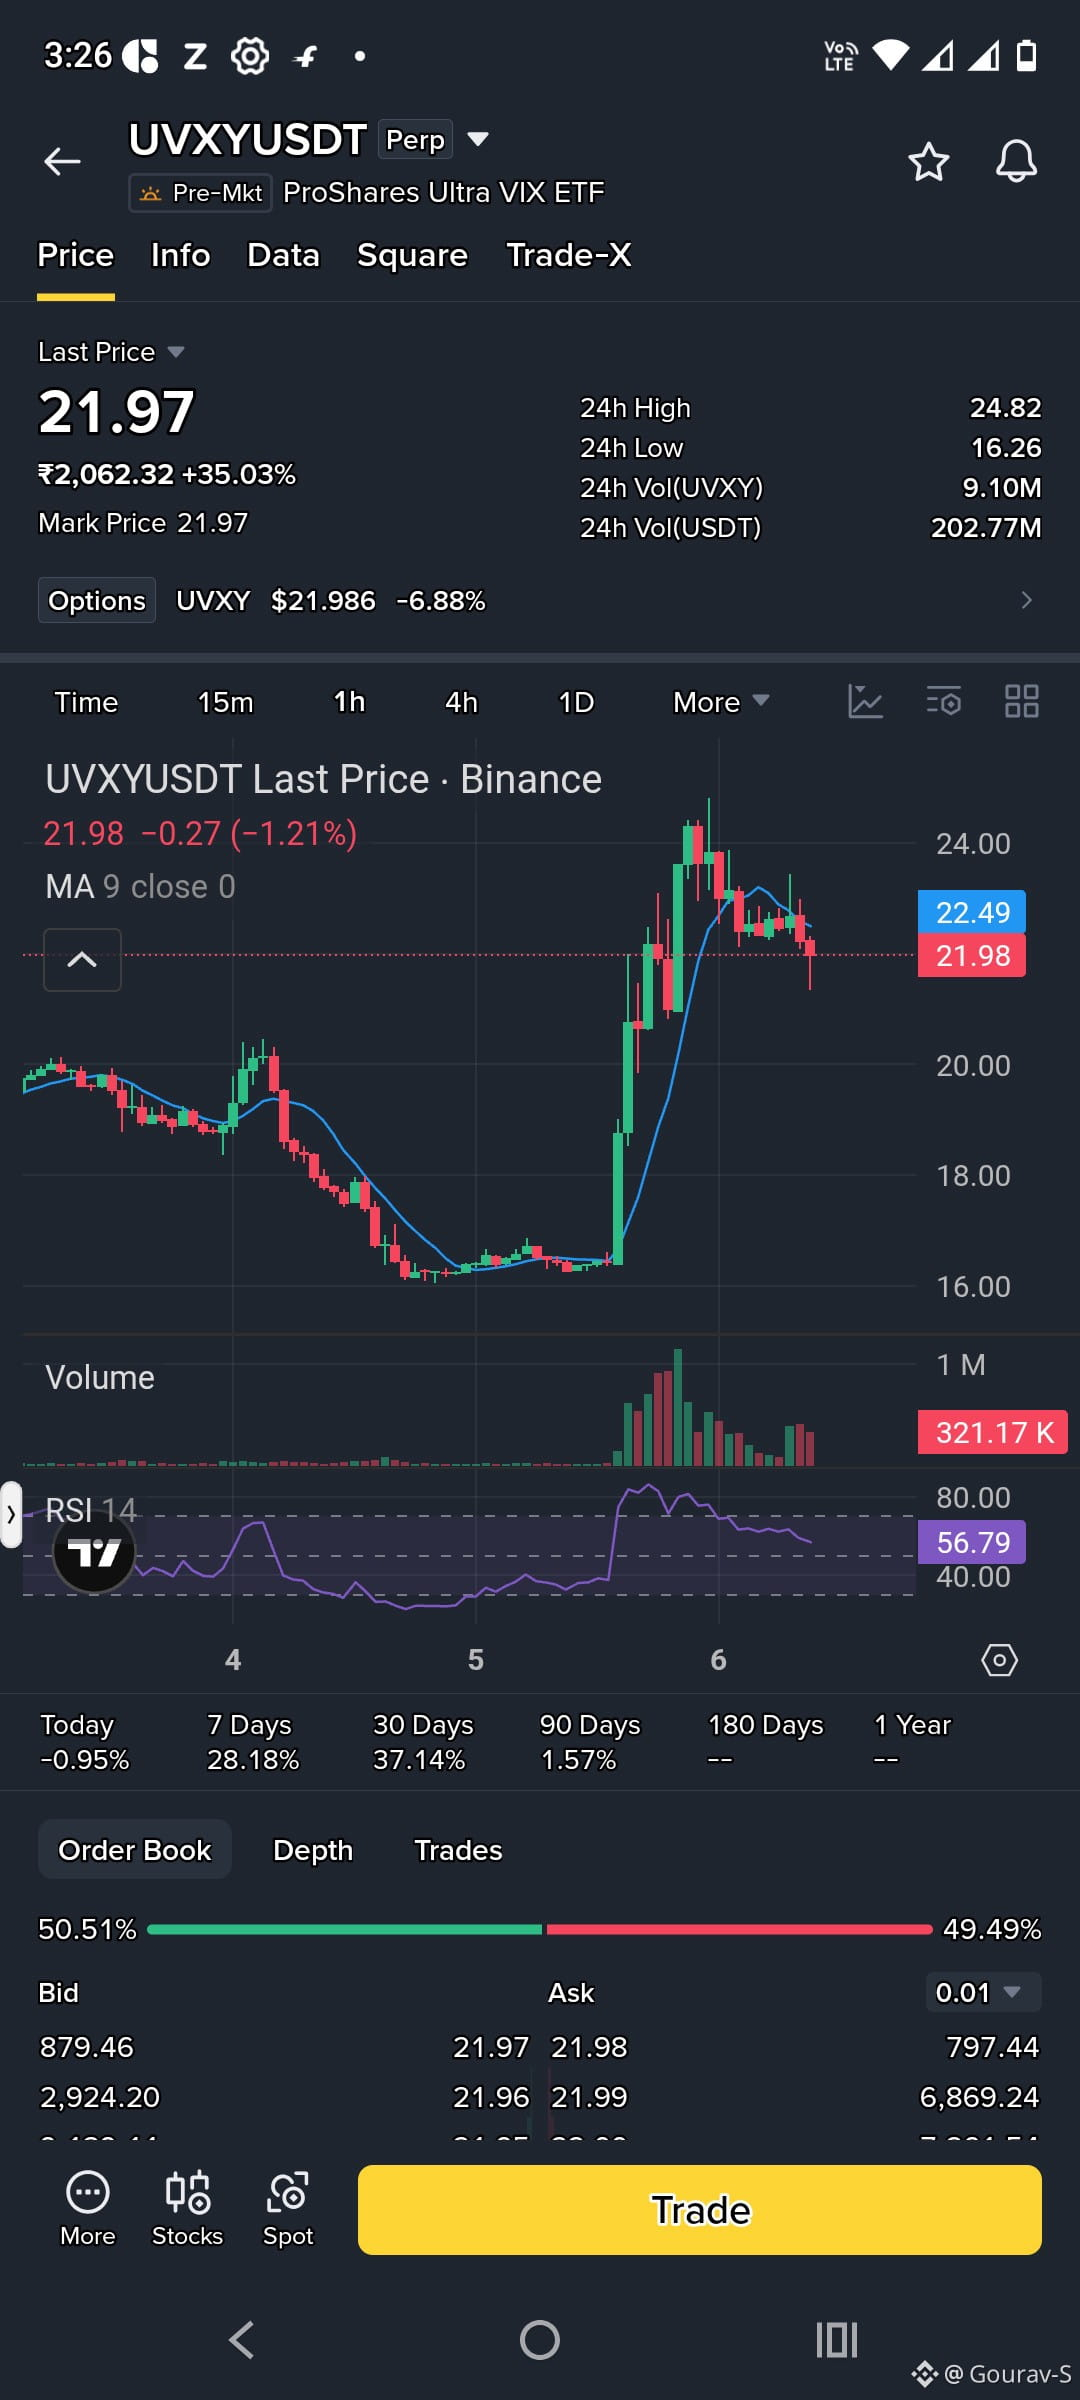
$UVXY - Short Setup
UVXY spiked from 16.3 to 24.8 during the tech rout and is now fading below its 9-period MA on declining volume. I'm looking to sell a bounce into the lower-high zone instead of shorting the middle.
Entry: 22.8 – 23.6 (on retest)
Stop-loss: 24.4
- TP1: 21.0
- TP2: 20.0
- TP3: 18.5
Reason: Failed attempt to hold 24.8, lower highs, price under the MA, and VIX products tend to fade once fear cools. A 1H close above 24.4 invalidates the setup.
📰 News: The Nasdaq fell over 5% in an AI-stock rout, with Nvidia down over 9% and Micron down over 17%. The S&P 500 fell about 4.4% in a day. That spiked volatility. If the selloff resumes, UVXY can rally again, so keep size small. The US jobs report is also due today.
⚠️ Volatility product, very volatile. Small size, low leverage.
Personal view, not financial advice. DYOR.
#UVXY #VIX #Binance #futures
{future}(UVXYUSDT)
$UVXY - Short Setup
UVXY spiked from 16.3 to 24.8 during the tech rout and is now fading below its 9-period MA on declining volume. I'm looking to sell a bounce into the lower-high zone instead of shorting the middle.
Entry: 22.8 – 23.6 (on retest)
Stop-loss: 24.4
- TP1: 21.0
- TP2: 20.0
- TP3: 18.5
Reason: Failed attempt to hold 24.8, lower highs, price under the MA, and VIX products tend to fade once fear cools. A 1H close above 24.4 invalidates the setup.
📰 News: The Nasdaq fell over 5% in an AI-stock rout, with Nvidia down over 9% and Micron down over 17%. The S&P 500 fell about 4.4% in a day. That spiked volatility. If the selloff resumes, UVXY can rally again, so keep size small. The US jobs report is also due today.
⚠️ Volatility product, very volatile. Small size, low leverage.
Personal view, not financial advice. DYOR.
#UVXY #VIX #Binance #futures
UVXY spiked from 16.3 to 24.8 during the tech rout and is now fading below its 9-period MA on declining volume. I'm looking to sell a bounce into the lower-high zone instead of shorting the middle.
Entry: 22.8 – 23.6 (on retest)
Stop-loss: 24.4
- TP1: 21.0
- TP2: 20.0
- TP3: 18.5
Reason: Failed attempt to hold 24.8, lower highs, price under the MA, and VIX products tend to fade once fear cools. A 1H close above 24.4 invalidates the setup.
📰 News: The Nasdaq fell over 5% in an AI-stock rout, with Nvidia down over 9% and Micron down over 17%. The S&P 500 fell about 4.4% in a day. That spiked volatility. If the selloff resumes, UVXY can rally again, so keep size small. The US jobs report is also due today.
⚠️ Volatility product, very volatile. Small size, low leverage.
Personal view, not financial advice. DYOR.
#UVXY #VIX #Binance #futures
3
89

·
--
Bullish
Verified
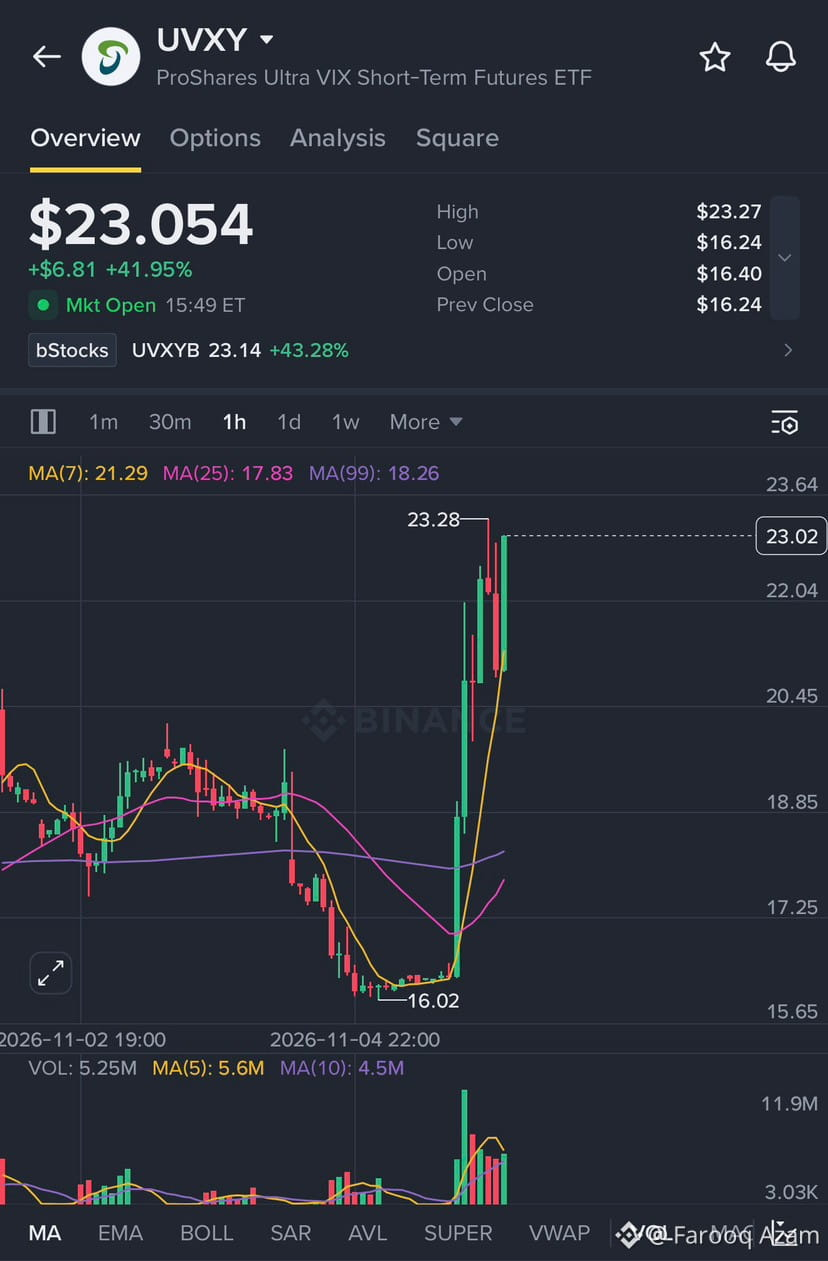
🚨 THE FEAR INDEX IS GOING VERTICAL. IS CRYPTO NEXT?
Look at this absolute monster move on $UVXY ! Up +42% in a single session. 🤯
If you don’t know, $UVXY tracks stock market volatility. When the traditional markets panic, this goes straight up. Look at that massive volume spike at the breakout!
Here is the scary part for us: When the VIX goes parabolic, risk assets (like Crypto) usually bleed.
The price bottomed at $16 and is now sitting at $23. If this keeps ripping, expect heavy pressure on Bitcoin and Altcoins.
What are you doing right now?
Buying the dip (I’m not scared)
Moving to USDT (Protecting the bag)
Already in 100x short (Send help)
Tell me in the comments below!👇
#UVXY #VIX #CryptoMarket #BinanceSquare
🚨 THE FEAR INDEX IS GOING VERTICAL. IS CRYPTO NEXT?
Look at this absolute monster move on $UVXY ! Up +42% in a single session. 🤯
If you don’t know, $UVXY tracks stock market volatility. When the traditional markets panic, this goes straight up. Look at that massive volume spike at the breakout!
Here is the scary part for us: When the VIX goes parabolic, risk assets (like Crypto) usually bleed.
The price bottomed at $16 and is now sitting at $23. If this keeps ripping, expect heavy pressure on Bitcoin and Altcoins.
What are you doing right now?
Buying the dip (I’m not scared)
Moving to USDT (Protecting the bag)
Already in 100x short (Send help)
Tell me in the comments below!👇
#UVXY #VIX #CryptoMarket #BinanceSquare
Look at this absolute monster move on $UVXY ! Up +42% in a single session. 🤯
If you don’t know, $UVXY tracks stock market volatility. When the traditional markets panic, this goes straight up. Look at that massive volume spike at the breakout!
Here is the scary part for us: When the VIX goes parabolic, risk assets (like Crypto) usually bleed.
The price bottomed at $16 and is now sitting at $23. If this keeps ripping, expect heavy pressure on Bitcoin and Altcoins.
What are you doing right now?
Buying the dip (I’m not scared)
Moving to USDT (Protecting the bag)
Already in 100x short (Send help)
Tell me in the comments below!👇
#UVXY #VIX #CryptoMarket #BinanceSquare
1
543
·
--
UVXY: The S&P 500 Wipes Out $2.2 Trillion! The VIX Fear Index Soars 39%! The Fear Index ETF (UVXY) Rockets 38%!
The top hedging tool amid today's black-swan panic in U.S. stocks! The tokenized Fear Index ETF (UVXY) surges 38.10% to $22.69!
A review of the bloodbath in global financial markets:
1. U.S. stocks suffer a brutal sell-off: The S&P 500 plunges more than 3% in a single day, wiping out as much as $2.2 trillion in market value! NVIDIA (NVDA) tumbles about 7%;
2. The Fear Index spikes: The VIX Fear Index rockets 39% in a single day, surging straight to a high of 23!
Conclusion: This is a standard stock perpetual and volatility derivative, with its price 100% reflecting the U.S. stock market Fear Index. Trading is entirely focused on VIX movements. If U.S. stocks stage a technical rebound, the fear premium will quickly evaporate!
#UVXY #VIX
$UVXY
{future}(UVXYUSDT)
UVXY: The S&P 500 Wipes Out $2.2 Trillion! The VIX Fear Index Soars 39%! The Fear Index ETF (UVXY) Rockets 38%!
The top hedging tool amid today's black-swan panic in U.S. stocks! The tokenized Fear Index ETF (UVXY) surges 38.10% to $22.69!
A review of the bloodbath in global financial markets:
1. U.S. stocks suffer a brutal sell-off: The S&P 500 plunges more than 3% in a single day, wiping out as much as $2.2 trillion in market value! NVIDIA (NVDA) tumbles about 7%;
2. The Fear Index spikes: The VIX Fear Index rockets 39% in a single day, surging straight to a high of 23!
Conclusion: This is a standard stock perpetual and volatility derivative, with its price 100% reflecting the U.S. stock market Fear Index. Trading is entirely focused on VIX movements. If U.S. stocks stage a technical rebound, the fear premium will quickly evaporate!
#UVXY #VIX
$UVXY
The top hedging tool amid today's black-swan panic in U.S. stocks! The tokenized Fear Index ETF (UVXY) surges 38.10% to $22.69!
A review of the bloodbath in global financial markets:
1. U.S. stocks suffer a brutal sell-off: The S&P 500 plunges more than 3% in a single day, wiping out as much as $2.2 trillion in market value! NVIDIA (NVDA) tumbles about 7%;
2. The Fear Index spikes: The VIX Fear Index rockets 39% in a single day, surging straight to a high of 23!
Conclusion: This is a standard stock perpetual and volatility derivative, with its price 100% reflecting the U.S. stock market Fear Index. Trading is entirely focused on VIX movements. If U.S. stocks stage a technical rebound, the fear premium will quickly evaporate!
#UVXY #VIX
$UVXY
1
370

$UVXYB
Why Is UVXYB Exploding? A 37% Rally as Wall Street Fear Surges
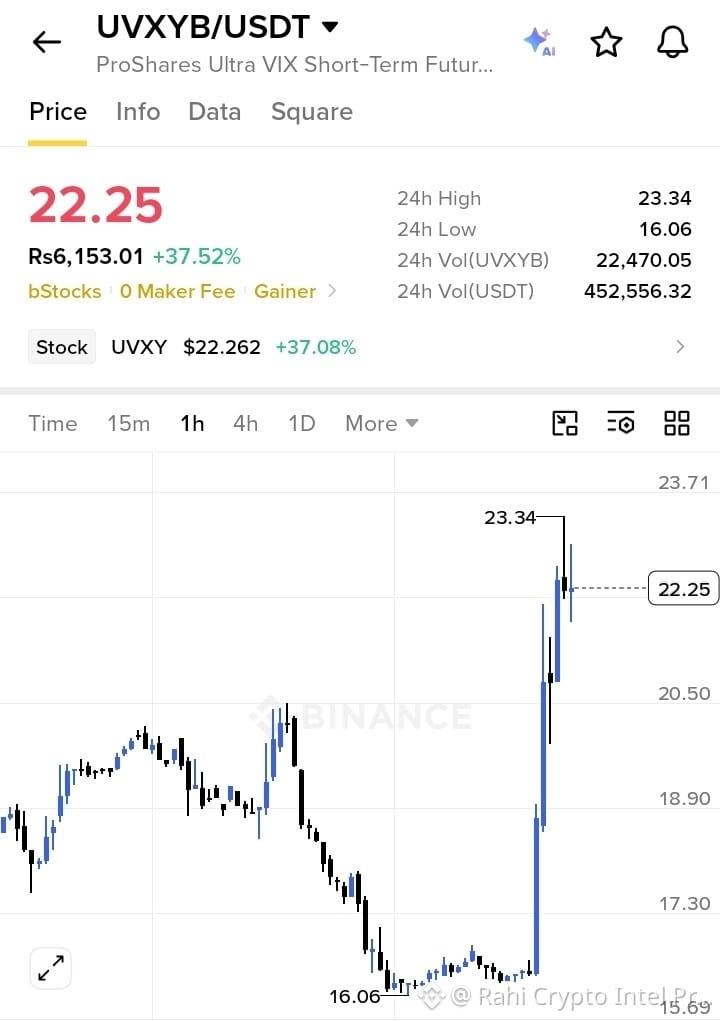
UVXYB is attracting serious attention after gaining 37.52% in 24 hours, reaching $23.34 from a low of $16.06.
The biggest catalyst appears to be rising fear across Wall Street. On November 5, a massive technology-sector selloff erased approximately $2.2 trillion from US stock-market value, while the VIX surged nearly 39%. Investors are becoming more cautious about AI valuations, semiconductor stocks and broader market uncertainty.
UVXYB tracks the ProShares Ultra VIX Short-Term Futures ETF, making it a volatility-focused trading instrument rather than a conventional cryptocurrency. When volatility expectations rise, this product can experience powerful upward movements.
Key Technical Levels:
- Current price: $22.25
- Resistance: $23.34
- Support: $20.50
- Secondary support: $18.90
- Major support: $16.06
A confirmed breakout above $23.34 could indicate further bullish momentum. However, losing $20.50 could trigger significant profit-taking.
The biggest risk is that volatility products can reverse extremely quickly when market fear disappears. UVXY also carries leveraged exposure and potential futures-related decay.
What's your strategy? Are you bullish on UVXYB, or is this 37% rally becoming too risky to chase?
#UVXYB #VIX #StockMarket
$UVXYB
{future}(UVXYUSDT)
$UVXYB
Why Is UVXYB Exploding? A 37% Rally as Wall Street Fear Surges
UVXYB is attracting serious attention after gaining 37.52% in 24 hours, reaching $23.34 from a low of $16.06.
The biggest catalyst appears to be rising fear across Wall Street. On November 5, a massive technology-sector selloff erased approximately $2.2 trillion from US stock-market value, while the VIX surged nearly 39%. Investors are becoming more cautious about AI valuations, semiconductor stocks and broader market uncertainty.
UVXYB tracks the ProShares Ultra VIX Short-Term Futures ETF, making it a volatility-focused trading instrument rather than a conventional cryptocurrency. When volatility expectations rise, this product can experience powerful upward movements.
Key Technical Levels:
- Current price: $22.25
- Resistance: $23.34
- Support: $20.50
- Secondary support: $18.90
- Major support: $16.06
A confirmed breakout above $23.34 could indicate further bullish momentum. However, losing $20.50 could trigger significant profit-taking.
The biggest risk is that volatility products can reverse extremely quickly when market fear disappears. UVXY also carries leveraged exposure and potential futures-related decay.
What's your strategy? Are you bullish on UVXYB, or is this 37% rally becoming too risky to chase?
#UVXYB #VIX #StockMarket
$UVXYB
Why Is UVXYB Exploding? A 37% Rally as Wall Street Fear Surges
UVXYB is attracting serious attention after gaining 37.52% in 24 hours, reaching $23.34 from a low of $16.06.
The biggest catalyst appears to be rising fear across Wall Street. On November 5, a massive technology-sector selloff erased approximately $2.2 trillion from US stock-market value, while the VIX surged nearly 39%. Investors are becoming more cautious about AI valuations, semiconductor stocks and broader market uncertainty.
UVXYB tracks the ProShares Ultra VIX Short-Term Futures ETF, making it a volatility-focused trading instrument rather than a conventional cryptocurrency. When volatility expectations rise, this product can experience powerful upward movements.
Key Technical Levels:
- Current price: $22.25
- Resistance: $23.34
- Support: $20.50
- Secondary support: $18.90
- Major support: $16.06
A confirmed breakout above $23.34 could indicate further bullish momentum. However, losing $20.50 could trigger significant profit-taking.
The biggest risk is that volatility products can reverse extremely quickly when market fear disappears. UVXY also carries leveraged exposure and potential futures-related decay.
What's your strategy? Are you bullish on UVXYB, or is this 37% rally becoming too risky to chase?
#UVXYB #VIX #StockMarket
$UVXYB
63

·
--
🚨 FEAR IS BACK ON WALL STREET — AND $UVXYB JUST EXPLODED 38%.
VIX surged toward 28 as stocks took a beating.
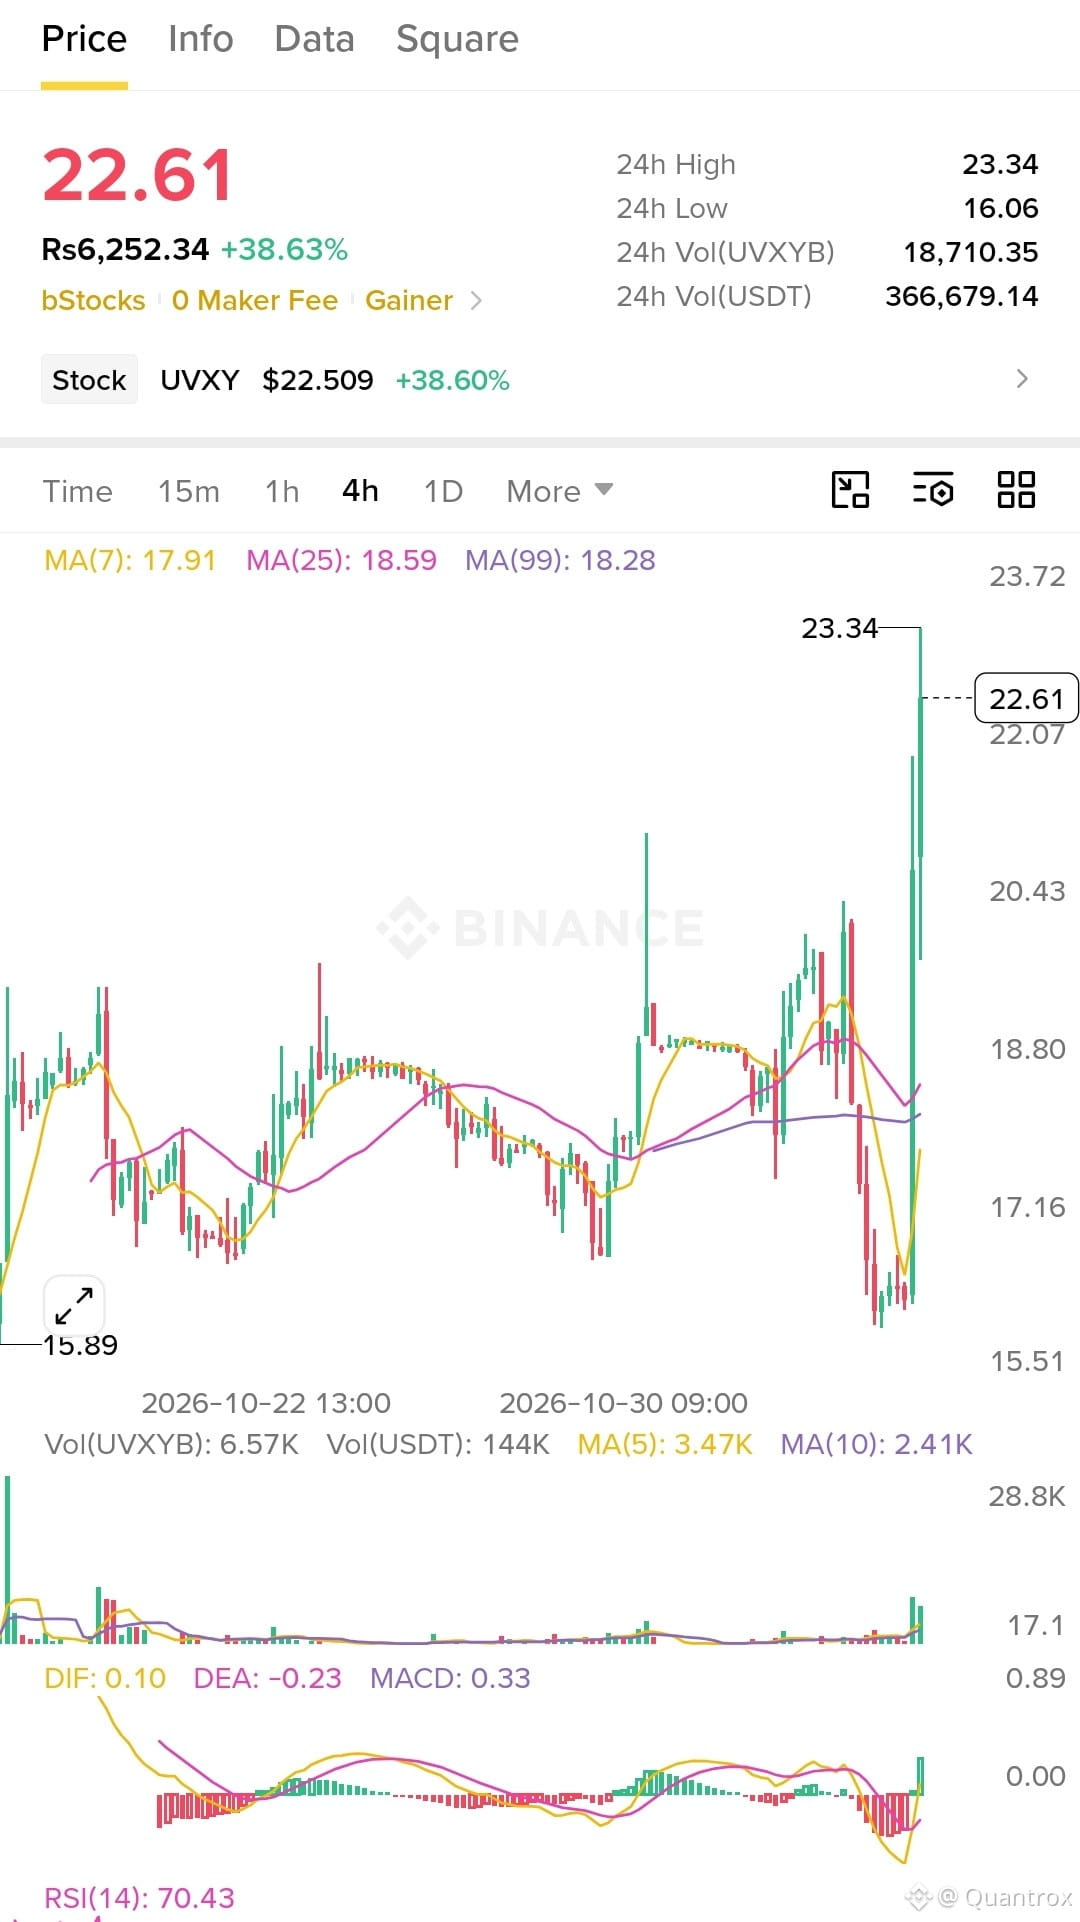
But $UVXYB is already showing RSI 70. Chasing this spike could be dangerous.
🎯 Targets: $23.34 / $25
🛑 Stop: $19.50
I'm watching for a pullback, not buying the panic.
Is this the start of more market fear or a spike ready to fade?
#UVXYB #VIX #USStocksSlipandCryptoMarketUnderBroadPressure
DYOR | NFA
🚨 FEAR IS BACK ON WALL STREET — AND $UVXYB JUST EXPLODED 38%.
VIX surged toward 28 as stocks took a beating.
But $UVXYB is already showing RSI 70. Chasing this spike could be dangerous.
🎯 Targets: $23.34 / $25
🛑 Stop: $19.50
I'm watching for a pullback, not buying the panic.
Is this the start of more market fear or a spike ready to fade?
#UVXYB #VIX #USStocksSlipandCryptoMarketUnderBroadPressure
DYOR | NFA
VIX surged toward 28 as stocks took a beating.
But $UVXYB is already showing RSI 70. Chasing this spike could be dangerous.
🎯 Targets: $23.34 / $25
🛑 Stop: $19.50
I'm watching for a pullback, not buying the panic.
Is this the start of more market fear or a spike ready to fade?
#UVXYB #VIX #USStocksSlipandCryptoMarketUnderBroadPressure
DYOR | NFA
63

·
--
📊【VIX Fear Index at a Glance】
After last night’s sharp drop in U.S. stocks, the VIX closed at 28.18
Up 11.57 points / 69.7% in a single day (previous close: 16.61)
Clearly elevated, but not yet at extreme fear levels.
📅 Compared with this year (2026)
• YTD average ≈ 18.2
• Intraday high: 35.30 (3/9, geopolitical tensions)
• Highest close: 31.05 (3/27)
• Lowest close ≈ 14.2
→ Currently around the upper-middle of this year’s range (about 67%), roughly 55% above the average, and not a new year-to-date high
🕰 Compared with history
• Long-term average ≈ 19.4; current level is about 45% higher
• At the upper end of the “20–30: elevated” range, but not yet in the 30+ “fear” zone
• About one-third of the scale of the COVID / 2008 peaks (80+)
• Also below the ~65 level seen in 2024-08
💡 In a nutshell
A marked surge amid a sharp sell-off—well above average, but far from crisis-level fear.
#VIX #恐慌指数 #美股 #Market
📊【VIX Fear Index at a Glance】
After last night’s sharp drop in U.S. stocks, the VIX closed at 28.18
Up 11.57 points / 69.7% in a single day (previous close: 16.61)
Clearly elevated, but not yet at extreme fear levels.
📅 Compared with this year (2026)
• YTD average ≈ 18.2
• Intraday high: 35.30 (3/9, geopolitical tensions)
• Highest close: 31.05 (3/27)
• Lowest close ≈ 14.2
→ Currently around the upper-middle of this year’s range (about 67%), roughly 55% above the average, and not a new year-to-date high
🕰 Compared with history
• Long-term average ≈ 19.4; current level is about 45% higher
• At the upper end of the “20–30: elevated” range, but not yet in the 30+ “fear” zone
• About one-third of the scale of the COVID / 2008 peaks (80+)
• Also below the ~65 level seen in 2024-08
💡 In a nutshell
A marked surge amid a sharp sell-off—well above average, but far from crisis-level fear.
#VIX #恐慌指数 #美股 #Market
After last night’s sharp drop in U.S. stocks, the VIX closed at 28.18
Up 11.57 points / 69.7% in a single day (previous close: 16.61)
Clearly elevated, but not yet at extreme fear levels.
📅 Compared with this year (2026)
• YTD average ≈ 18.2
• Intraday high: 35.30 (3/9, geopolitical tensions)
• Highest close: 31.05 (3/27)
• Lowest close ≈ 14.2
→ Currently around the upper-middle of this year’s range (about 67%), roughly 55% above the average, and not a new year-to-date high
🕰 Compared with history
• Long-term average ≈ 19.4; current level is about 45% higher
• At the upper end of the “20–30: elevated” range, but not yet in the 30+ “fear” zone
• About one-third of the scale of the COVID / 2008 peaks (80+)
• Also below the ~65 level seen in 2024-08
💡 In a nutshell
A marked surge amid a sharp sell-off—well above average, but far from crisis-level fear.
#VIX #恐慌指数 #美股 #Market
96

·
--
The U.S. stock market fear index exploded tonight
MSX data
VIX at 24.44
Up 7.83 points
A gain of about 47.14%
Highest since April 7
All three major indexes fell in sync
Dow down about 1.5%
S&P 500 down about 2.65%
Nasdaq down about 4.25%
During the day, markets were still digesting post-election sector rotation
Overnight, volatility made the first move
Crypto leveraged positions were also liquidated around the same time
Stock market fear and crypto margin calls were two sides of the same night
$BTC $ETH
#VIX #美股 #比特币 #加密市场 #Binance Square
The U.S. stock market fear index exploded tonight
MSX data
VIX at 24.44
Up 7.83 points
A gain of about 47.14%
Highest since April 7
All three major indexes fell in sync
Dow down about 1.5%
S&P 500 down about 2.65%
Nasdaq down about 4.25%
During the day, markets were still digesting post-election sector rotation
Overnight, volatility made the first move
Crypto leveraged positions were also liquidated around the same time
Stock market fear and crypto margin calls were two sides of the same night
$BTC $ETH
#VIX #美股 #比特币 #加密市场 #Binance Square
MSX data
VIX at 24.44
Up 7.83 points
A gain of about 47.14%
Highest since April 7
All three major indexes fell in sync
Dow down about 1.5%
S&P 500 down about 2.65%
Nasdaq down about 4.25%
During the day, markets were still digesting post-election sector rotation
Overnight, volatility made the first move
Crypto leveraged positions were also liquidated around the same time
Stock market fear and crypto margin calls were two sides of the same night
$BTC $ETH
#VIX #美股 #比特币 #加密市场 #Binance Square
1
544

·
--
Partly True
🚨VIX surges! Does historical data suggest the bottom is in? I’m buying the dip against the trend, but there’s one market I absolutely won’t touch!🔥
Body:
U.S. stocks plunged, China’s A-shares tumbled, and even tech giants like Intel and Google weren’t spared. With screens awash in red, the fear index (VIX) shot straight up.
A lot of people are scared, but I see an opportunity. 👀
Here’s a little-known fact: historically, VIX gaps have almost always been filled.
The data shows only 3 extreme cases in the past where gaps weren’t filled. And historical patterns tell us there’s a 97% chance a gap will be filled within 180 trading days! What does that mean? It means extreme fear like we’re seeing now is often a sign of a short-term bottom.
My strategy is clear:
✅ I’m starting to buy the dip in U.S. stock indexes!
The lower they go, the more I buy, building my position in stages.
✅ Spot purchases only—absolutely no leverage!
At this level of volatility, staying in the game matters more than making a quick buck.
❌ But I absolutely won’t touch A-shares!
(Everyone knows why. If you know, you know. See you in the comments 👇)
In this market, I’m greedy when others are fearful. Are you brave enough to bet with me on that 97% probability in this rebound?
#美股休市 #VIX #抄底 #投资理财 #A股暴跌
🚨VIX surges! Does historical data suggest the bottom is in? I’m buying the dip against the trend, but there’s one market I absolutely won’t touch!🔥
Body:
U.S. stocks plunged, China’s A-shares tumbled, and even tech giants like Intel and Google weren’t spared. With screens awash in red, the fear index (VIX) shot straight up.
A lot of people are scared, but I see an opportunity. 👀
Here’s a little-known fact: historically, VIX gaps have almost always been filled.
The data shows only 3 extreme cases in the past where gaps weren’t filled. And historical patterns tell us there’s a 97% chance a gap will be filled within 180 trading days! What does that mean? It means extreme fear like we’re seeing now is often a sign of a short-term bottom.
My strategy is clear:
✅ I’m starting to buy the dip in U.S. stock indexes!
The lower they go, the more I buy, building my position in stages.
✅ Spot purchases only—absolutely no leverage!
At this level of volatility, staying in the game matters more than making a quick buck.
❌ But I absolutely won’t touch A-shares!
(Everyone knows why. If you know, you know. See you in the comments 👇)
In this market, I’m greedy when others are fearful. Are you brave enough to bet with me on that 97% probability in this rebound?
#美股休市 #VIX #抄底 #投资理财 #A股暴跌
Body:
U.S. stocks plunged, China’s A-shares tumbled, and even tech giants like Intel and Google weren’t spared. With screens awash in red, the fear index (VIX) shot straight up.
A lot of people are scared, but I see an opportunity. 👀
Here’s a little-known fact: historically, VIX gaps have almost always been filled.
The data shows only 3 extreme cases in the past where gaps weren’t filled. And historical patterns tell us there’s a 97% chance a gap will be filled within 180 trading days! What does that mean? It means extreme fear like we’re seeing now is often a sign of a short-term bottom.
My strategy is clear:
✅ I’m starting to buy the dip in U.S. stock indexes!
The lower they go, the more I buy, building my position in stages.
✅ Spot purchases only—absolutely no leverage!
At this level of volatility, staying in the game matters more than making a quick buck.
❌ But I absolutely won’t touch A-shares!
(Everyone knows why. If you know, you know. See you in the comments 👇)
In this market, I’m greedy when others are fearful. Are you brave enough to bet with me on that 97% probability in this rebound?
#美股休市 #VIX #抄底 #投资理财 #A股暴跌
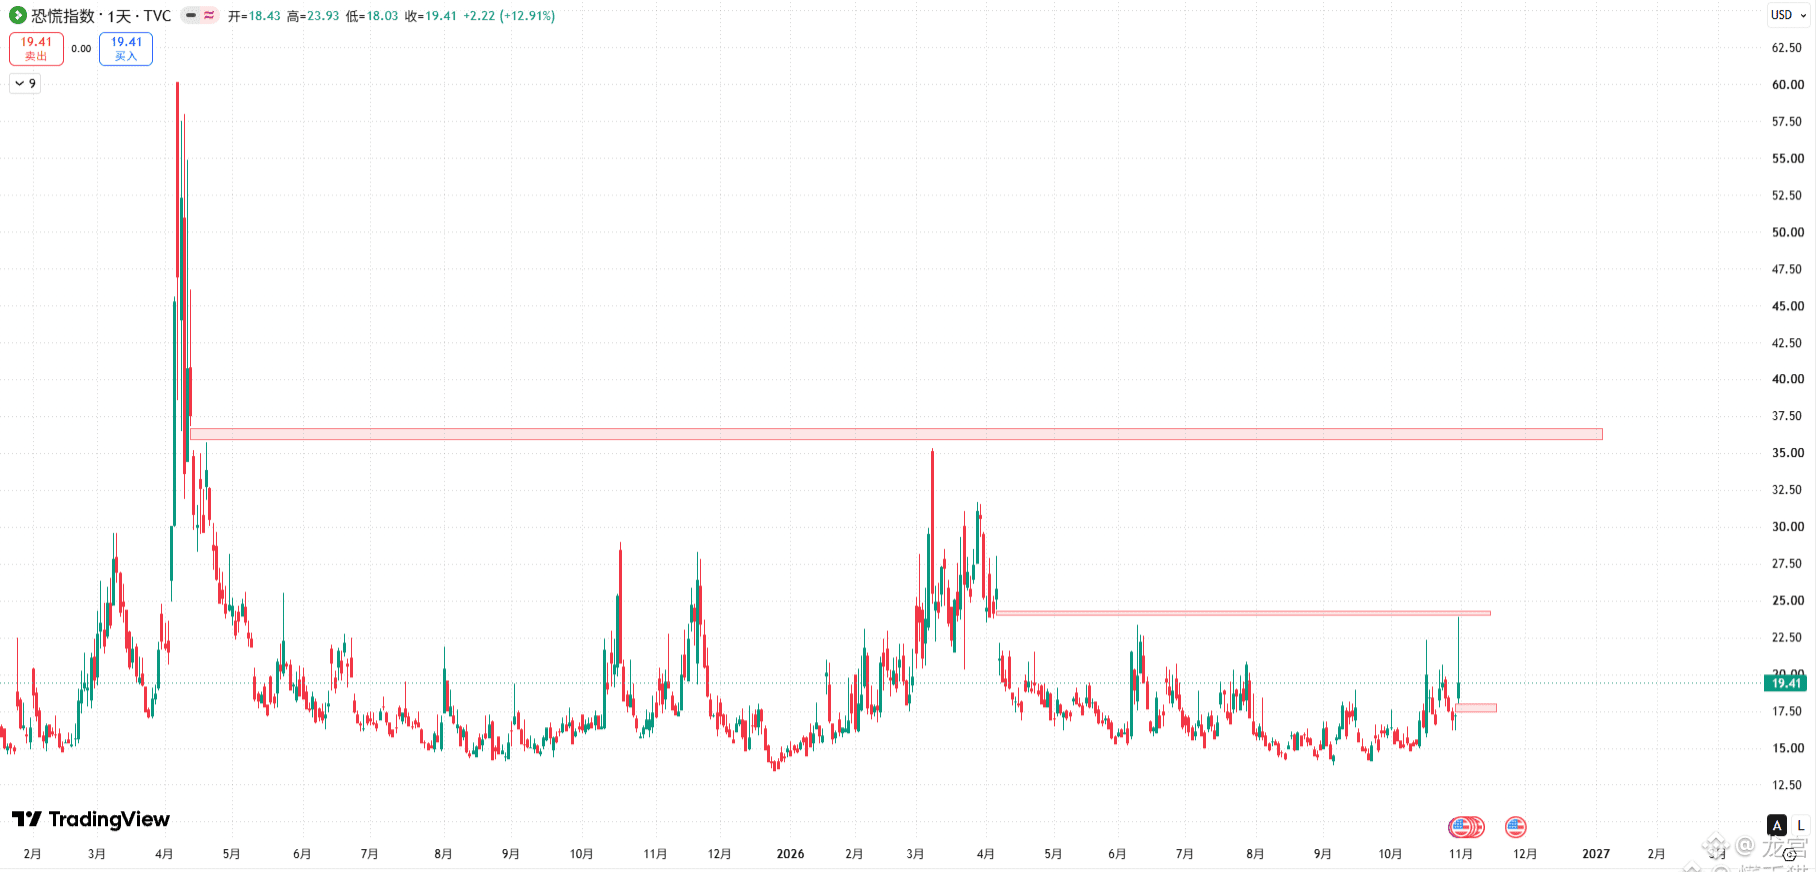
GOOGUS-0.84%
SOXLB+0.06%
14
25
8.9k
Log in to explore more content
Join global crypto users on Binance Square
⚡️ Get latest and useful information about crypto.
💬 Trusted by the world’s largest crypto exchange.
👍 Discover real insights from verified creators.
Email / Phone number
Trending Topics
1
#NvidiaLoses$2.7TrillionInMonthAndAHalf
16,477 views
113 Discussing
2
#CanBTCReboundAfterFallingBelow60K?
732,977 views
2,932 Discussing
3
#GlobalStocksFaceLongestLosingStreakSince2023
265,205 views
1,963 Discussing
4
#BlackRockIBITPostsRecord$541MSingleDayOutflow
30,570 views
88 Discussing
5
#AnthropicPlungesTowardIPOPriceonDay2
134,831 views
1,189 Discussing
6
#TwentyOneCapitalAdds172.25BTC
61,462 views
647 Discussing
7
#HKBillWouldExcludeTokenizedDepositsFromVirtualAssets
7,591 views
50 Discussing
8
#BNBDropsBelow540USDTWith8.46%DailyDecline
74,156 views
637 Discussing
9
#HKBillProposesHK$100KFineForUnauthorizedCryptoTitles
2,490 views
22 Discussing
10
#BitMineFaces$10.1BUnrealizedETHLoss
5,188 views
28 Discussing