
#technicaljafar
technicaljafar
327,005 views
237 Discussing
Hot
Latest

Article
BNB MARKET UPDATE | NOVEMBER 8, 2026{spot}(BNBUSDT)
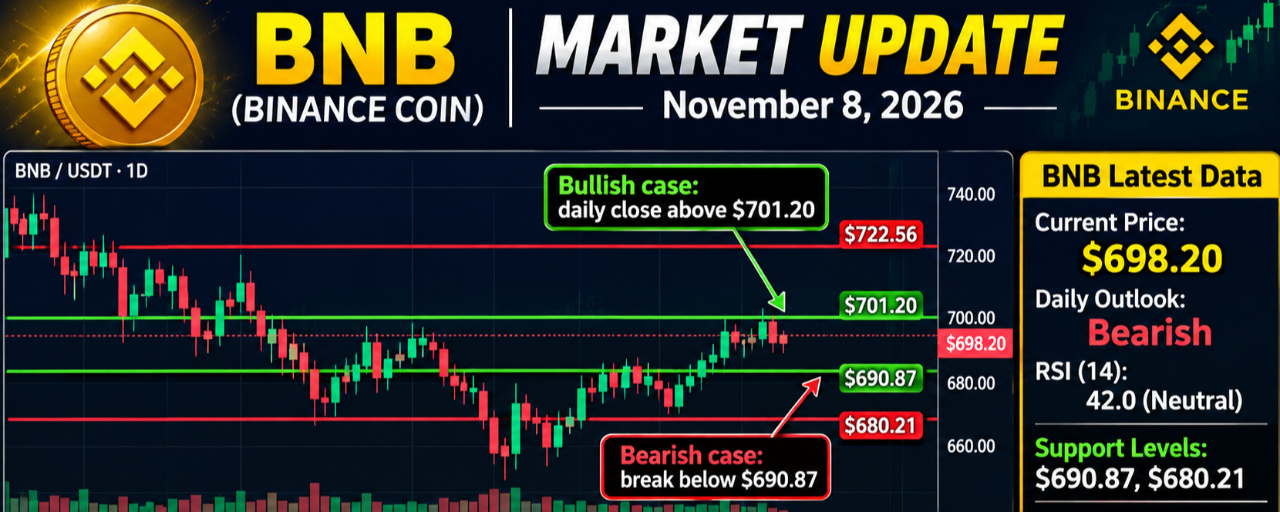
$BNB is trading near $698.20, showing mixed market conditions with a bearish short-term trend. The key support levels are $690.87 and $680.21, while resistance is located at $701.20 and $722.56. RSI is around 42, indicating neutral momentum. If BNB breaks above $701.20 and maintains its strength, the market outlook could improve. However, a breakdown below $690.87 may increase selling pressure. Current outlook: Neutral to Bearish. Traders should monitor price action, volume, and Bitcoin's movement before making decisions. Remember, cryptocurrency markets are volatile, and no Buy or Sell signal is guaranteed.
#BTC走势分析 NB #ARKPlans14ThematicETFsCoveringAIAndTokenizedMarkets #cryptoupdate2024 #CryptoMENA #technicalJafar
BNB MARKET UPDATE | NOVEMBER 8, 2026
$BNB is trading near $698.20, showing mixed market conditions with a bearish short-term trend. The key support levels are $690.87 and $680.21, while resistance is located at $701.20 and $722.56. RSI is around 42, indicating neutral momentum. If BNB breaks above $701.20 and maintains its strength, the market outlook could improve. However, a breakdown below $690.87 may increase selling pressure. Current outlook: Neutral to Bearish. Traders should monitor price action, volume, and Bitcoin's movement before making decisions. Remember, cryptocurrency markets are volatile, and no Buy or Sell signal is guaranteed.
#BTC走势分析 NB #ARKPlans14ThematicETFsCoveringAIAndTokenizedMarkets #cryptoupdate2024 #CryptoMENA #technicalJafar
#BTC走势分析 NB #ARKPlans14ThematicETFsCoveringAIAndTokenizedMarkets #cryptoupdate2024 #CryptoMENA #technicalJafar
105

I'm hosting the live audio broadcast "What will the next move be, and what will happen!!!!" on Binance Square. Listen here:
[https://app.binance.com/uni-qr/cspa/48183542555841?r=YC9A1S0U&l=ar&source=host_share&uc=app_square_share_link&us=copylink](https://app.binance.com/uni-qr/cspa/48183542555841?r=YC9A1S0U&l=ar&source=host_share&uc=app_square_share_link&us=copylink)
#JobsReportRaisesHikeOdds #technicalJafar
I'm hosting the live audio broadcast "What will the next move be, and what will happen!!!!" on Binance Square. Listen here:
https://app.binance.com/uni-qr/cspa/48183542555841?r=YC9A1S0U&l=ar&source=host_share&uc=app_square_share_link&us=copylink
#JobsReportRaisesHikeOdds #technicalJafar
https://app.binance.com/uni-qr/cspa/48183542555841?r=YC9A1S0U&l=ar&source=host_share&uc=app_square_share_link&us=copylink
#JobsReportRaisesHikeOdds #technicalJafar
2
260

·
--
69

·
--
🚨 $BTC HOLDING $81,000 SUPPORT — BULL BREAKOUT OR RETEST?
Bitcoin is currently consolidating around the $81,200 range as traders absorb recent $ETFT.ETF inflows and macro data.
📊 Key Levels To Watch:
• Major Resistance: $84,500 (Breakout target -> $88,000)
• Key Support Zone: $81,000 - $79,800
• RSI / Momentum: Neutral with bullish divergence on 4H chart.
💡 Trade Setup Plan:
• Long Entry: Confirmation on 4H candle close above $82,200.
• Stop Loss (SL): Tight SL below $79,500.
• Target 1 (TP1): $84,500
• Target 2 (TP2): $88,000
⚠️ Risk Warning: High leverage is risky during consolidation. Always manage your position sizing!
💬 What is your bias today? Bullish 🚀 or Bearish 📉? Drop your price predictions below!
#CryptoTrading #Bitcoin #BTC #MarketUpdate #BinanceSquare #technicalJafar hnicalAnalysis #TradingSignals #BrazilCryptoExchangesMustApplyForLicensesByFriday
🚨 $BTC HOLDING $81,000 SUPPORT — BULL BREAKOUT OR RETEST?
Bitcoin is currently consolidating around the $81,200 range as traders absorb recent $ETFT.ETF inflows and macro data.
📊 Key Levels To Watch:
• Major Resistance: $84,500 (Breakout target -> $88,000)
• Key Support Zone: $81,000 - $79,800
• RSI / Momentum: Neutral with bullish divergence on 4H chart.
💡 Trade Setup Plan:
• Long Entry: Confirmation on 4H candle close above $82,200.
• Stop Loss (SL): Tight SL below $79,500.
• Target 1 (TP1): $84,500
• Target 2 (TP2): $88,000
⚠️ Risk Warning: High leverage is risky during consolidation. Always manage your position sizing!
💬 What is your bias today? Bullish 🚀 or Bearish 📉? Drop your price predictions below!
#CryptoTrading #Bitcoin #BTC #MarketUpdate #BinanceSquare #technicalJafar hnicalAnalysis #TradingSignals #BrazilCryptoExchangesMustApplyForLicensesByFriday
Bitcoin is currently consolidating around the $81,200 range as traders absorb recent $ETFT.ETF inflows and macro data.
📊 Key Levels To Watch:
• Major Resistance: $84,500 (Breakout target -> $88,000)
• Key Support Zone: $81,000 - $79,800
• RSI / Momentum: Neutral with bullish divergence on 4H chart.
💡 Trade Setup Plan:
• Long Entry: Confirmation on 4H candle close above $82,200.
• Stop Loss (SL): Tight SL below $79,500.
• Target 1 (TP1): $84,500
• Target 2 (TP2): $88,000
⚠️ Risk Warning: High leverage is risky during consolidation. Always manage your position sizing!
💬 What is your bias today? Bullish 🚀 or Bearish 📉? Drop your price predictions below!
#CryptoTrading #Bitcoin #BTC #MarketUpdate #BinanceSquare #technicalJafar hnicalAnalysis #TradingSignals #BrazilCryptoExchangesMustApplyForLicensesByFriday
72

Article
🚨 BITCOIN UNDER PRESSURE! 🩸 $81,328 IS THE LEVEL EVERY TRADER SHOULD WATCH! ⚡🔥 BTC/USDT: THE BATTLE FOR SURVIVAL HAS BEGUN!
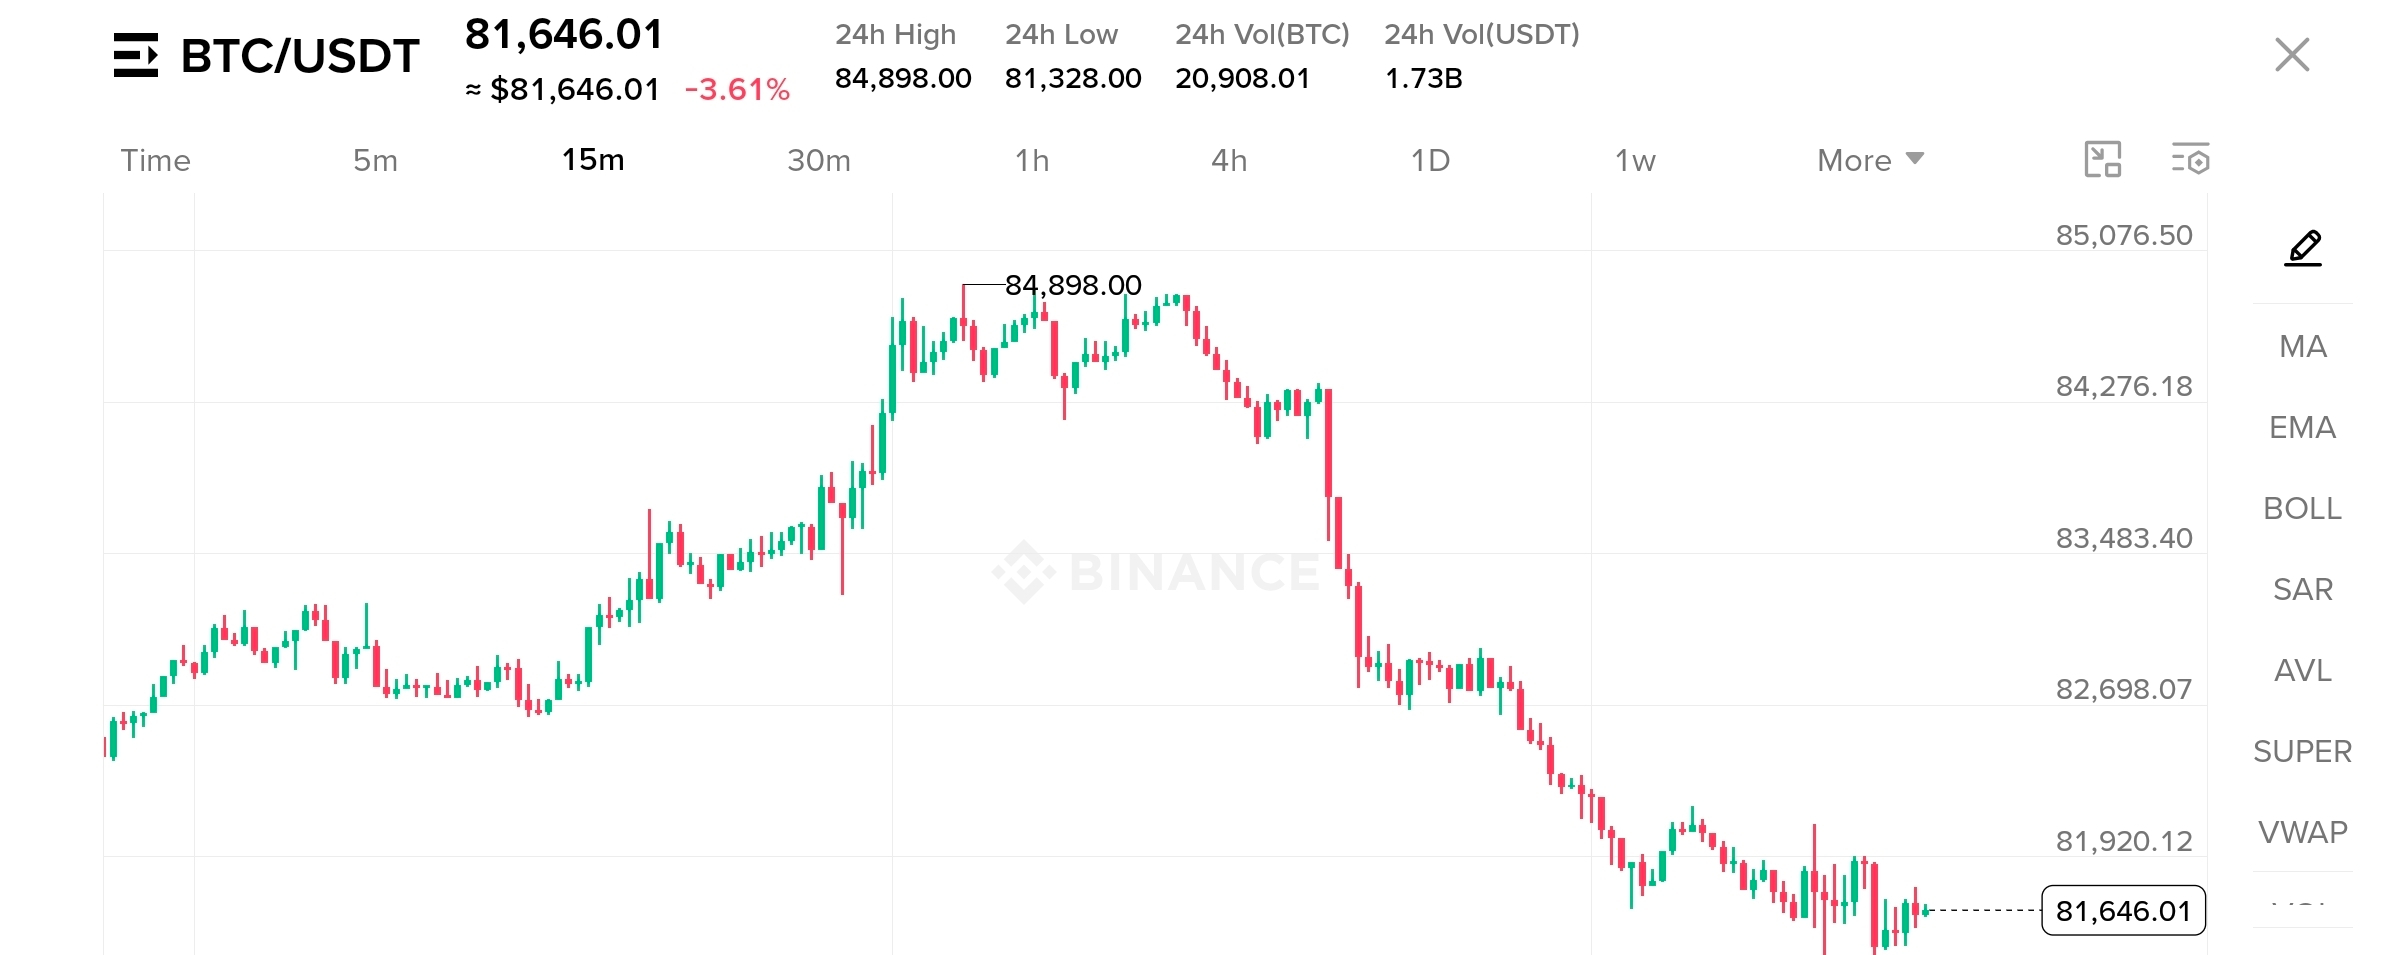
Bitcoin is showing a serious shift in momentum, and the 15-minute chart is telling a story that bulls cannot ignore. After climbing toward $84,898, BTC faced aggressive selling pressure and reversed sharply, wiping out much of its recent upside. Now trading around $81,646, Bitcoin is down approximately 3.61%, and the market is watching one critical question: Is this a temporary shakeout, or is more downside waiting ahead? 📉
🐻 THE BEARS HAVE TAKEN CONTROL — FOR NOW!
The chart shows a clear sequence of lower highs and lower lows following the rejection near $84.9K. The breakdown through the $83.4K and $82.7K areas suggests sellers have gained short-term control. But the real test is happening now, near the recent low of $81,328.
⚔️ THE LEVEL THAT COULD CHANGE EVERYTHING!
If BTC loses $81,328 decisively, with strong selling volume, another wave of downside pressure could emerge. However, if buyers defend this zone and push price back above $81,920, a relief bounce toward $82,700 could become possible. A stronger recovery would still need to reclaim higher resistance levels before the bullish momentum can be trusted again.
🐂 CAN THE BULLS DELIVER A COMEBACK?
Markets often create their biggest opportunities when fear dominates the headlines, but catching a falling knife can be expensive. Watch the reaction around support, monitor volume, and wait for confirmation instead of chasing every candle.
💎 MY TAKE: Bitcoin is at a crucial short-term decision zone. The next move around $81.3K–$81.9K could reveal whether buyers are ready to fight back or sellers still have unfinished business. No direction is guaranteed — let price action confirm the story.
🔥 What do you think comes next?
🐂 $83K+ BOUNCE or 🐻 $80K BREAKDOWN?
Drop your prediction below! 👇
$BTC
#Bitcoin #technicalJafar #TechnicalAnalysis_Tickeron #TechnicalIndicators $XRP
{future}(XRPUSDT)
$SOL
{spot}(SOLUSDT)
🚨 BITCOIN UNDER PRESSURE! 🩸 $81,328 IS THE LEVEL EVERY TRADER SHOULD WATCH! ⚡
🔥 BTC/USDT: THE BATTLE FOR SURVIVAL HAS BEGUN!
Bitcoin is showing a serious shift in momentum, and the 15-minute chart is telling a story that bulls cannot ignore. After climbing toward $84,898, BTC faced aggressive selling pressure and reversed sharply, wiping out much of its recent upside. Now trading around $81,646, Bitcoin is down approximately 3.61%, and the market is watching one critical question: Is this a temporary shakeout, or is more downside waiting ahead? 📉
🐻 THE BEARS HAVE TAKEN CONTROL — FOR NOW!
The chart shows a clear sequence of lower highs and lower lows following the rejection near $84.9K. The breakdown through the $83.4K and $82.7K areas suggests sellers have gained short-term control. But the real test is happening now, near the recent low of $81,328.
⚔️ THE LEVEL THAT COULD CHANGE EVERYTHING!
If BTC loses $81,328 decisively, with strong selling volume, another wave of downside pressure could emerge. However, if buyers defend this zone and push price back above $81,920, a relief bounce toward $82,700 could become possible. A stronger recovery would still need to reclaim higher resistance levels before the bullish momentum can be trusted again.
🐂 CAN THE BULLS DELIVER A COMEBACK?
Markets often create their biggest opportunities when fear dominates the headlines, but catching a falling knife can be expensive. Watch the reaction around support, monitor volume, and wait for confirmation instead of chasing every candle.
💎 MY TAKE: Bitcoin is at a crucial short-term decision zone. The next move around $81.3K–$81.9K could reveal whether buyers are ready to fight back or sellers still have unfinished business. No direction is guaranteed — let price action confirm the story.
🔥 What do you think comes next?
🐂 $83K+ BOUNCE or 🐻 $80K BREAKDOWN?
Drop your prediction below! 👇
$BTC
#Bitcoin #technicalJafar #TechnicalAnalysis_Tickeron #TechnicalIndicators $XRP
$SOL
Bitcoin is showing a serious shift in momentum, and the 15-minute chart is telling a story that bulls cannot ignore. After climbing toward $84,898, BTC faced aggressive selling pressure and reversed sharply, wiping out much of its recent upside. Now trading around $81,646, Bitcoin is down approximately 3.61%, and the market is watching one critical question: Is this a temporary shakeout, or is more downside waiting ahead? 📉
🐻 THE BEARS HAVE TAKEN CONTROL — FOR NOW!
The chart shows a clear sequence of lower highs and lower lows following the rejection near $84.9K. The breakdown through the $83.4K and $82.7K areas suggests sellers have gained short-term control. But the real test is happening now, near the recent low of $81,328.
⚔️ THE LEVEL THAT COULD CHANGE EVERYTHING!
If BTC loses $81,328 decisively, with strong selling volume, another wave of downside pressure could emerge. However, if buyers defend this zone and push price back above $81,920, a relief bounce toward $82,700 could become possible. A stronger recovery would still need to reclaim higher resistance levels before the bullish momentum can be trusted again.
🐂 CAN THE BULLS DELIVER A COMEBACK?
Markets often create their biggest opportunities when fear dominates the headlines, but catching a falling knife can be expensive. Watch the reaction around support, monitor volume, and wait for confirmation instead of chasing every candle.
💎 MY TAKE: Bitcoin is at a crucial short-term decision zone. The next move around $81.3K–$81.9K could reveal whether buyers are ready to fight back or sellers still have unfinished business. No direction is guaranteed — let price action confirm the story.
🔥 What do you think comes next?
🐂 $83K+ BOUNCE or 🐻 $80K BREAKDOWN?
Drop your prediction below! 👇
$BTC
#Bitcoin #technicalJafar #TechnicalAnalysis_Tickeron #TechnicalIndicators $XRP
$SOL
165

·
--
🚨 URGENT: Is $SOL Coiling for a Massive Breakout? Watch This Level! 🚨While the macro market keeps everyone guessing, smart money is quietly accumulation Solana ($SOL). Why? Because the massive Alpenglow upgrade is heating up behind the scenes! 📈✨
For those missing the technical details: This massive protocol shift will replace old validation models with the new Votor and Rotor systems, aiming to drop block finality down to a blinding 100–150 milliseconds. ⚡
🧠 The Chart Reality:
Right now, SOL is consolidating inside a tight local supply zone. Historically, whenever a major Layer-1 network undergoes a fundamental tech upgrade during market compression, the eventual breakout is violent. If the bulls clear local resistance, a massive short-squeeze could catch retail completely off guard.
But be careful—if $BTC drops below its support floor, the entire altcoin market will face a quick shakeout first. ⚠️
👇 LET’S SETTLE THE DEBATE 👇
What is your move on Solana right now?
🟢 BUY THE COIL — It's sending SOL straight back to triple digits!
🔴 WAIT FOR A DROP — It's a fakeout before another correction!
Drop a comment below with your target! Let’s see who is tracking the smart money! 💬👇
#Solana #SOL #technicalJafar #TechnicalAnalysis
{spot}(SOLUSDT)
{spot}(ETHUSDT)
🚨 URGENT: Is $SOL Coiling for a Massive Breakout? Watch This Level! 🚨
While the macro market keeps everyone guessing, smart money is quietly accumulation Solana ($SOL). Why? Because the massive Alpenglow upgrade is heating up behind the scenes! 📈✨
For those missing the technical details: This massive protocol shift will replace old validation models with the new Votor and Rotor systems, aiming to drop block finality down to a blinding 100–150 milliseconds. ⚡
🧠 The Chart Reality:
Right now, SOL is consolidating inside a tight local supply zone. Historically, whenever a major Layer-1 network undergoes a fundamental tech upgrade during market compression, the eventual breakout is violent. If the bulls clear local resistance, a massive short-squeeze could catch retail completely off guard.
But be careful—if $BTC drops below its support floor, the entire altcoin market will face a quick shakeout first. ⚠️
👇 LET’S SETTLE THE DEBATE 👇
What is your move on Solana right now?
🟢 BUY THE COIL — It's sending SOL straight back to triple digits!
🔴 WAIT FOR A DROP — It's a fakeout before another correction!
Drop a comment below with your target! Let’s see who is tracking the smart money! 💬👇
#Solana #SOL #technicalJafar #TechnicalAnalysis
For those missing the technical details: This massive protocol shift will replace old validation models with the new Votor and Rotor systems, aiming to drop block finality down to a blinding 100–150 milliseconds. ⚡
🧠 The Chart Reality:
Right now, SOL is consolidating inside a tight local supply zone. Historically, whenever a major Layer-1 network undergoes a fundamental tech upgrade during market compression, the eventual breakout is violent. If the bulls clear local resistance, a massive short-squeeze could catch retail completely off guard.
But be careful—if $BTC drops below its support floor, the entire altcoin market will face a quick shakeout first. ⚠️
👇 LET’S SETTLE THE DEBATE 👇
What is your move on Solana right now?
🟢 BUY THE COIL — It's sending SOL straight back to triple digits!
🔴 WAIT FOR A DROP — It's a fakeout before another correction!
Drop a comment below with your target! Let’s see who is tracking the smart money! 💬👇
#Solana #SOL #technicalJafar #TechnicalAnalysis
111

Article
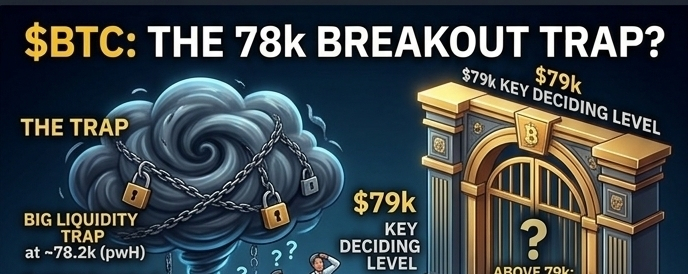
BTC: The 78k Breakout Trap? Why the "Normies" Might Be Wrong!🔹 The Liquidity Trap: There is a massive liquidity cluster sitting just above the previous week's high (pwH) around $78.2k. In my opinion, this isn't the start of a massive bullish breakout—it looks highly likely to be a bearish retest to trap early buyers.
🔹 The First Move (The Sweep): Before we see any real push upside, I’m expecting the price to sweep down first. Watch out for a move to clear the previous week's low (pwL) around $74.3k.
🔹 The Recovery Phase: Once that downside liquidity is grabbed, then I expect a solid push back up into the $79k–$80k region.
🎯 The Ultimate Deciding Zone:
The $79k level is my absolute line in the sand. What happens above $79k will tell us everything we need to know. It will give us the ultimate confirmation: Are we truly heading up for a massive monthly High (mH) sweep, or is the market setting up another rejection? #Bitcoin #BTC走势分析 #CryptoTradin g #technicalJafar #BinanceSquare
BTC: The 78k Breakout Trap? Why the "Normies" Might Be Wrong!
🔹 The Liquidity Trap: There is a massive liquidity cluster sitting just above the previous week's high (pwH) around $78.2k. In my opinion, this isn't the start of a massive bullish breakout—it looks highly likely to be a bearish retest to trap early buyers.
🔹 The First Move (The Sweep): Before we see any real push upside, I’m expecting the price to sweep down first. Watch out for a move to clear the previous week's low (pwL) around $74.3k.
🔹 The Recovery Phase: Once that downside liquidity is grabbed, then I expect a solid push back up into the $79k–$80k region.
🎯 The Ultimate Deciding Zone:
The $79k level is my absolute line in the sand. What happens above $79k will tell us everything we need to know. It will give us the ultimate confirmation: Are we truly heading up for a massive monthly High (mH) sweep, or is the market setting up another rejection? #Bitcoin #BTC走势分析 #CryptoTradin g #technicalJafar #BinanceSquare
🔹 The First Move (The Sweep): Before we see any real push upside, I’m expecting the price to sweep down first. Watch out for a move to clear the previous week's low (pwL) around $74.3k.
🔹 The Recovery Phase: Once that downside liquidity is grabbed, then I expect a solid push back up into the $79k–$80k region.
🎯 The Ultimate Deciding Zone:
The $79k level is my absolute line in the sand. What happens above $79k will tell us everything we need to know. It will give us the ultimate confirmation: Are we truly heading up for a massive monthly High (mH) sweep, or is the market setting up another rejection? #Bitcoin #BTC走势分析 #CryptoTradin g #technicalJafar #BinanceSquare
197


Article
🚀 PIPPIN/USDT Analysis: Are we approaching a reversal point?After tracking price action across various timeframes, we can see that PIPPIN is at a pivotal stage. Here are the key points from a technical perspective:
📊 Technical reading:
RSI Indicator: We can see that the indicator has started to approach oversold regions on the higher timeframes, suggesting a weakening of the current bearish momentum and a potential formation of a "bottom" soon.
🚀 PIPPIN/USDT Analysis: Are we approaching a reversal point?
After tracking price action across various timeframes, we can see that PIPPIN is at a pivotal stage. Here are the key points from a technical perspective:
📊 Technical reading:
RSI Indicator: We can see that the indicator has started to approach oversold regions on the higher timeframes, suggesting a weakening of the current bearish momentum and a potential formation of a "bottom" soon.
📊 Technical reading:
RSI Indicator: We can see that the indicator has started to approach oversold regions on the higher timeframes, suggesting a weakening of the current bearish momentum and a potential formation of a "bottom" soon.
224

·
--

Article
Meme Coins: Is "Community" the True Fuel for the Market? 🚀To protect your portfolio and stay profitable on Binance, follow these essential rules:
Only invest what you can afford to lose: Never use funds needed for essentials.Always use Stop-Loss: Protect your capital by cutting losses before they become unrecoverable.Diversify your portfolio: Never put all your eggs in one basket.DYOR (Do Your Own Research): Never follow hype blindly; understand the project before buying.Control your emotions: Avoid panic selling during dips and greedy buying during pumps.
Bottom line: Successful trading is about discipline, not gambling. Trade smart!
#TrendingTopic #technicalJafar #Trump2024 #TMTG
$XRP $ETH $BNB
Meme Coins: Is "Community" the True Fuel for the Market? 🚀
To protect your portfolio and stay profitable on Binance, follow these essential rules:
Only invest what you can afford to lose: Never use funds needed for essentials.Always use Stop-Loss: Protect your capital by cutting losses before they become unrecoverable.Diversify your portfolio: Never put all your eggs in one basket.DYOR (Do Your Own Research): Never follow hype blindly; understand the project before buying.Control your emotions: Avoid panic selling during dips and greedy buying during pumps.
Bottom line: Successful trading is about discipline, not gambling. Trade smart!
#TrendingTopic #technicalJafar #Trump2024 #TMTG
$XRP $ETH $BNB
Only invest what you can afford to lose: Never use funds needed for essentials.Always use Stop-Loss: Protect your capital by cutting losses before they become unrecoverable.Diversify your portfolio: Never put all your eggs in one basket.DYOR (Do Your Own Research): Never follow hype blindly; understand the project before buying.Control your emotions: Avoid panic selling during dips and greedy buying during pumps.
Bottom line: Successful trading is about discipline, not gambling. Trade smart!
#TrendingTopic #technicalJafar #Trump2024 #TMTG
$XRP $ETH $BNB
3
146

SMART MONEY AT YOUR FINGERTIPS: HOW BIG PLAYERS MANIPULATE THE MARKET 🧠📈
The crowd is drawing support lines, but the big capital sees liquidity there. They need to make you sell to buy in at a better price.
• The market maker creates a sharp false impulse downwards and collects long positions' stop losses.
• Your stops are their fuel for buying. After this, the market makes a sharp reversal.
👇 Open the SOL widget. Do you see where Smart Money is currently collecting liquidity?
#technicalJafar
{spot}(ETHUSDT)
#TechnicalAnalysis #TradingTips #Solana $SOL #CryptoFREEMEN
SMART MONEY AT YOUR FINGERTIPS: HOW BIG PLAYERS MANIPULATE THE MARKET 🧠📈
The crowd is drawing support lines, but the big capital sees liquidity there. They need to make you sell to buy in at a better price.
• The market maker creates a sharp false impulse downwards and collects long positions' stop losses.
• Your stops are their fuel for buying. After this, the market makes a sharp reversal.
👇 Open the SOL widget. Do you see where Smart Money is currently collecting liquidity?
#technicalJafar
#TechnicalAnalysis #TradingTips #Solana $SOL #CryptoFREEMEN
The crowd is drawing support lines, but the big capital sees liquidity there. They need to make you sell to buy in at a better price.
• The market maker creates a sharp false impulse downwards and collects long positions' stop losses.
• Your stops are their fuel for buying. After this, the market makes a sharp reversal.
👇 Open the SOL widget. Do you see where Smart Money is currently collecting liquidity?
#technicalJafar
#TechnicalAnalysis #TradingTips #Solana $SOL #CryptoFREEMEN
381

·
--
Bearish
$GENIUS
{future}(GENIUSUSDT)
GENIUS/USDT Quick Analysis
📊 Market Status: Bearish (Short-Term)
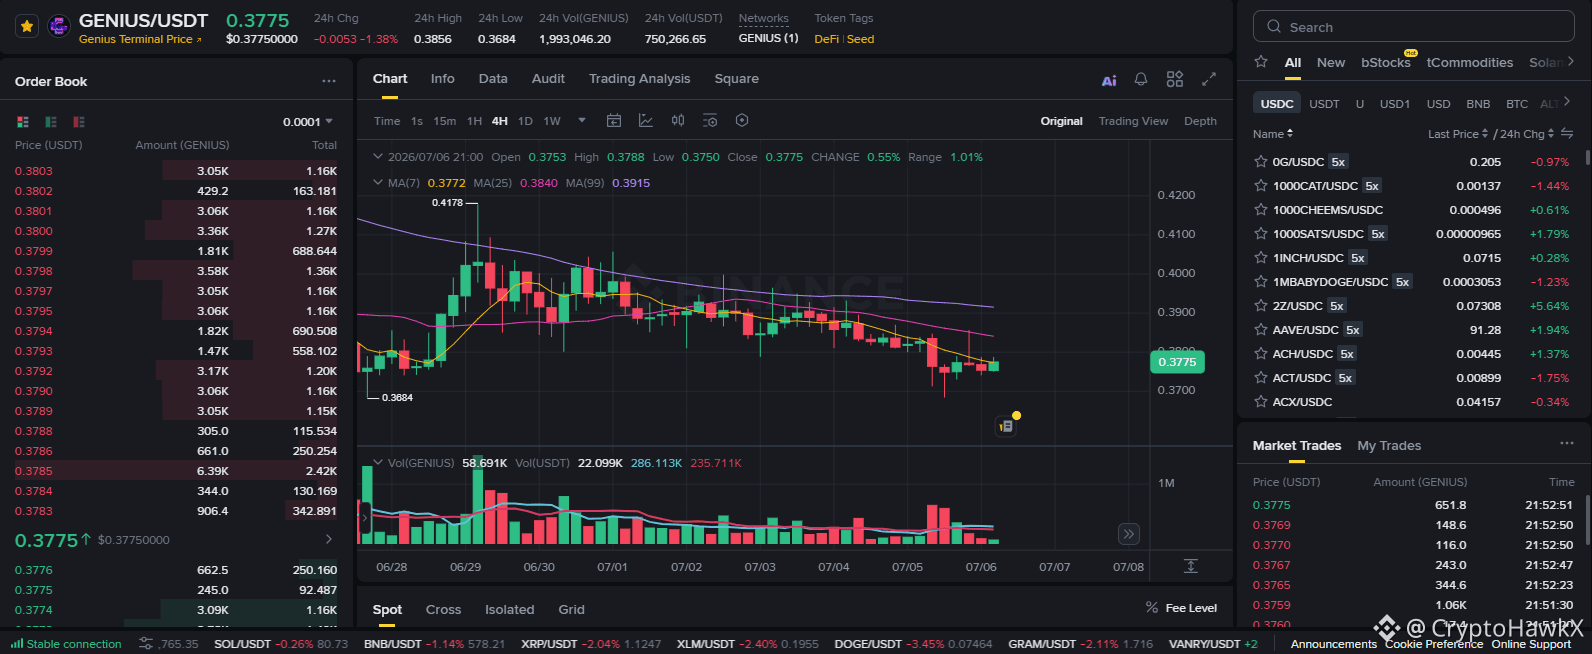
GENIUS is trading below its key moving averages, with lower highs and weak buying volume signaling bearish momentum. Buyers have not yet shown enough strength to reverse the current trend.
Key Levels:
🟢 Support: 0.3700 – 0.3650 🔴 Resistance: 0.3840 – 0.3920
Outlook: The trend remains bearish while the price stays below 0.3840. A break above this resistance could signal a recovery toward 0.3920, while losing 0.3700 may extend the decline.
#Geopolitics #cryptouniverseofficial #BinanceHerYerde #TrendingTopic #technicalJafar
$GENIUS
GENIUS/USDT Quick Analysis
📊 Market Status: Bearish (Short-Term)
GENIUS is trading below its key moving averages, with lower highs and weak buying volume signaling bearish momentum. Buyers have not yet shown enough strength to reverse the current trend.
Key Levels:
🟢 Support: 0.3700 – 0.3650 🔴 Resistance: 0.3840 – 0.3920
Outlook: The trend remains bearish while the price stays below 0.3840. A break above this resistance could signal a recovery toward 0.3920, while losing 0.3700 may extend the decline.
#Geopolitics #cryptouniverseofficial #BinanceHerYerde #TrendingTopic #technicalJafar
GENIUS/USDT Quick Analysis
📊 Market Status: Bearish (Short-Term)
GENIUS is trading below its key moving averages, with lower highs and weak buying volume signaling bearish momentum. Buyers have not yet shown enough strength to reverse the current trend.
Key Levels:
🟢 Support: 0.3700 – 0.3650 🔴 Resistance: 0.3840 – 0.3920
Outlook: The trend remains bearish while the price stays below 0.3840. A break above this resistance could signal a recovery toward 0.3920, while losing 0.3700 may extend the decline.
#Geopolitics #cryptouniverseofficial #BinanceHerYerde #TrendingTopic #technicalJafar
220
·
--
Bearish
$ADA
{future}(ADAUSDT)
📊 ADA/USDT Market Analysis
Market Structure: Bearish 🔴
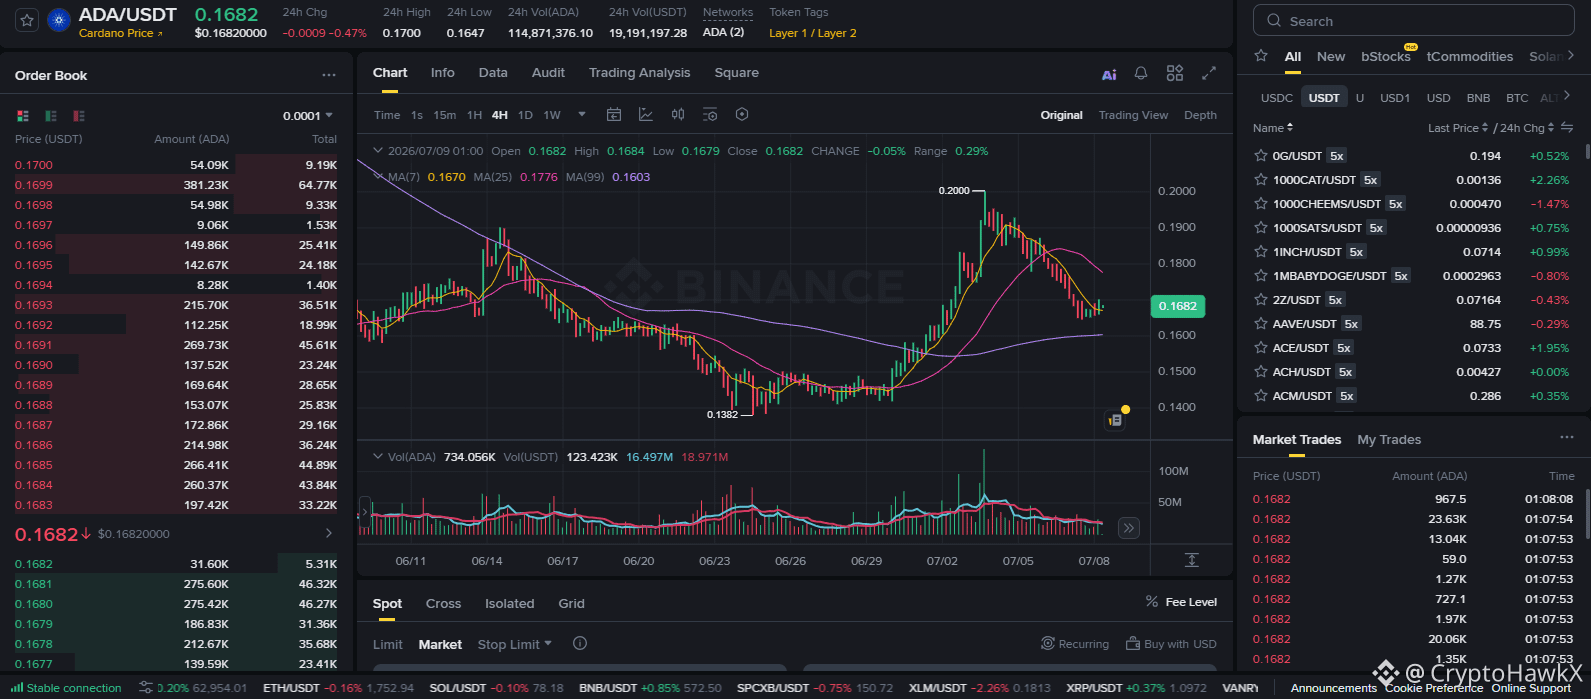
ADA remains in a lower high and lower low structure on the 4H chart after rejecting from the recent peak. Price is trading below the 25 MA while the 99 MA still acts as long-term support. As long as $0.178 remains resistance, bears have the edge. A loss of $0.160 could trigger another move lower.
This is my personal market view, not financial advice.
#ad #ADABullish #cryptouniverseofficial #technicalJafar #BearMarke
$ADA
📊 ADA/USDT Market Analysis
Market Structure: Bearish 🔴
ADA remains in a lower high and lower low structure on the 4H chart after rejecting from the recent peak. Price is trading below the 25 MA while the 99 MA still acts as long-term support. As long as $0.178 remains resistance, bears have the edge. A loss of $0.160 could trigger another move lower.
This is my personal market view, not financial advice.
#ad #ADABullish #cryptouniverseofficial #technicalJafar #BearMarke
📊 ADA/USDT Market Analysis
Market Structure: Bearish 🔴
ADA remains in a lower high and lower low structure on the 4H chart after rejecting from the recent peak. Price is trading below the 25 MA while the 99 MA still acts as long-term support. As long as $0.178 remains resistance, bears have the edge. A loss of $0.160 could trigger another move lower.
This is my personal market view, not financial advice.
#ad #ADABullish #cryptouniverseofficial #technicalJafar #BearMarke
129

·
--
Bullish
$LUNC is Loading... Time to Watch Closely! 👀👇
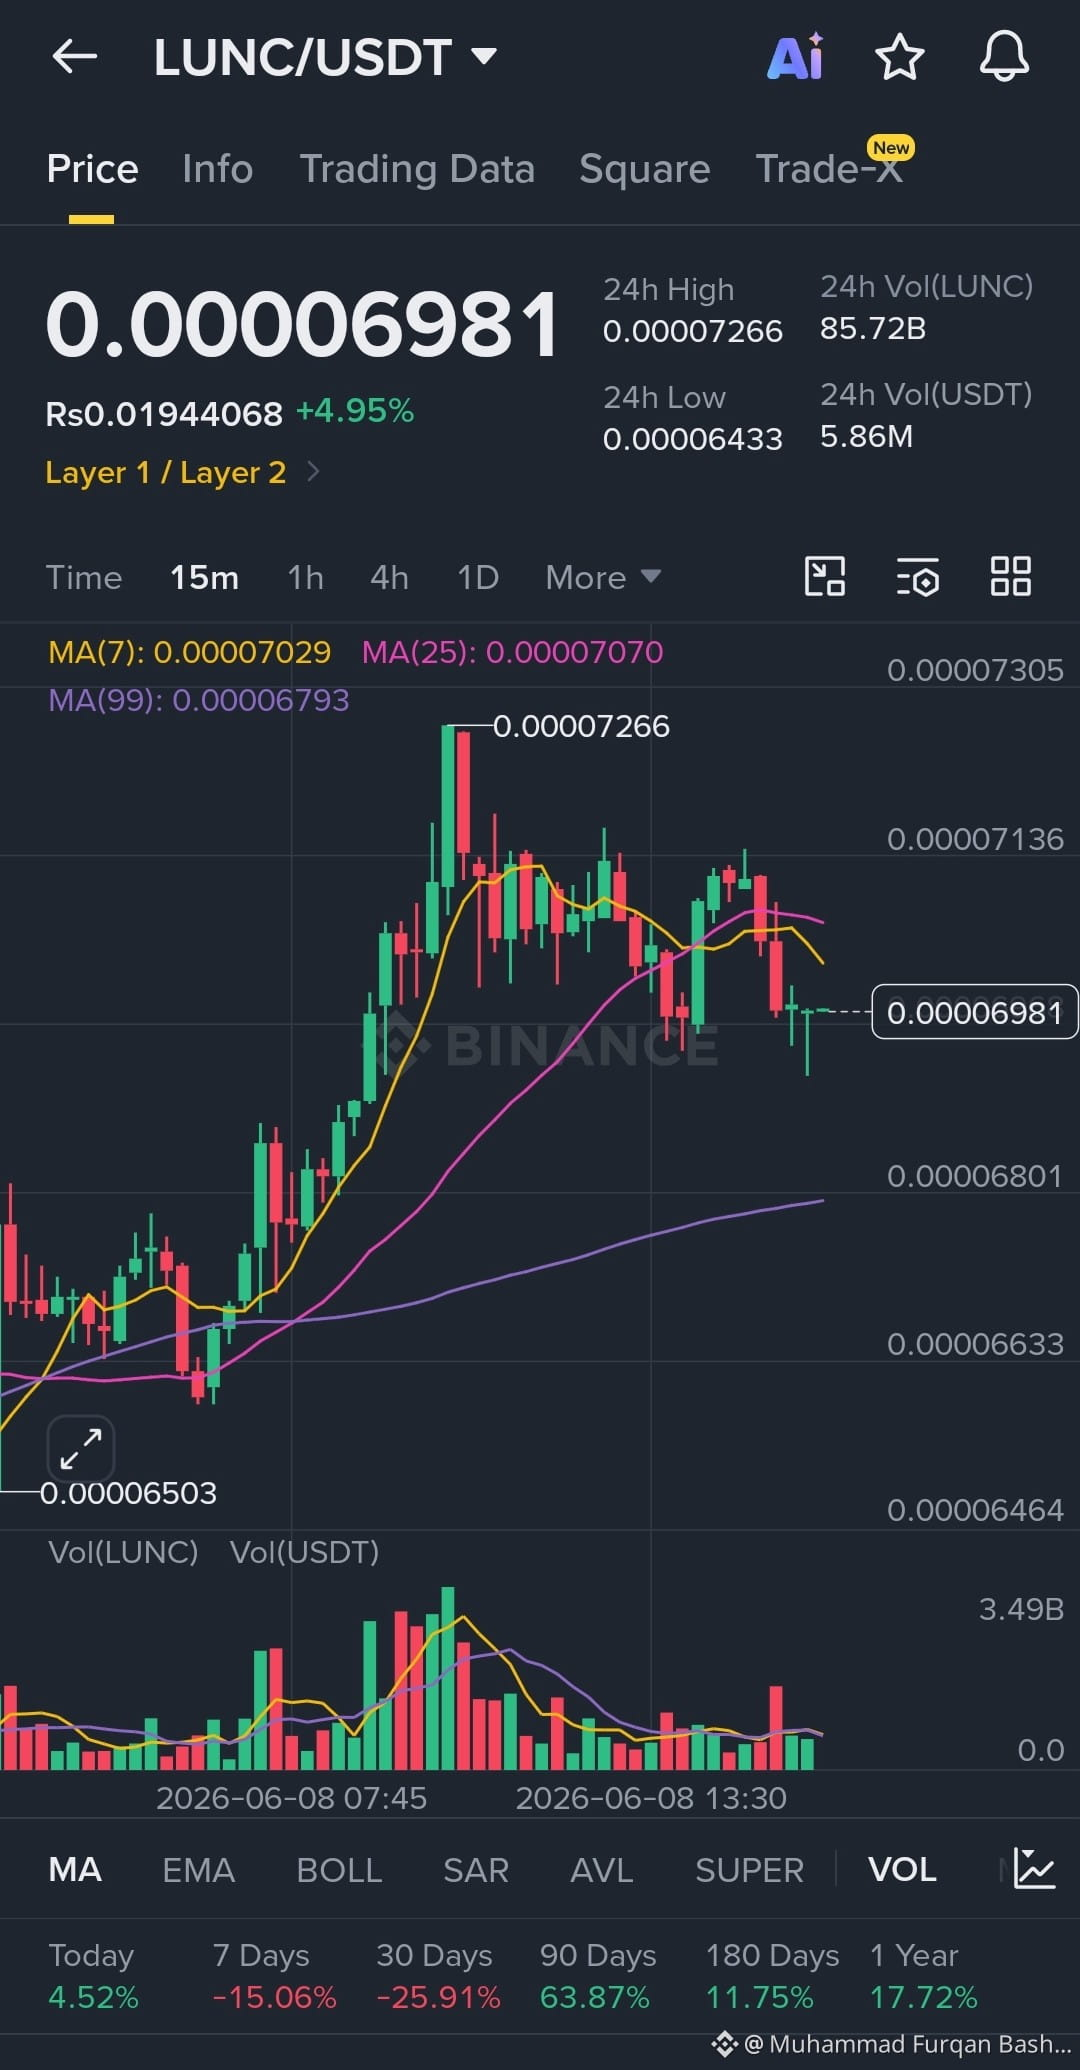
Looking at the 15m chart, $LUNC is showing some interesting short-term moves. After hitting a 24h high of 0.00007266, it has pulled back nicely to around 0.00006981.
Why this looks like a potential BUY opportunity:
Healthy Pullback: The price has cooled down and is currently testing the MA(99) (purple line around 0.00006793) as a strong support base.
Dip Buying Zone: This current area (0.00006800 - 0.00006950) looks like a solid spot to accumulate for a quick short-term bounce.
🎯 Targets & Risk Management:
Targets: Looking for a retest back to 0.00007150 and 0.00007260+.
Stop Loss: Keep a tight stop loss just below the MA(99) around 0.00006750 to stay safe!
It's up nearly +5% today, and if volume kicks in again, we could see another quick leg up. Always manage your risk!
What’s your move? Buying the dip or waiting? Let’s talk in the comments!
#LUNC✅ #cryptouniverseofficial #BuyTheDip #technicalJafar #BinanceSquareTalks
$LUNC is Loading... Time to Watch Closely! 👀👇
Looking at the 15m chart, $LUNC is showing some interesting short-term moves. After hitting a 24h high of 0.00007266, it has pulled back nicely to around 0.00006981.
Why this looks like a potential BUY opportunity:
Healthy Pullback: The price has cooled down and is currently testing the MA(99) (purple line around 0.00006793) as a strong support base.
Dip Buying Zone: This current area (0.00006800 - 0.00006950) looks like a solid spot to accumulate for a quick short-term bounce.
🎯 Targets & Risk Management:
Targets: Looking for a retest back to 0.00007150 and 0.00007260+.
Stop Loss: Keep a tight stop loss just below the MA(99) around 0.00006750 to stay safe!
It's up nearly +5% today, and if volume kicks in again, we could see another quick leg up. Always manage your risk!
What’s your move? Buying the dip or waiting? Let’s talk in the comments!
#LUNC✅ #cryptouniverseofficial #BuyTheDip #technicalJafar #BinanceSquareTalks
Looking at the 15m chart, $LUNC is showing some interesting short-term moves. After hitting a 24h high of 0.00007266, it has pulled back nicely to around 0.00006981.
Why this looks like a potential BUY opportunity:
Healthy Pullback: The price has cooled down and is currently testing the MA(99) (purple line around 0.00006793) as a strong support base.
Dip Buying Zone: This current area (0.00006800 - 0.00006950) looks like a solid spot to accumulate for a quick short-term bounce.
🎯 Targets & Risk Management:
Targets: Looking for a retest back to 0.00007150 and 0.00007260+.
Stop Loss: Keep a tight stop loss just below the MA(99) around 0.00006750 to stay safe!
It's up nearly +5% today, and if volume kicks in again, we could see another quick leg up. Always manage your risk!
What’s your move? Buying the dip or waiting? Let’s talk in the comments!
#LUNC✅ #cryptouniverseofficial #BuyTheDip #technicalJafar #BinanceSquareTalks
3
540

·
--
Bullish
📈 ESP/USDT | Technical Opportunity Under the Microscope
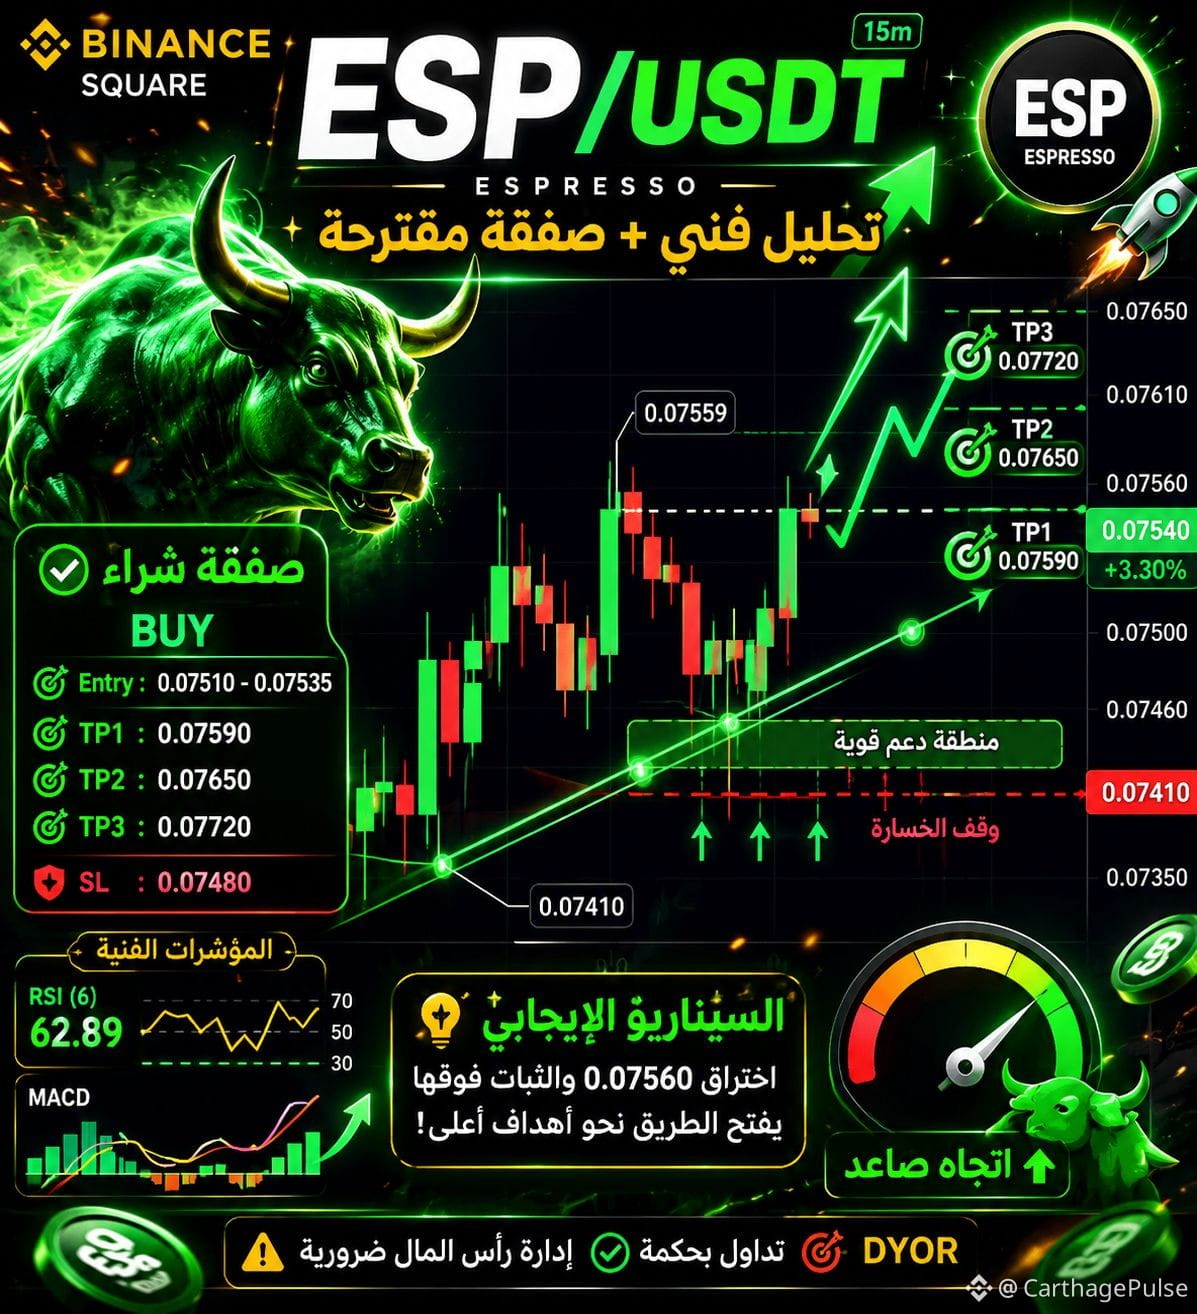
🚀 ESP continues to show clear buying strength after a successful bounce from support zones, with bulls attempting to break through the key resistance at 0.07560.
🟢 Buy Trade (BUY) 🔹 Entry: 0.07510 - 0.07535
🎯 TP1: 0.07590
🎯 TP2: 0.07650
🎯 TP3: 0.07720
🛑 SL: 0.07480
📊 Technical Indicators ✅ RSI above 60 supports the continuation of the upward momentum.
✅ MACD is positive with a gradual improvement in buying strength.
✅ Maintaining trading above 0.07500 enhances the chances of further upside.
⚠️ Risk Management Breaking below 0.07480 could change the scenario towards a deeper correction, so sticking to the stop-loss is essential.
🔥 Summary A breakout above 0.07560 and holding above it could be the spark that drives the price towards higher targets in the coming hours.
#EarnFreeCrypto2024 #ESP #Binance # #technicalJafar $ESP
{future}(ESPUSDT)
$HOME
{future}(HOMEUSDT)
$JTO
{future}(JTOUSDT)
#altcoins # 📈🐂🔥
📈 ESP/USDT | Technical Opportunity Under the Microscope
🚀 ESP continues to show clear buying strength after a successful bounce from support zones, with bulls attempting to break through the key resistance at 0.07560.
🟢 Buy Trade (BUY) 🔹 Entry: 0.07510 - 0.07535
🎯 TP1: 0.07590
🎯 TP2: 0.07650
🎯 TP3: 0.07720
🛑 SL: 0.07480
📊 Technical Indicators ✅ RSI above 60 supports the continuation of the upward momentum.
✅ MACD is positive with a gradual improvement in buying strength.
✅ Maintaining trading above 0.07500 enhances the chances of further upside.
⚠️ Risk Management Breaking below 0.07480 could change the scenario towards a deeper correction, so sticking to the stop-loss is essential.
🔥 Summary A breakout above 0.07560 and holding above it could be the spark that drives the price towards higher targets in the coming hours.
#EarnFreeCrypto2024 #ESP #Binance # #technicalJafar $ESP
$HOME
$JTO
#altcoins # 📈🐂🔥
🚀 ESP continues to show clear buying strength after a successful bounce from support zones, with bulls attempting to break through the key resistance at 0.07560.
🟢 Buy Trade (BUY) 🔹 Entry: 0.07510 - 0.07535
🎯 TP1: 0.07590
🎯 TP2: 0.07650
🎯 TP3: 0.07720
🛑 SL: 0.07480
📊 Technical Indicators ✅ RSI above 60 supports the continuation of the upward momentum.
✅ MACD is positive with a gradual improvement in buying strength.
✅ Maintaining trading above 0.07500 enhances the chances of further upside.
⚠️ Risk Management Breaking below 0.07480 could change the scenario towards a deeper correction, so sticking to the stop-loss is essential.
🔥 Summary A breakout above 0.07560 and holding above it could be the spark that drives the price towards higher targets in the coming hours.
#EarnFreeCrypto2024 #ESP #Binance # #technicalJafar $ESP
$HOME
$JTO
#altcoins # 📈🐂🔥
96
·
--
Bullish
$SOMI
{future}(SOMIUSDT)
📈 SOMI/USDT Market Update
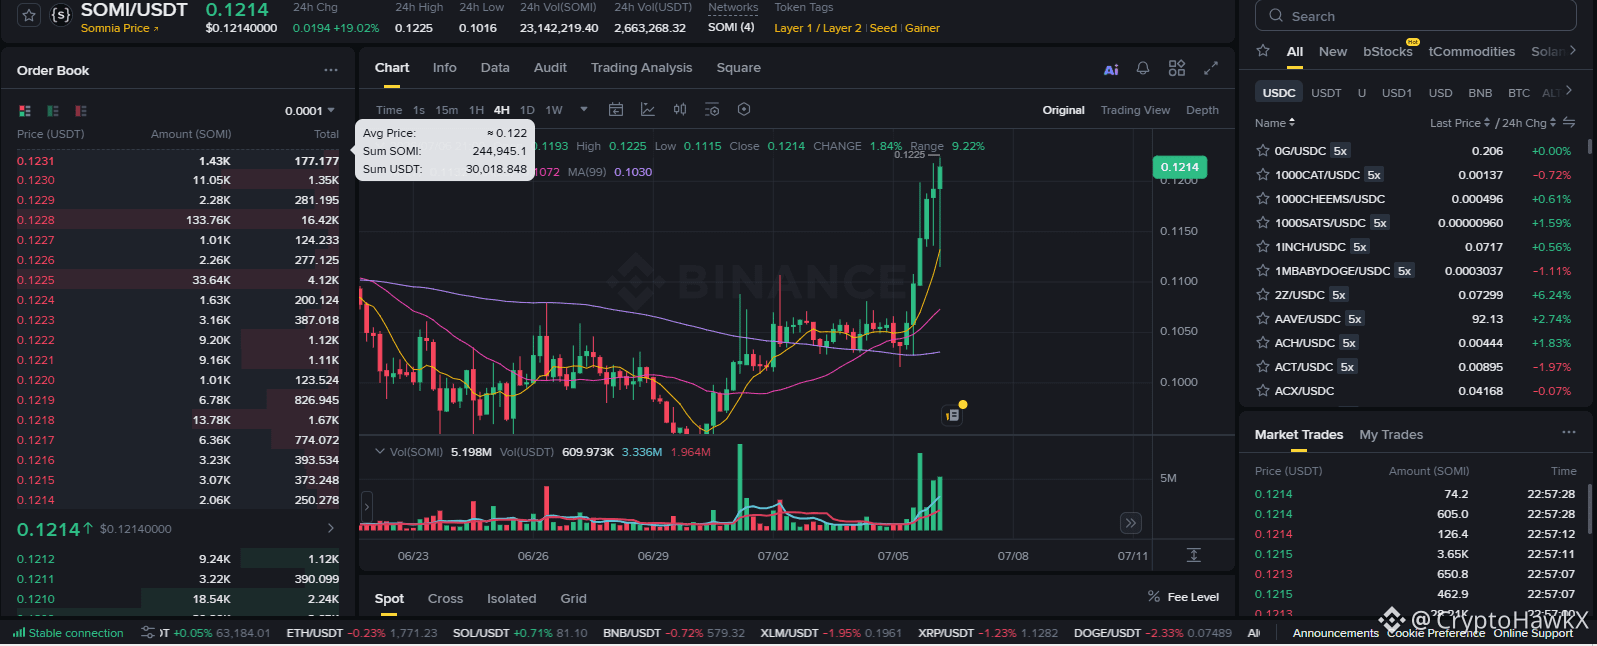
SOMI is showing strong bullish momentum, breaking above recent resistance with rising volume. The trend remains positive as long as buyers defend the breakout zone.
📊 Bias: Bullish
🔑 Watch: Holding above current support could lead to further upside. A loss of momentum may trigger a healthy pullback before the next move.
Trade smart and always use proper risk management.
#solana #cryptouniverseofficial #KOSPIFalls8%TriggersCircuitBreaker #BullRunAhead #technicalJafar
$SOMI
📈 SOMI/USDT Market Update
SOMI is showing strong bullish momentum, breaking above recent resistance with rising volume. The trend remains positive as long as buyers defend the breakout zone.
📊 Bias: Bullish
🔑 Watch: Holding above current support could lead to further upside. A loss of momentum may trigger a healthy pullback before the next move.
Trade smart and always use proper risk management.
#solana #cryptouniverseofficial #KOSPIFalls8%TriggersCircuitBreaker #BullRunAhead #technicalJafar
📈 SOMI/USDT Market Update
SOMI is showing strong bullish momentum, breaking above recent resistance with rising volume. The trend remains positive as long as buyers defend the breakout zone.
📊 Bias: Bullish
🔑 Watch: Holding above current support could lead to further upside. A loss of momentum may trigger a healthy pullback before the next move.
Trade smart and always use proper risk management.
#solana #cryptouniverseofficial #KOSPIFalls8%TriggersCircuitBreaker #BullRunAhead #technicalJafar
124

the value of $ICP is projected to increase by 5%, potentially reaching $2.22 by the end of this week
{future}(ICPUSDT)
CoinCodex and InvestingHaven provide technical forecasts suggesting that while $100-$200 is a realistic target for the 2025-2026 bull cycle, the $1,000 mark may require a longer horizon, likely between 2030 and 2035.
#SKHynixCompletesRecordUSListing #SP500EndsJustBelowRecord #Bitcoin❗ #technicalJafar
the value of $ICP is projected to increase by 5%, potentially reaching $2.22 by the end of this week
CoinCodex and InvestingHaven provide technical forecasts suggesting that while $100-$200 is a realistic target for the 2025-2026 bull cycle, the $1,000 mark may require a longer horizon, likely between 2030 and 2035.
#SKHynixCompletesRecordUSListing #SP500EndsJustBelowRecord #Bitcoin❗ #technicalJafar
CoinCodex and InvestingHaven provide technical forecasts suggesting that while $100-$200 is a realistic target for the 2025-2026 bull cycle, the $1,000 mark may require a longer horizon, likely between 2030 and 2035.
#SKHynixCompletesRecordUSListing #SP500EndsJustBelowRecord #Bitcoin❗ #technicalJafar

1
131

·
--
Bullish
$LINK.US LINK/USDT Analysis – Bullish 🟢
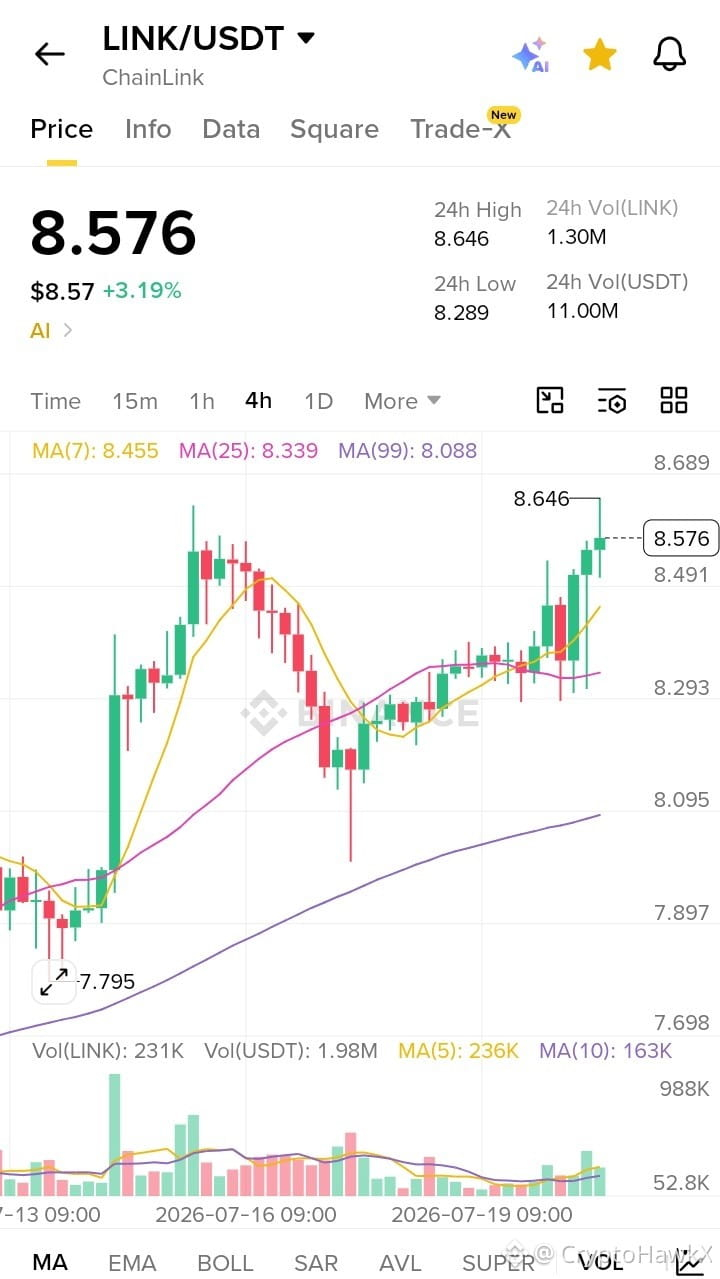
LINK/USDT is showing strong bullish momentum on the 4H timeframe. The price is trading above the MA(7), MA(25), and MA(99), confirming a healthy uptrend. Buyers have pushed LINK to a recent high of 8.646, with increasing momentum and strong candle structure.
As long as the price holds above the 8.45–8.35 support zone, the bullish trend remains intact. A successful breakout above 8.65 could lead to the next move toward the 8.80–9.00 resistance area. A drop below key support may trigger a short-term pullback, but the overall trend still favors the bulls.
Overall Sentiment: Bullish 🟢
#LINK #LINKUSDT #Chainlink #Crypto #CryptoTrading #BinanceHerYerde nce #Altcoins #technicalJafar lAnalysis #Bullish #Trading #CryptoMarketSentiment #PriceActionAnalysis ion #SupportAndResistance #SwingTrading
$LINK.US LINK/USDT Analysis – Bullish 🟢
LINK/USDT is showing strong bullish momentum on the 4H timeframe. The price is trading above the MA(7), MA(25), and MA(99), confirming a healthy uptrend. Buyers have pushed LINK to a recent high of 8.646, with increasing momentum and strong candle structure.
As long as the price holds above the 8.45–8.35 support zone, the bullish trend remains intact. A successful breakout above 8.65 could lead to the next move toward the 8.80–9.00 resistance area. A drop below key support may trigger a short-term pullback, but the overall trend still favors the bulls.
Overall Sentiment: Bullish 🟢
#LINK #LINKUSDT #Chainlink #Crypto #CryptoTrading #BinanceHerYerde nce #Altcoins #technicalJafar lAnalysis #Bullish #Trading #CryptoMarketSentiment #PriceActionAnalysis ion #SupportAndResistance #SwingTrading
LINK/USDT is showing strong bullish momentum on the 4H timeframe. The price is trading above the MA(7), MA(25), and MA(99), confirming a healthy uptrend. Buyers have pushed LINK to a recent high of 8.646, with increasing momentum and strong candle structure.
As long as the price holds above the 8.45–8.35 support zone, the bullish trend remains intact. A successful breakout above 8.65 could lead to the next move toward the 8.80–9.00 resistance area. A drop below key support may trigger a short-term pullback, but the overall trend still favors the bulls.
Overall Sentiment: Bullish 🟢
#LINK #LINKUSDT #Chainlink #Crypto #CryptoTrading #BinanceHerYerde nce #Altcoins #technicalJafar lAnalysis #Bullish #Trading #CryptoMarketSentiment #PriceActionAnalysis ion #SupportAndResistance #SwingTrading
49

🚨 Bitcoin Trading Setup: Is a SHORT Opportunity Forming?
Bitcoin (BTC) is trading near a key resisWriting
🚨 Bitcoin Trading Setup: Is a SHORT Opportunity Forming?
Bitcoins$AAPL.US (BTC) is trading near a key resistance zone, and many traders are closely watching for the next major move. While the overall market remains active, price action suggests that caution is important.
Trading Plan
Asset: Bitcoin (BTC)
Bias: Short (Only if confirmation appears)
Flow Chart
Price reaches resistance
│
▼
Wait for bearish confirmation
│
├── ❌ No confirmation → Stay out
│
▼
✅ Confirmation appears
│
▼
Open SHORT with risk management
│
▼
Take partial profits at support levels
│
▼
Move Stop Loss to Break-even
Risk Management
Never risk more than 1–2% of your capital on a single trade.
Always use a Stop Loss.
Avoid emotional trading.
Follow your trading plan and avoid FOMO.
Final Thoughts
The crypto market is highly volatile. A SHORT setup should only be considered after technical confirmation rather than anticipation. Good traders focus on discipline and risk management instead of guessing market direction.
What do you think? 📉 Will Bitcoin reject from resistance, or will it break out higher? Share your opinion below!
#Bitcoin #BTC #Crypto #Trading #BinanceSquare #technicalJafar calAnalysis #RiskManagement #dyor
🚨 Bitcoin Trading Setup: Is a SHORT Opportunity Forming? Bitcoin (BTC) is trading near a key resis
Writing
🚨 Bitcoin Trading Setup: Is a SHORT Opportunity Forming?
Bitcoins$AAPL.US (BTC) is trading near a key resistance zone, and many traders are closely watching for the next major move. While the overall market remains active, price action suggests that caution is important.
Trading Plan
Asset: Bitcoin (BTC)
Bias: Short (Only if confirmation appears)
Flow Chart
Price reaches resistance
│
▼
Wait for bearish confirmation
│
├── ❌ No confirmation → Stay out
│
▼
✅ Confirmation appears
│
▼
Open SHORT with risk management
│
▼
Take partial profits at support levels
│
▼
Move Stop Loss to Break-even
Risk Management
Never risk more than 1–2% of your capital on a single trade.
Always use a Stop Loss.
Avoid emotional trading.
Follow your trading plan and avoid FOMO.
Final Thoughts
The crypto market is highly volatile. A SHORT setup should only be considered after technical confirmation rather than anticipation. Good traders focus on discipline and risk management instead of guessing market direction.
What do you think? 📉 Will Bitcoin reject from resistance, or will it break out higher? Share your opinion below!
#Bitcoin #BTC #Crypto #Trading #BinanceSquare #technicalJafar calAnalysis #RiskManagement #dyor
🚨 Bitcoin Trading Setup: Is a SHORT Opportunity Forming?
Bitcoins$AAPL.US (BTC) is trading near a key resistance zone, and many traders are closely watching for the next major move. While the overall market remains active, price action suggests that caution is important.
Trading Plan
Asset: Bitcoin (BTC)
Bias: Short (Only if confirmation appears)
Flow Chart
Price reaches resistance
│
▼
Wait for bearish confirmation
│
├── ❌ No confirmation → Stay out
│
▼
✅ Confirmation appears
│
▼
Open SHORT with risk management
│
▼
Take partial profits at support levels
│
▼
Move Stop Loss to Break-even
Risk Management
Never risk more than 1–2% of your capital on a single trade.
Always use a Stop Loss.
Avoid emotional trading.
Follow your trading plan and avoid FOMO.
Final Thoughts
The crypto market is highly volatile. A SHORT setup should only be considered after technical confirmation rather than anticipation. Good traders focus on discipline and risk management instead of guessing market direction.
What do you think? 📉 Will Bitcoin reject from resistance, or will it break out higher? Share your opinion below!
#Bitcoin #BTC #Crypto #Trading #BinanceSquare #technicalJafar calAnalysis #RiskManagement #dyor
1
95

·
--
https://www.binance.com/activity/referral-entry/CPA?ref=CPA_00U4Q681WA 📊 XRP/USDT — 1H Technical Analysis
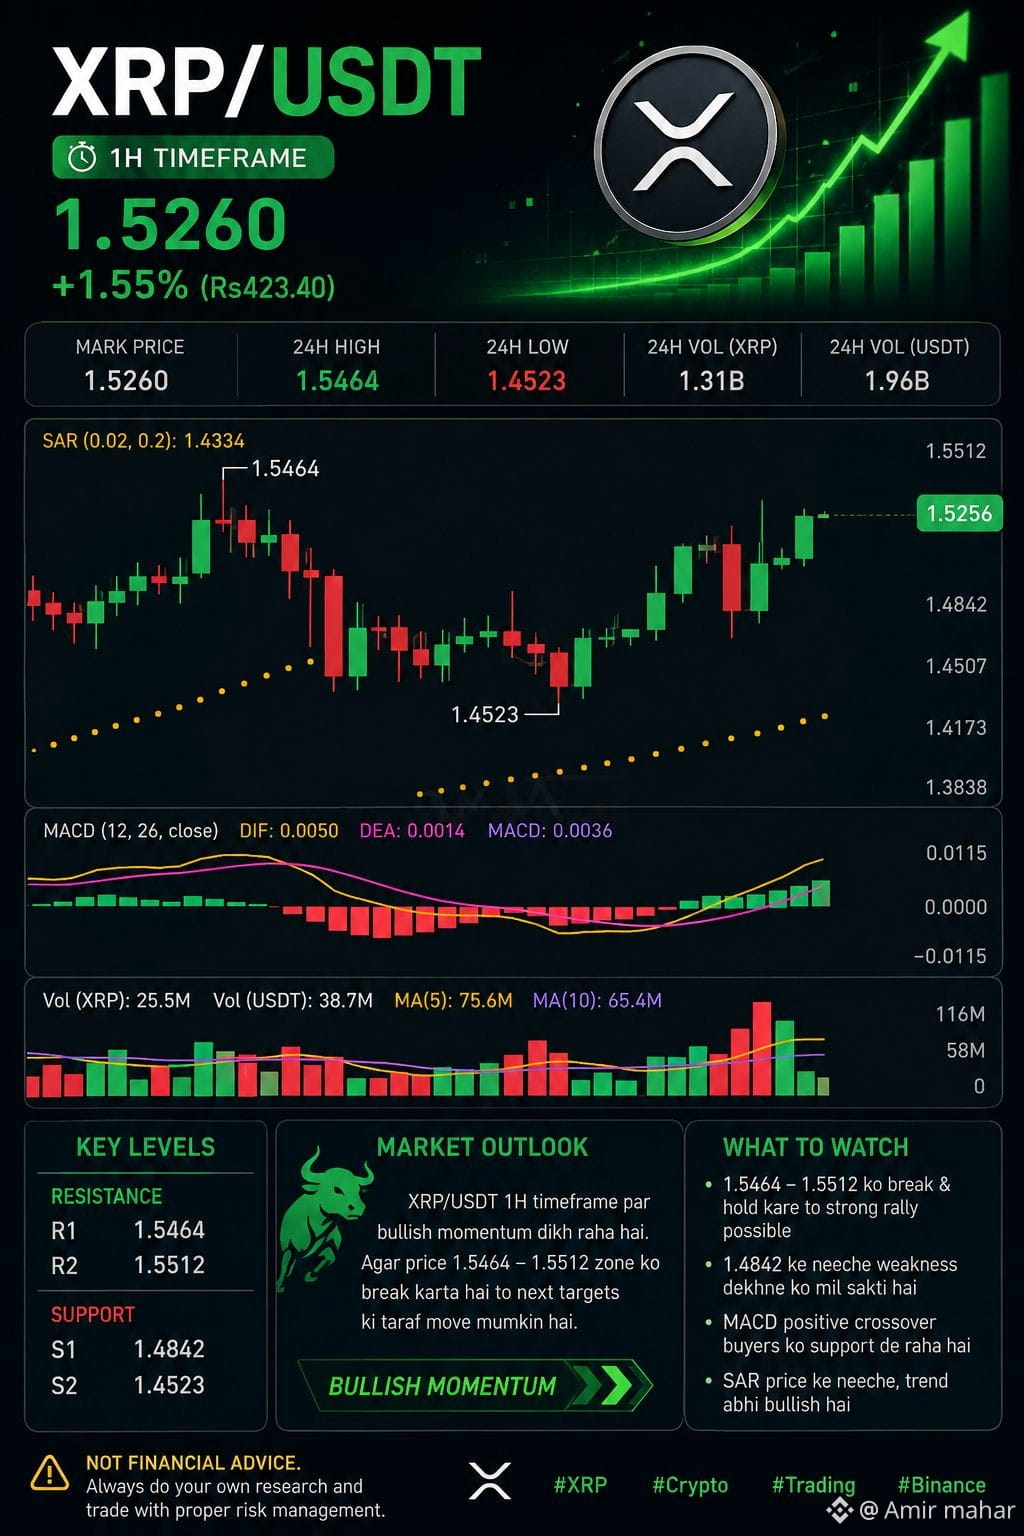
XRP is currently trading around 1.5260 and shows bullish momentum in the short term on the chart. 📈
🔹 Resistance: 1.5464 → 1.5512
🔹 Support: $NVDAB 1.4842 → 1.4523
🔹 MACD: positive, buying momentum improving
🔹 SAR: below the price, indicating a bullish trend
🔹 24H Change: +1.55%
If XRP strongly breaks the 1.5464–1.5512 zone, further upside may be possible. On the other hand, weakness could appear below 1.4842.
⚠️ Not Financial Advice — Trade with proper risk management & stop-loss.
#XRP #XRPUSDT SDT #Crypto_Jobs🎯 ypto #Trading #technicalJafar icalAnalysis #Binance #ALTCOİNS
https://www.binance.com/activity/referral-entry/CPA?ref=CPA_00U4Q681WA 📊 XRP/USDT — 1H Technical Analysis
XRP is currently trading around 1.5260 and shows bullish momentum in the short term on the chart. 📈
🔹 Resistance: 1.5464 → 1.5512
🔹 Support: $NVDAB 1.4842 → 1.4523
🔹 MACD: positive, buying momentum improving
🔹 SAR: below the price, indicating a bullish trend
🔹 24H Change: +1.55%
If XRP strongly breaks the 1.5464–1.5512 zone, further upside may be possible. On the other hand, weakness could appear below 1.4842.
⚠️ Not Financial Advice — Trade with proper risk management & stop-loss.
#XRP #XRPUSDT SDT #Crypto_Jobs🎯 ypto #Trading #technicalJafar icalAnalysis #Binance #ALTCOİNS
XRP is currently trading around 1.5260 and shows bullish momentum in the short term on the chart. 📈
🔹 Resistance: 1.5464 → 1.5512
🔹 Support: $NVDAB 1.4842 → 1.4523
🔹 MACD: positive, buying momentum improving
🔹 SAR: below the price, indicating a bullish trend
🔹 24H Change: +1.55%
If XRP strongly breaks the 1.5464–1.5512 zone, further upside may be possible. On the other hand, weakness could appear below 1.4842.
⚠️ Not Financial Advice — Trade with proper risk management & stop-loss.
#XRP #XRPUSDT SDT #Crypto_Jobs🎯 ypto #Trading #technicalJafar icalAnalysis #Binance #ALTCOİNS
94
Log in to explore more content
Join global crypto users on Binance Square
⚡️ Get latest and useful information about crypto.
💬 Trusted by the world’s largest crypto exchange.
👍 Discover real insights from verified creators.
Email / Phone number
Trending Topics
1
#NvidiaLoses$2.7TrillionInMonthAndAHalf
30,576 views
166 Discussing
2
#CanBTCReboundAfterFallingBelow60K?
868,709 views
3,226 Discussing
3
#GlobalStocksFaceLongestLosingStreakSince2023
332,258 views
2,167 Discussing
4
#BlackRockIBITPostsRecord$541MSingleDayOutflow
42,754 views
120 Discussing
5
#AnthropicPlungesTowardIPOPriceonDay2
170,435 views
1,323 Discussing
6
#TwentyOneCapitalAdds172.25BTC
79,489 views
762 Discussing
7
#HKBillWouldExcludeTokenizedDepositsFromVirtualAssets
11,521 views
56 Discussing
8
#BNBDropsBelow540USDTWith8.46%DailyDecline
89,451 views
714 Discussing
9
#HKBillProposesHK$100KFineForUnauthorizedCryptoTitles
3,132 views
29 Discussing
10
#BitMineFaces$10.1BUnrealizedETHLoss
6,284 views
32 Discussing