
BLOCKMACRO
68 Posts

BLOCKMACRO
Report
Block User
Crypto Analyst | BTC, ETH & Altcoins | Macroeconomics, Stocks & Indices | Institutional Flows | Data-Driven Market Insights.
81 Following
25 Followers
36 Liked
Posts
All
Quotes
PINNED
·
--
🚀 WELCOME TO BLOCKMACRO
Beyond Crypto. Understanding the Forces.
Financial markets are interconnected. And crypto doesn't move in isolation.
At BLOCKMACRO, we go beyond price charts to explore the forces shaping the cryptocurrency market.
📊 What we cover:
₿ Bitcoin & Ethereum
🌐 Altcoins & Emerging Crypto Trends
🏦 Institutional Flows & Bitcoin ETFs
📈 Macroeconomics & Federal Reserve Policy
📉 US Stocks, Nasdaq & Global Indices
💧 Global Liquidity & Market Sentiment
🐋 On-Chain Data & Whale Activity
Our mission is simple:
Understand WHY the market moves, identify WHAT drives it, and explore WHAT could happen next.
No hype. No empty promises. Just research, analysis, and market intelligence.
Follow BLOCKMACRO. Let's decode the crypto market together.
#BLOCKMACRO #Bitcoin #Crypto #Macroeconomics #BTC
🚀 WELCOME TO BLOCKMACRO
Beyond Crypto. Understanding the Forces.
Financial markets are interconnected. And crypto doesn't move in isolation.
At BLOCKMACRO, we go beyond price charts to explore the forces shaping the cryptocurrency market.
📊 What we cover:
₿ Bitcoin & Ethereum
🌐 Altcoins & Emerging Crypto Trends
🏦 Institutional Flows & Bitcoin ETFs
📈 Macroeconomics & Federal Reserve Policy
📉 US Stocks, Nasdaq & Global Indices
💧 Global Liquidity & Market Sentiment
🐋 On-Chain Data & Whale Activity
Our mission is simple:
Understand WHY the market moves, identify WHAT drives it, and explore WHAT could happen next.
No hype. No empty promises. Just research, analysis, and market intelligence.
Follow BLOCKMACRO. Let's decode the crypto market together.
#BLOCKMACRO #Bitcoin #Crypto #Macroeconomics #BTC
Beyond Crypto. Understanding the Forces.
Financial markets are interconnected. And crypto doesn't move in isolation.
At BLOCKMACRO, we go beyond price charts to explore the forces shaping the cryptocurrency market.
📊 What we cover:
₿ Bitcoin & Ethereum
🌐 Altcoins & Emerging Crypto Trends
🏦 Institutional Flows & Bitcoin ETFs
📈 Macroeconomics & Federal Reserve Policy
📉 US Stocks, Nasdaq & Global Indices
💧 Global Liquidity & Market Sentiment
🐋 On-Chain Data & Whale Activity
Our mission is simple:
Understand WHY the market moves, identify WHAT drives it, and explore WHAT could happen next.
No hype. No empty promises. Just research, analysis, and market intelligence.
Follow BLOCKMACRO. Let's decode the crypto market together.
#BLOCKMACRO #Bitcoin #Crypto #Macroeconomics #BTC

1
150
·
--
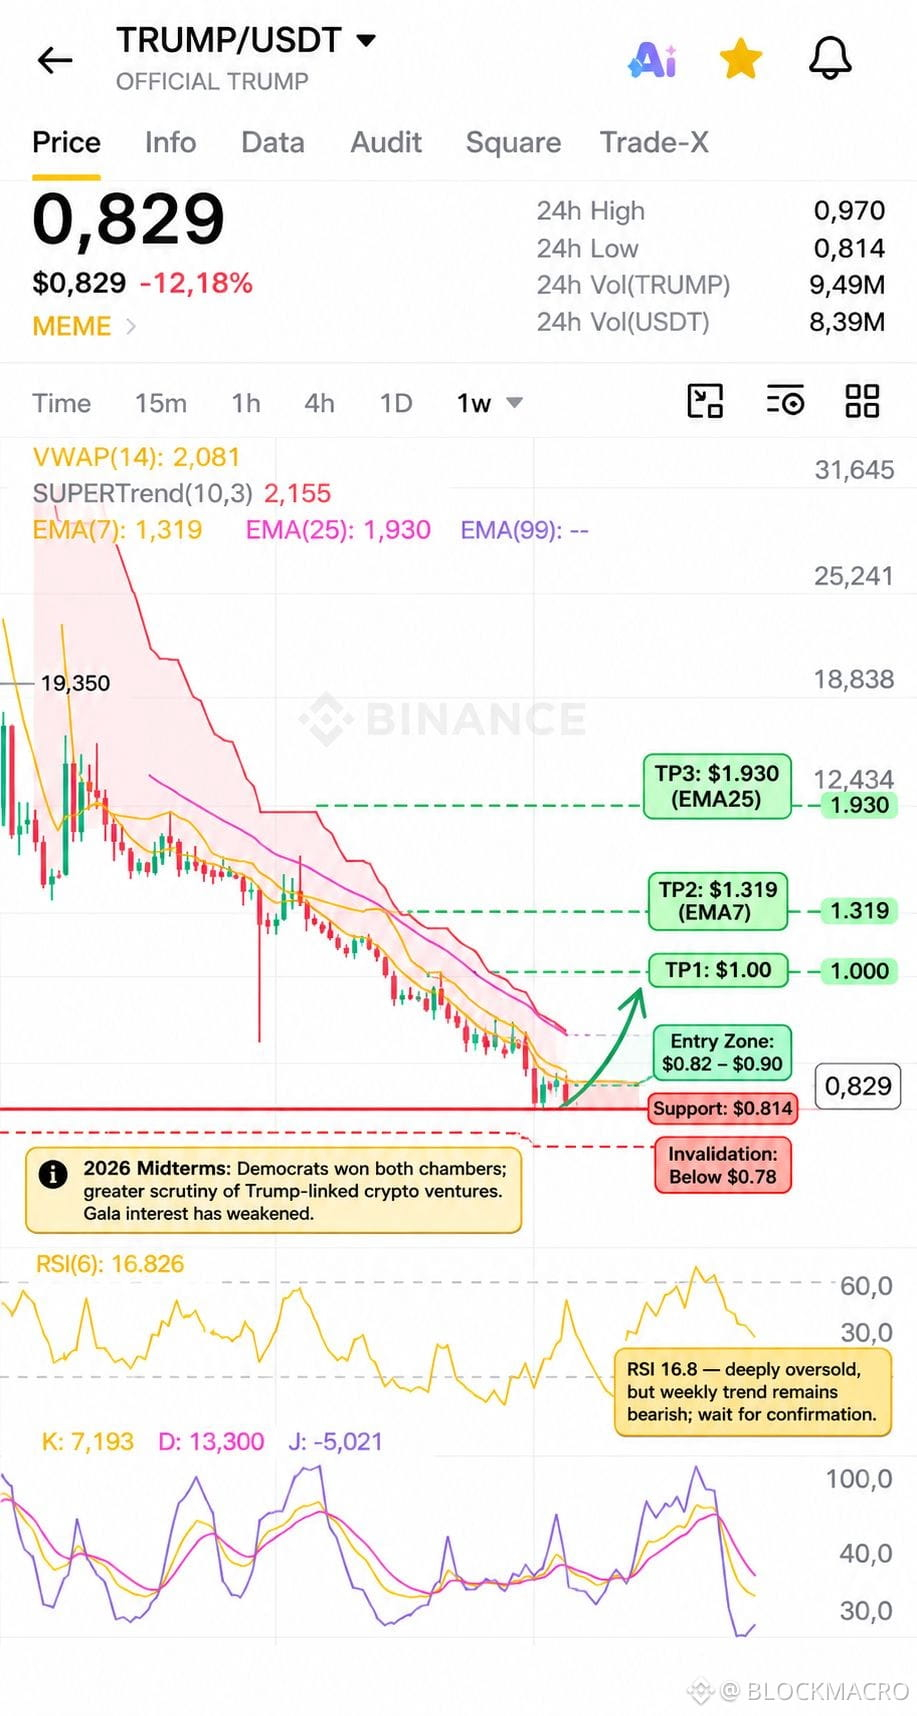
TRUMP/USDT (1W) — Speculative Bullish Reversal Setup 🇺🇸
Technical Analysis:
TRUMP is extremely oversold, with RSI at 16.82, suggesting potential rebound opportunities. However, the weekly trend remains strongly bearish, with price trading below EMA 7, EMA 25 and Supertrend.
Entry zone: $0.80–$0.85 (after confirmation)
TP1: $1.00
TP2: $1.32 (EMA 7)
TP3: $1.93 (EMA 25)
Major support: $0.814
Stop-loss: Below $0.78
A weekly close above $1.00 would be an early sign of recovery. These are speculative levels, not confirmed reversal signals.
Fundamental & Political Analysis:
The U.S. political landscape has become a major risk factor for TRUMP. Following the November 2026 midterm elections, Democrats gained control of both chambers of Congress, increasing the likelihood of investigations into Trump's crypto-related businesses.
Reuters also reported that interest in the November 22 Trump crypto gala has dropped sharply, weakening a potential promotional catalyst for the token.
My view: Political headlines can trigger sudden speculative rallies, but political controversy and declining investor interest may continue to pressure the token. This is a high-risk political meme coin, not a conventional fundamental investment.
Key message: Political hype can create rallies, but political risk can destroy them just as quickly.
Caution: The targets are speculative, and a bounce is not yet a confirmed trend reversal.
$TRUMP #USGovernment #TradingSignal
TRUMP/USDT (1W) — Speculative Bullish Reversal Setup 🇺🇸
Technical Analysis:
TRUMP is extremely oversold, with RSI at 16.82, suggesting potential rebound opportunities. However, the weekly trend remains strongly bearish, with price trading below EMA 7, EMA 25 and Supertrend.
Entry zone: $0.80–$0.85 (after confirmation)
TP1: $1.00
TP2: $1.32 (EMA 7)
TP3: $1.93 (EMA 25)
Major support: $0.814
Stop-loss: Below $0.78
A weekly close above $1.00 would be an early sign of recovery. These are speculative levels, not confirmed reversal signals.
Fundamental & Political Analysis:
The U.S. political landscape has become a major risk factor for TRUMP. Following the November 2026 midterm elections, Democrats gained control of both chambers of Congress, increasing the likelihood of investigations into Trump's crypto-related businesses.
Reuters also reported that interest in the November 22 Trump crypto gala has dropped sharply, weakening a potential promotional catalyst for the token.
My view: Political headlines can trigger sudden speculative rallies, but political controversy and declining investor interest may continue to pressure the token. This is a high-risk political meme coin, not a conventional fundamental investment.
Key message: Political hype can create rallies, but political risk can destroy them just as quickly.
Caution: The targets are speculative, and a bounce is not yet a confirmed trend reversal.
$TRUMP #USGovernment #TradingSignal
Technical Analysis:
TRUMP is extremely oversold, with RSI at 16.82, suggesting potential rebound opportunities. However, the weekly trend remains strongly bearish, with price trading below EMA 7, EMA 25 and Supertrend.
Entry zone: $0.80–$0.85 (after confirmation)
TP1: $1.00
TP2: $1.32 (EMA 7)
TP3: $1.93 (EMA 25)
Major support: $0.814
Stop-loss: Below $0.78
A weekly close above $1.00 would be an early sign of recovery. These are speculative levels, not confirmed reversal signals.
Fundamental & Political Analysis:
The U.S. political landscape has become a major risk factor for TRUMP. Following the November 2026 midterm elections, Democrats gained control of both chambers of Congress, increasing the likelihood of investigations into Trump's crypto-related businesses.
Reuters also reported that interest in the November 22 Trump crypto gala has dropped sharply, weakening a potential promotional catalyst for the token.
My view: Political headlines can trigger sudden speculative rallies, but political controversy and declining investor interest may continue to pressure the token. This is a high-risk political meme coin, not a conventional fundamental investment.
Key message: Political hype can create rallies, but political risk can destroy them just as quickly.
Caution: The targets are speculative, and a bounce is not yet a confirmed trend reversal.
$TRUMP #USGovernment #TradingSignal
168
·
--
FINANCIAL HISTORY: The Trader Who Turned $10,775 Into $18 Million
Meet Dan Zanger — One of the Most Remarkable Traders in Market History.
Before becoming a millionaire, Dan Zanger was a swimming-pool contractor in Los Angeles. His fascination with the stock market began early, but he spent years studying charts and learning from his mistakes.
In 1989, he became serious about technical analysis, studying chart patterns for 25–30 hours every week.
His strategy was surprisingly simple:
Focus on leading, high-momentum stocks.
Identify breakouts using chart patterns.
Follow price and volume rather than relying on dozens of indicators.
Cut losing positions quickly.
Ride powerful winners while momentum remained strong.
In June 1998, he started with approximately $10,775.
During the dot-com boom, he reportedly transformed that amount into $18 million in just 18 months, eventually reaching around $42 million in 23 months.
What Can Crypto Traders Learn From His Story?
Bitcoin and altcoins may be different from 1990s technology stocks, but market psychology never changes.
Study price action before chasing hype.
Wait for confirmed breakouts.
Pay attention to volume.
Cut losses before they become disasters.
Let winning trades run, but never confuse confidence with recklessness.
The biggest lesson?
Dan Zanger didn't become successful simply because he found the next big stock. He spent years developing the skills to recognize opportunities when they appeared.
In crypto, everyone wants the next 100x coin. Very few are willing to put in the work to become better traders.
Question for Crypto Traders:
If you had $10,775 today, would you try to turn it into $1 million through crypto trading, or would you focus on protecting your capital first?
#FinancialHistory #Bitcoin #CryptoTrading. #tradingpsychology #TechnicalAnalysis $BTC $ETH $SOL
FINANCIAL HISTORY: The Trader Who Turned $10,775 Into $18 Million
Meet Dan Zanger — One of the Most Remarkable Traders in Market History.
Before becoming a millionaire, Dan Zanger was a swimming-pool contractor in Los Angeles. His fascination with the stock market began early, but he spent years studying charts and learning from his mistakes.
In 1989, he became serious about technical analysis, studying chart patterns for 25–30 hours every week.
His strategy was surprisingly simple:
Focus on leading, high-momentum stocks.
Identify breakouts using chart patterns.
Follow price and volume rather than relying on dozens of indicators.
Cut losing positions quickly.
Ride powerful winners while momentum remained strong.
In June 1998, he started with approximately $10,775.
During the dot-com boom, he reportedly transformed that amount into $18 million in just 18 months, eventually reaching around $42 million in 23 months.
What Can Crypto Traders Learn From His Story?
Bitcoin and altcoins may be different from 1990s technology stocks, but market psychology never changes.
Study price action before chasing hype.
Wait for confirmed breakouts.
Pay attention to volume.
Cut losses before they become disasters.
Let winning trades run, but never confuse confidence with recklessness.
The biggest lesson?
Dan Zanger didn't become successful simply because he found the next big stock. He spent years developing the skills to recognize opportunities when they appeared.
In crypto, everyone wants the next 100x coin. Very few are willing to put in the work to become better traders.
Question for Crypto Traders:
If you had $10,775 today, would you try to turn it into $1 million through crypto trading, or would you focus on protecting your capital first?
#FinancialHistory #Bitcoin #CryptoTrading. #tradingpsychology #TechnicalAnalysis $BTC $ETH $SOL
Meet Dan Zanger — One of the Most Remarkable Traders in Market History.
Before becoming a millionaire, Dan Zanger was a swimming-pool contractor in Los Angeles. His fascination with the stock market began early, but he spent years studying charts and learning from his mistakes.
In 1989, he became serious about technical analysis, studying chart patterns for 25–30 hours every week.
His strategy was surprisingly simple:
Focus on leading, high-momentum stocks.
Identify breakouts using chart patterns.
Follow price and volume rather than relying on dozens of indicators.
Cut losing positions quickly.
Ride powerful winners while momentum remained strong.
In June 1998, he started with approximately $10,775.
During the dot-com boom, he reportedly transformed that amount into $18 million in just 18 months, eventually reaching around $42 million in 23 months.
What Can Crypto Traders Learn From His Story?
Bitcoin and altcoins may be different from 1990s technology stocks, but market psychology never changes.
Study price action before chasing hype.
Wait for confirmed breakouts.
Pay attention to volume.
Cut losses before they become disasters.
Let winning trades run, but never confuse confidence with recklessness.
The biggest lesson?
Dan Zanger didn't become successful simply because he found the next big stock. He spent years developing the skills to recognize opportunities when they appeared.
In crypto, everyone wants the next 100x coin. Very few are willing to put in the work to become better traders.
Question for Crypto Traders:
If you had $10,775 today, would you try to turn it into $1 million through crypto trading, or would you focus on protecting your capital first?
#FinancialHistory #Bitcoin #CryptoTrading. #tradingpsychology #TechnicalAnalysis $BTC $ETH $SOL

1
155
·
--
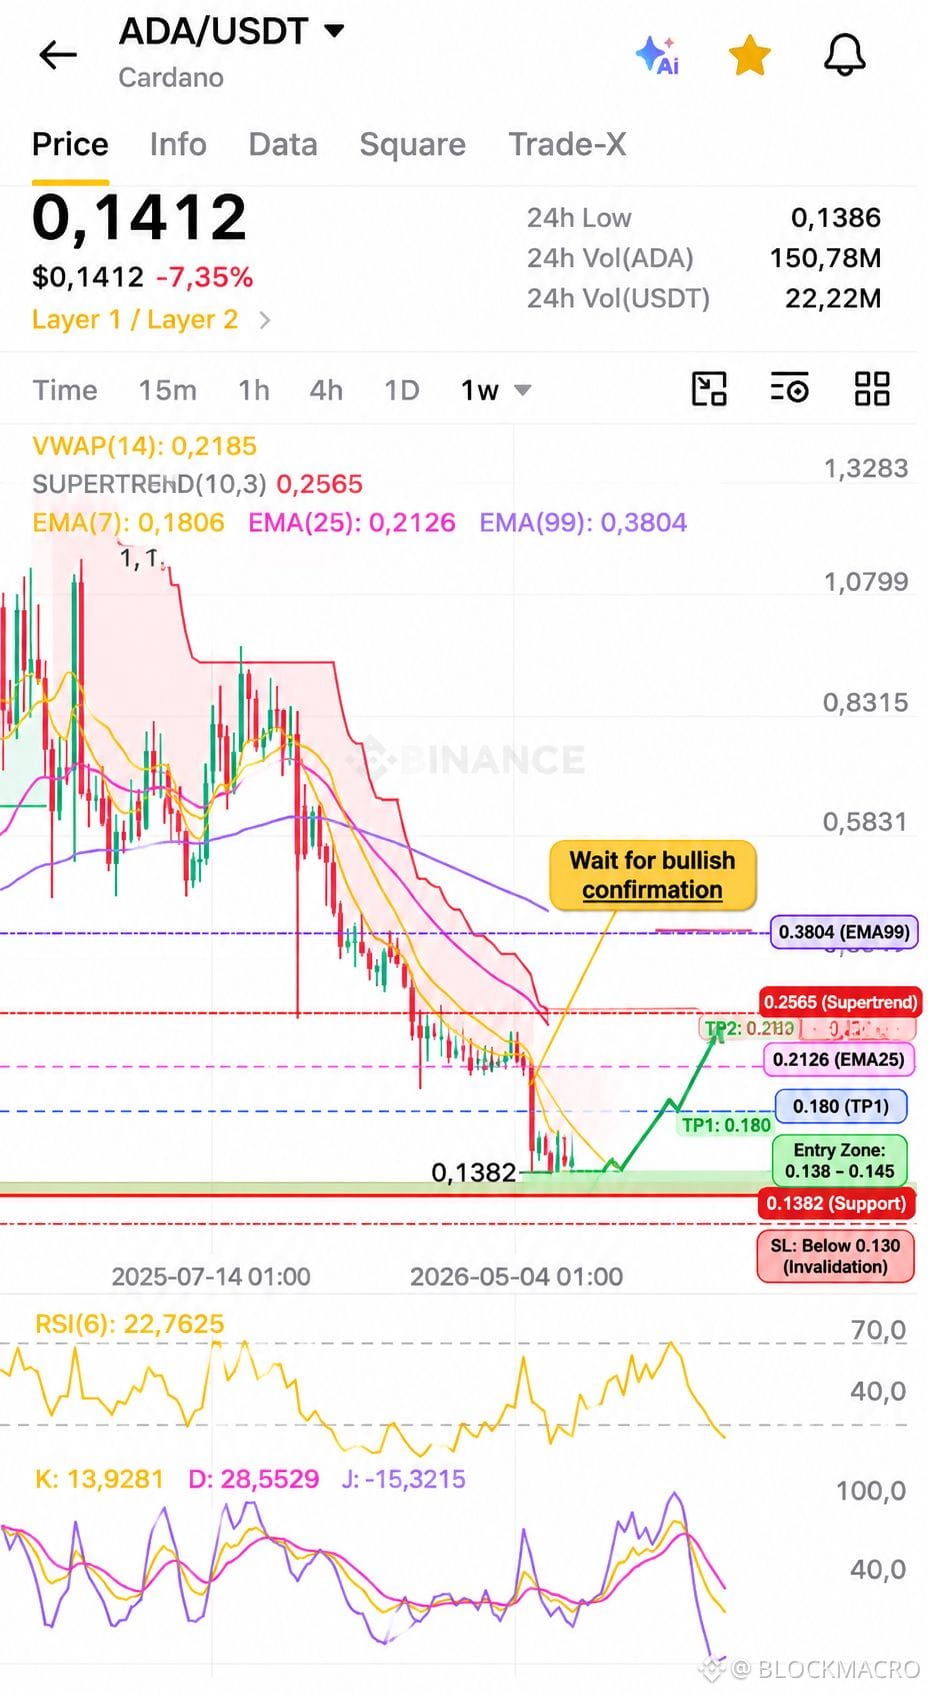
$ADA is approaching a major support area around $0.1382. RSI at 22.76 indicates deeply oversold conditions, suggesting a possible rebound. However, the weekly trend remains bearish, with price below all major EMAs.
Entry zone: $0.138–$0.145 (after bullish confirmation)
TP1: $0.180
TP2: $0.212
TP3: $0.256
Major support: $0.1382
Stop-loss: Below $0.130 (weekly close)
A breakout above $0.180 would be the first sign of a stronger recovery.
Fundamental Analysis:
Cardano continues to develop its ecosystem through DeFi, smart contracts, institutional integrations and decentralized governance. Recent developments in network infrastructure and tokenization provide long-term growth potential. However, adoption and competition remain key challenges.
Conclusion: ADA offers a potential oversold bounce, but the weekly trend is still bearish. Wait for a confirmed reversal before entering. Risk management is essential.
Not financial advice.
#ADAUSDT #Cardano #TradingSignal #TradingIdeas $ADA
$ADA is approaching a major support area around $0.1382. RSI at 22.76 indicates deeply oversold conditions, suggesting a possible rebound. However, the weekly trend remains bearish, with price below all major EMAs.
Entry zone: $0.138–$0.145 (after bullish confirmation)
TP1: $0.180
TP2: $0.212
TP3: $0.256
Major support: $0.1382
Stop-loss: Below $0.130 (weekly close)
A breakout above $0.180 would be the first sign of a stronger recovery.
Fundamental Analysis:
Cardano continues to develop its ecosystem through DeFi, smart contracts, institutional integrations and decentralized governance. Recent developments in network infrastructure and tokenization provide long-term growth potential. However, adoption and competition remain key challenges.
Conclusion: ADA offers a potential oversold bounce, but the weekly trend is still bearish. Wait for a confirmed reversal before entering. Risk management is essential.
Not financial advice.
#ADAUSDT #Cardano #TradingSignal #TradingIdeas $ADA
Entry zone: $0.138–$0.145 (after bullish confirmation)
TP1: $0.180
TP2: $0.212
TP3: $0.256
Major support: $0.1382
Stop-loss: Below $0.130 (weekly close)
A breakout above $0.180 would be the first sign of a stronger recovery.
Fundamental Analysis:
Cardano continues to develop its ecosystem through DeFi, smart contracts, institutional integrations and decentralized governance. Recent developments in network infrastructure and tokenization provide long-term growth potential. However, adoption and competition remain key challenges.
Conclusion: ADA offers a potential oversold bounce, but the weekly trend is still bearish. Wait for a confirmed reversal before entering. Risk management is essential.
Not financial advice.
#ADAUSDT #Cardano #TradingSignal #TradingIdeas $ADA
455
·
--
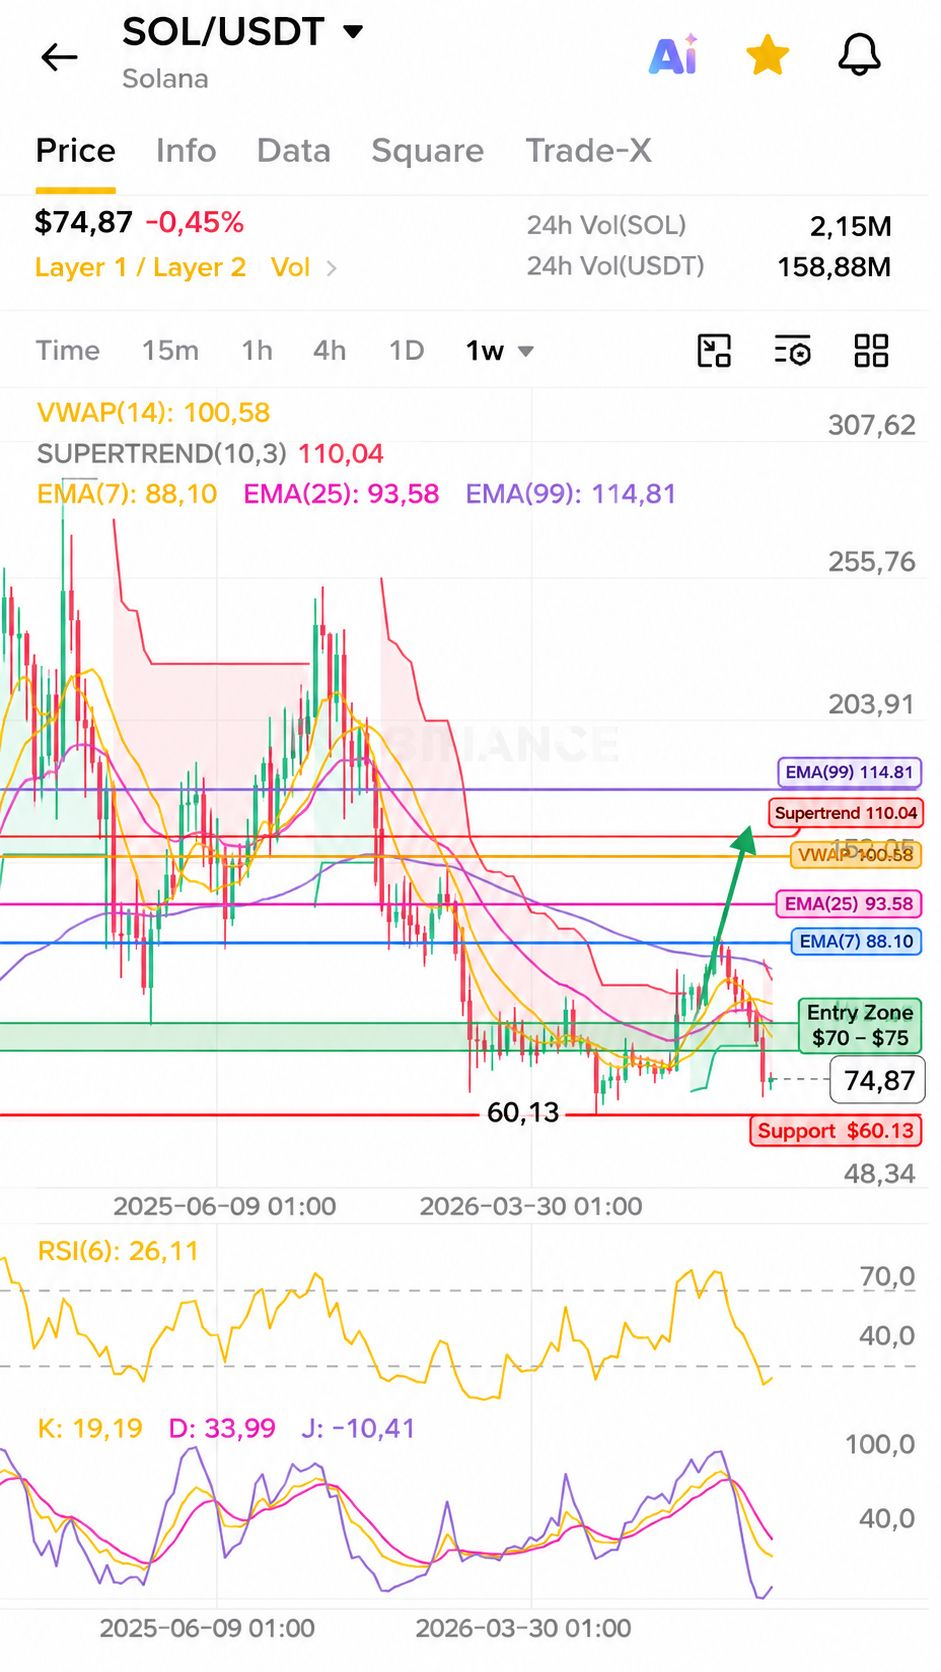
$SOL is deeply oversold, with RSI at 26.11, suggesting a potential recovery. However, the weekly trend remains bearish because price ($74.87) is below all major EMAs.
Entry zone: $70–$75 (after bullish confirmation)
TP1: $88
TP2: $93.50
TP3: $100
TP4: $110
Major support: $60.13
Stop-loss: Below $60 (weekly closing basis)
Key resistance: $88–$94. A weekly breakout above this zone would strengthen the bullish reversal scenario.
Fundamental Analysis: Solana maintains strong fundamentals through DeFi, staking, stablecoin payments and institutional adoption. Tokenized assets and growing network activity support its long-term outlook. However, competition and dependence on speculative trading remain risks.
#SOLUSDT #solana #TradingSignal #TradingSignals
$SOL is deeply oversold, with RSI at 26.11, suggesting a potential recovery. However, the weekly trend remains bearish because price ($74.87) is below all major EMAs.
Entry zone: $70–$75 (after bullish confirmation)
TP1: $88
TP2: $93.50
TP3: $100
TP4: $110
Major support: $60.13
Stop-loss: Below $60 (weekly closing basis)
Key resistance: $88–$94. A weekly breakout above this zone would strengthen the bullish reversal scenario.
Fundamental Analysis: Solana maintains strong fundamentals through DeFi, staking, stablecoin payments and institutional adoption. Tokenized assets and growing network activity support its long-term outlook. However, competition and dependence on speculative trading remain risks.
#SOLUSDT #solana #TradingSignal #TradingSignals
Entry zone: $70–$75 (after bullish confirmation)
TP1: $88
TP2: $93.50
TP3: $100
TP4: $110
Major support: $60.13
Stop-loss: Below $60 (weekly closing basis)
Key resistance: $88–$94. A weekly breakout above this zone would strengthen the bullish reversal scenario.
Fundamental Analysis: Solana maintains strong fundamentals through DeFi, staking, stablecoin payments and institutional adoption. Tokenized assets and growing network activity support its long-term outlook. However, competition and dependence on speculative trading remain risks.
#SOLUSDT #solana #TradingSignal #TradingSignals
190
·
--
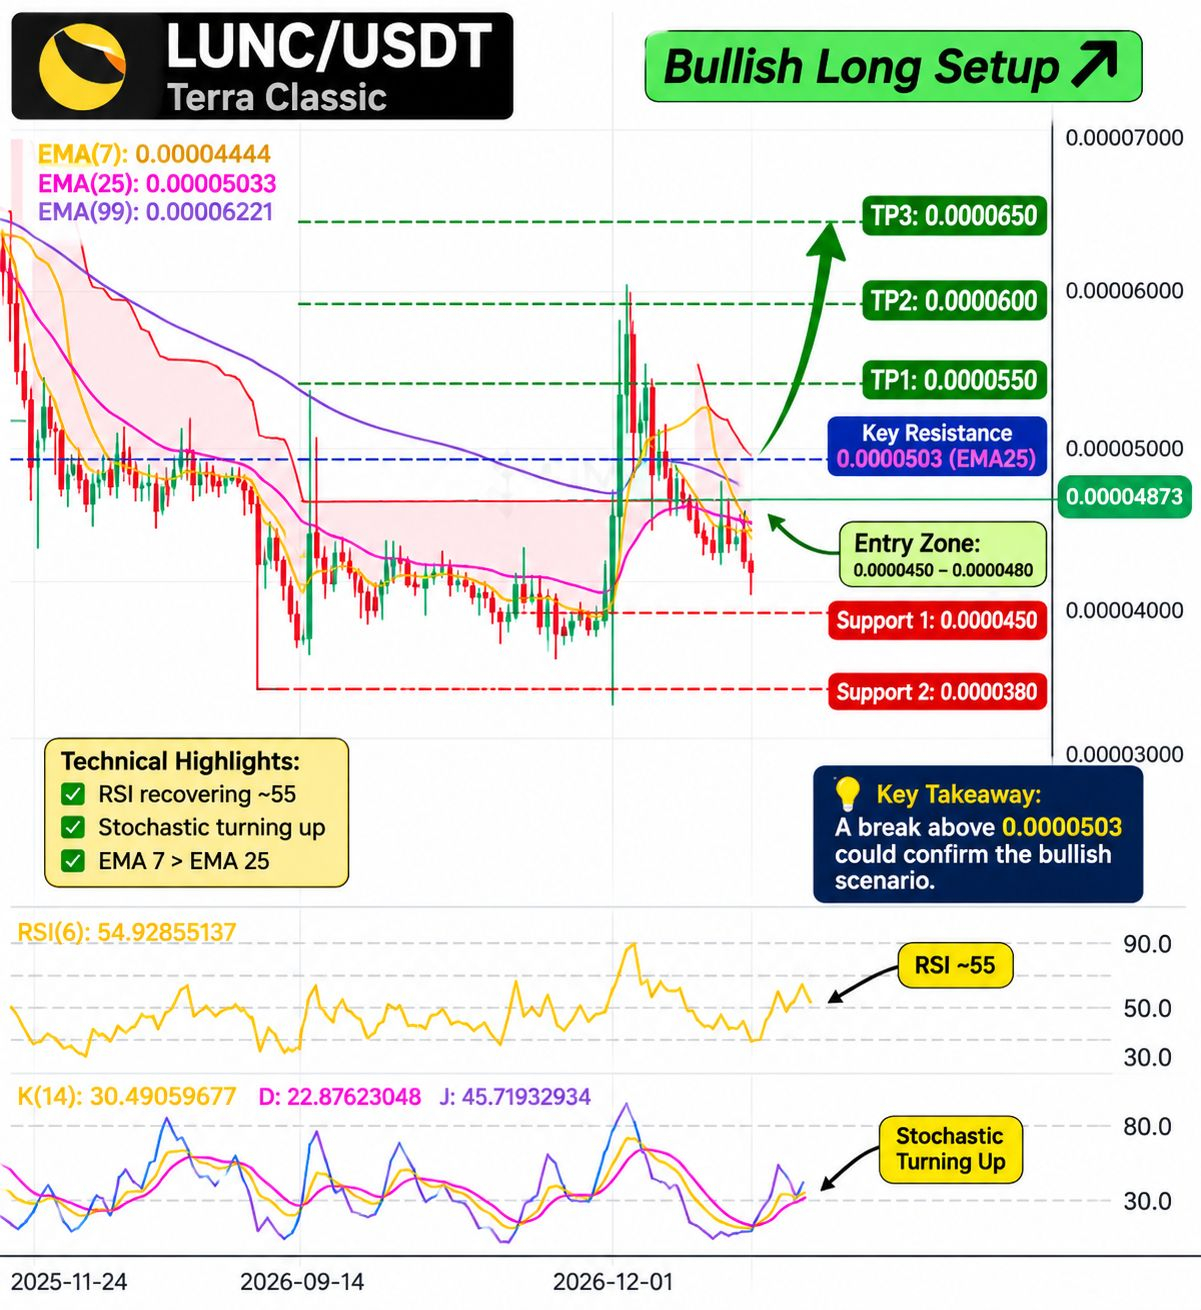
LUNC/USDT (1W) — Bullish Long Setup 🚀
Technical Analysis: $LUNC is showing early signs of a bullish recovery on the weekly chart, gaining over 25%. RSI has recovered to around 55, while the Stochastic indicator is turning upward, suggesting improving buying pressure.
Entry zone: $0.0000450–$0.0000480
TP1: $0.0000550
TP2: $0.0000600
TP3: $0.0000650
Stop-loss: Below $0.0000380
Key resistance: $0.0000503 (EMA 25). A weekly close above this level would strengthen the bullish scenario.
#LUNCUSDT #TradingSignals #TradingIdeas #terraClassicLunc
LUNC/USDT (1W) — Bullish Long Setup 🚀
Technical Analysis: $LUNC is showing early signs of a bullish recovery on the weekly chart, gaining over 25%. RSI has recovered to around 55, while the Stochastic indicator is turning upward, suggesting improving buying pressure.
Entry zone: $0.0000450–$0.0000480
TP1: $0.0000550
TP2: $0.0000600
TP3: $0.0000650
Stop-loss: Below $0.0000380
Key resistance: $0.0000503 (EMA 25). A weekly close above this level would strengthen the bullish scenario.
#LUNCUSDT #TradingSignals #TradingIdeas #terraClassicLunc
Technical Analysis: $LUNC is showing early signs of a bullish recovery on the weekly chart, gaining over 25%. RSI has recovered to around 55, while the Stochastic indicator is turning upward, suggesting improving buying pressure.
Entry zone: $0.0000450–$0.0000480
TP1: $0.0000550
TP2: $0.0000600
TP3: $0.0000650
Stop-loss: Below $0.0000380
Key resistance: $0.0000503 (EMA 25). A weekly close above this level would strengthen the bullish scenario.
#LUNCUSDT #TradingSignals #TradingIdeas #terraClassicLunc
1
1
270
·
--
🚨 BITCOIN: HISTORY REPEATS… OR ARE WE ABOUT TO LEARN THE HARD WAY?
Everyone loves Bitcoin when it makes new highs. Almost nobody wants to talk about what happens afterward.
Look at the historical cycles:
🔻 2017–2018: Bitcoin crashed approximately 84%.
🔻 2021–2022: Bitcoin lost approximately 77%.
🔻 2025–2026: Another major correction is raising an uncomfortable question.
Is the market repeating its old pattern?
Here's the uncomfortable truth:
Every bull market creates a new generation of believers who think this time is different.
But markets don't care about your expectations, your emotions, or your entry price.
And here's the real debate:
Are Bitcoin investors witnessing another opportunity to accumulate, or are they ignoring the warning signs of a major bear market?
⚠️ History doesn't guarantee the future. But ignoring history can be expensive.
The Question is:
🔥 Is Bitcoin heading toward another brutal bear market, or will this cycle finally break the historical pattern?
👇 Choose your side: BULL 🐂 or BEAR 🐻?
#bitcoin #BTC #CryptoMarketMoves #BearMarket #bullmarket $BTC
🚨 BITCOIN: HISTORY REPEATS… OR ARE WE ABOUT TO LEARN THE HARD WAY?
Everyone loves Bitcoin when it makes new highs. Almost nobody wants to talk about what happens afterward.
Look at the historical cycles:
🔻 2017–2018: Bitcoin crashed approximately 84%.
🔻 2021–2022: Bitcoin lost approximately 77%.
🔻 2025–2026: Another major correction is raising an uncomfortable question.
Is the market repeating its old pattern?
Here's the uncomfortable truth:
Every bull market creates a new generation of believers who think this time is different.
But markets don't care about your expectations, your emotions, or your entry price.
And here's the real debate:
Are Bitcoin investors witnessing another opportunity to accumulate, or are they ignoring the warning signs of a major bear market?
⚠️ History doesn't guarantee the future. But ignoring history can be expensive.
The Question is:
🔥 Is Bitcoin heading toward another brutal bear market, or will this cycle finally break the historical pattern?
👇 Choose your side: BULL 🐂 or BEAR 🐻?
#bitcoin #BTC #CryptoMarketMoves #BearMarket #bullmarket $BTC
Everyone loves Bitcoin when it makes new highs. Almost nobody wants to talk about what happens afterward.
Look at the historical cycles:
🔻 2017–2018: Bitcoin crashed approximately 84%.
🔻 2021–2022: Bitcoin lost approximately 77%.
🔻 2025–2026: Another major correction is raising an uncomfortable question.
Is the market repeating its old pattern?
Here's the uncomfortable truth:
Every bull market creates a new generation of believers who think this time is different.
But markets don't care about your expectations, your emotions, or your entry price.
And here's the real debate:
Are Bitcoin investors witnessing another opportunity to accumulate, or are they ignoring the warning signs of a major bear market?
⚠️ History doesn't guarantee the future. But ignoring history can be expensive.
The Question is:
🔥 Is Bitcoin heading toward another brutal bear market, or will this cycle finally break the historical pattern?
👇 Choose your side: BULL 🐂 or BEAR 🐻?
#bitcoin #BTC #CryptoMarketMoves #BearMarket #bullmarket $BTC

1
123
·
--
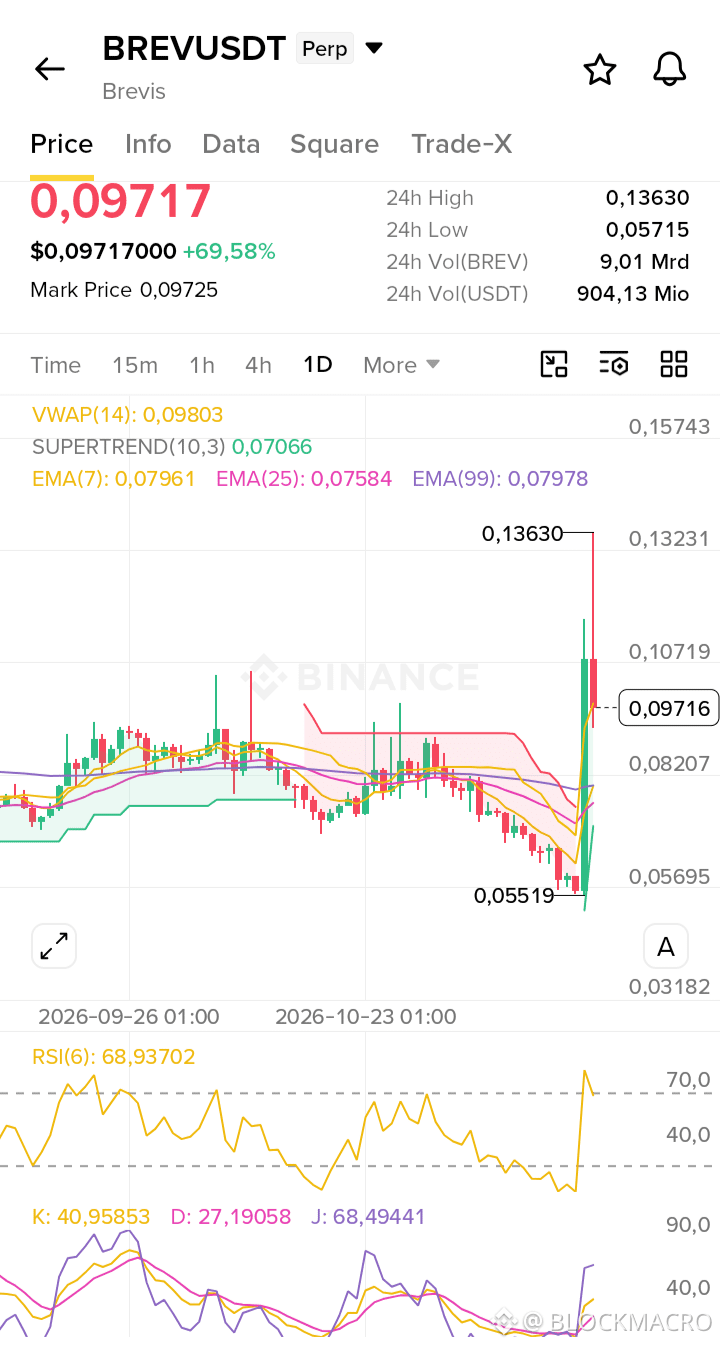
$BREV (1D) — Bullish Long Setup 🚀
Technical Analysis: BREV has surged nearly 70%, breaking above its EMA 7, EMA 25 and EMA 99, signaling a strong bullish momentum shift. The Supertrend has also turned positive.
Entry zone: $0.088–$0.093 (after confirmation)
TP1: $0.107
TP2: $0.120
TP3: $0.136
Stop-loss: $0.080
Fundamental Analysis: Brevis is a blockchain infrastructure project focused on verifiable computation and zero-knowledge proofs. Its technology aims to help blockchain applications process complex computations securely and efficiently.
Conclusion: The bullish structure is encouraging, but RSI near 69 and the sharp rejection from $0.136 suggest possible short-term consolidation. A successful retest of $0.088–$0.093 could offer a better long opportunity.
Avoid chasing the pump. Wait for confirmation and manage risk carefully. Not financial advice.
#Brevusdt #TradingSignals #TradingIdeas
$BREV (1D) — Bullish Long Setup 🚀
Technical Analysis: BREV has surged nearly 70%, breaking above its EMA 7, EMA 25 and EMA 99, signaling a strong bullish momentum shift. The Supertrend has also turned positive.
Entry zone: $0.088–$0.093 (after confirmation)
TP1: $0.107
TP2: $0.120
TP3: $0.136
Stop-loss: $0.080
Fundamental Analysis: Brevis is a blockchain infrastructure project focused on verifiable computation and zero-knowledge proofs. Its technology aims to help blockchain applications process complex computations securely and efficiently.
Conclusion: The bullish structure is encouraging, but RSI near 69 and the sharp rejection from $0.136 suggest possible short-term consolidation. A successful retest of $0.088–$0.093 could offer a better long opportunity.
Avoid chasing the pump. Wait for confirmation and manage risk carefully. Not financial advice.
#Brevusdt #TradingSignals #TradingIdeas
Technical Analysis: BREV has surged nearly 70%, breaking above its EMA 7, EMA 25 and EMA 99, signaling a strong bullish momentum shift. The Supertrend has also turned positive.
Entry zone: $0.088–$0.093 (after confirmation)
TP1: $0.107
TP2: $0.120
TP3: $0.136
Stop-loss: $0.080
Fundamental Analysis: Brevis is a blockchain infrastructure project focused on verifiable computation and zero-knowledge proofs. Its technology aims to help blockchain applications process complex computations securely and efficiently.
Conclusion: The bullish structure is encouraging, but RSI near 69 and the sharp rejection from $0.136 suggest possible short-term consolidation. A successful retest of $0.088–$0.093 could offer a better long opportunity.
Avoid chasing the pump. Wait for confirmation and manage risk carefully. Not financial advice.
#Brevusdt #TradingSignals #TradingIdeas
193
·
--
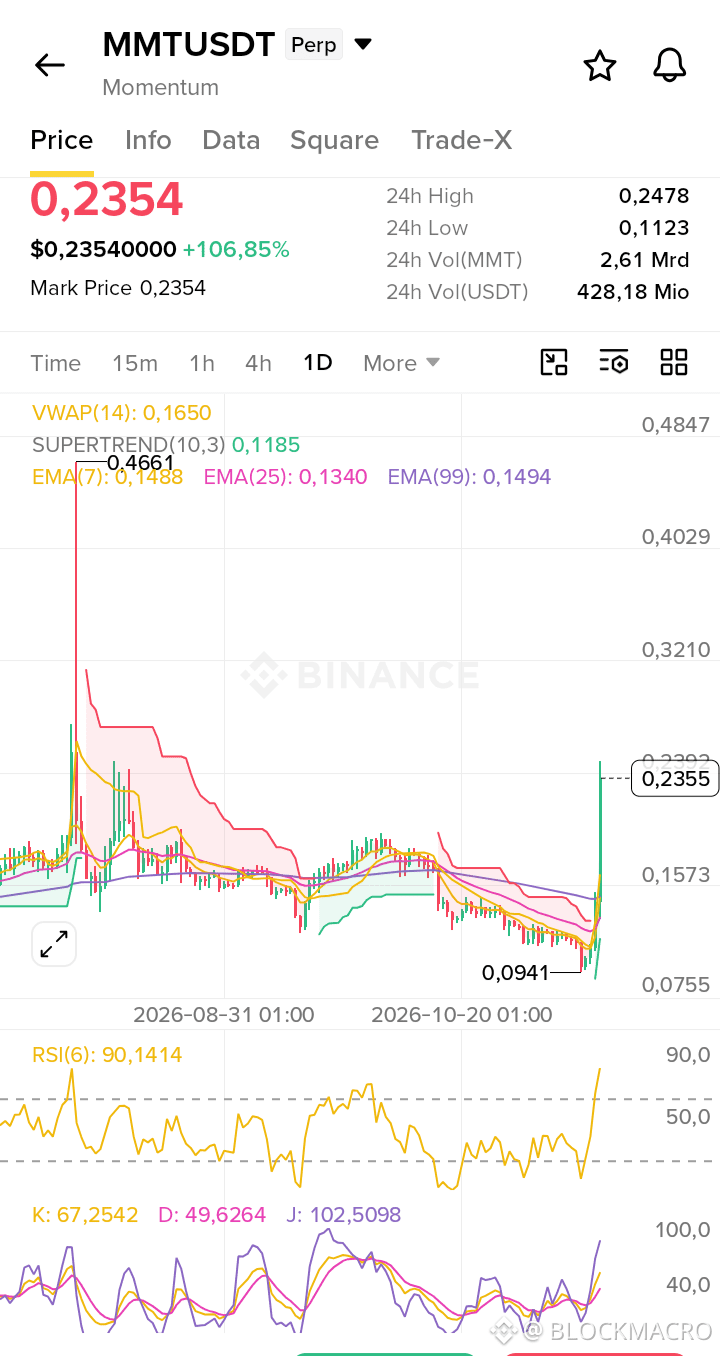
$MMT (1D) — Bullish Long Setup 🚀
Technical Analysis: MMT has delivered a massive bullish breakout, surging over 106% in 24 hours. Price is trading well above EMA 7, EMA 25 and EMA 99, confirming strong bullish momentum.
Resistance: $0.2478
Entry zone: $0.2000–$0.2100 (preferably after a successful retest)
TP1: $0.2600
TP2: $0.2800
TP3: $0.3000
Stop-loss: Below $0.1850
Important: RSI is around 90, indicating extreme overbought conditions. A pullback or consolidation is likely before another potential move higher.
Fundamental Analysis: Momentum is a DeFi ecosystem built on Sui, with MMT serving governance and staking functions. Rising trading activity supports short-term market interest. However, declining TVL and upcoming token unlocks remain important risks.
Conclusion: Bullish momentum is strong, but chasing this explosive candle is risky. I prefer buying a confirmed pullback rather than entering at the top.
Trade with discipline and manage leverage carefully. Not financial advice.
#MMTUSDT #TradingSignals
$MMT (1D) — Bullish Long Setup 🚀
Technical Analysis: MMT has delivered a massive bullish breakout, surging over 106% in 24 hours. Price is trading well above EMA 7, EMA 25 and EMA 99, confirming strong bullish momentum.
Resistance: $0.2478
Entry zone: $0.2000–$0.2100 (preferably after a successful retest)
TP1: $0.2600
TP2: $0.2800
TP3: $0.3000
Stop-loss: Below $0.1850
Important: RSI is around 90, indicating extreme overbought conditions. A pullback or consolidation is likely before another potential move higher.
Fundamental Analysis: Momentum is a DeFi ecosystem built on Sui, with MMT serving governance and staking functions. Rising trading activity supports short-term market interest. However, declining TVL and upcoming token unlocks remain important risks.
Conclusion: Bullish momentum is strong, but chasing this explosive candle is risky. I prefer buying a confirmed pullback rather than entering at the top.
Trade with discipline and manage leverage carefully. Not financial advice.
#MMTUSDT #TradingSignals
Technical Analysis: MMT has delivered a massive bullish breakout, surging over 106% in 24 hours. Price is trading well above EMA 7, EMA 25 and EMA 99, confirming strong bullish momentum.
Resistance: $0.2478
Entry zone: $0.2000–$0.2100 (preferably after a successful retest)
TP1: $0.2600
TP2: $0.2800
TP3: $0.3000
Stop-loss: Below $0.1850
Important: RSI is around 90, indicating extreme overbought conditions. A pullback or consolidation is likely before another potential move higher.
Fundamental Analysis: Momentum is a DeFi ecosystem built on Sui, with MMT serving governance and staking functions. Rising trading activity supports short-term market interest. However, declining TVL and upcoming token unlocks remain important risks.
Conclusion: Bullish momentum is strong, but chasing this explosive candle is risky. I prefer buying a confirmed pullback rather than entering at the top.
Trade with discipline and manage leverage carefully. Not financial advice.
#MMTUSDT #TradingSignals
2
2
258
·
--
true
true

ETHUNT
·
--
$ETH $BTC
Don't just read and scroll away without leaving a trace! ❤️
"When you trade using all your available margin and put your entire capital at risk, even if your decision is right and you've predicted the market direction correctly, the smallest market fluctuations can still wipe you out and eat you alive.
Then, a little later, the price finally moves exactly as you expected… but by then, it's already too late.
How can you avoid this?
- Don't be greedy.
- Never risk all your capital on a single trade. Use only a small portion of it.
- Give your trades enough breathing room to withstand minor market fluctuations, so you don't end up drowning in a puddle barely an inch deep!
- Move toward your target one step at a time, whether going up or down. After all, every staircase is made of many steps, not just one.
Remember: Being right about the market direction means nothing if you don't have enough capital left to stay in the trade."
❤️Support me with a like, a follow, or simply share your thoughts in a comment.
Support others to be supported!❤️
#TradingAdvice #tradingtips #ETHUNT
#Follow_Like_Comment
Don't just read and scroll away without leaving a trace! ❤️
"When you trade using all your available margin and put your entire capital at risk, even if your decision is right and you've predicted the market direction correctly, the smallest market fluctuations can still wipe you out and eat you alive.
Then, a little later, the price finally moves exactly as you expected… but by then, it's already too late.
How can you avoid this?
- Don't be greedy.
- Never risk all your capital on a single trade. Use only a small portion of it.
- Give your trades enough breathing room to withstand minor market fluctuations, so you don't end up drowning in a puddle barely an inch deep!
- Move toward your target one step at a time, whether going up or down. After all, every staircase is made of many steps, not just one.
Remember: Being right about the market direction means nothing if you don't have enough capital left to stay in the trade."
❤️Support me with a like, a follow, or simply share your thoughts in a comment.
Support others to be supported!❤️
#TradingAdvice #tradingtips #ETHUNT
#Follow_Like_Comment

·
--
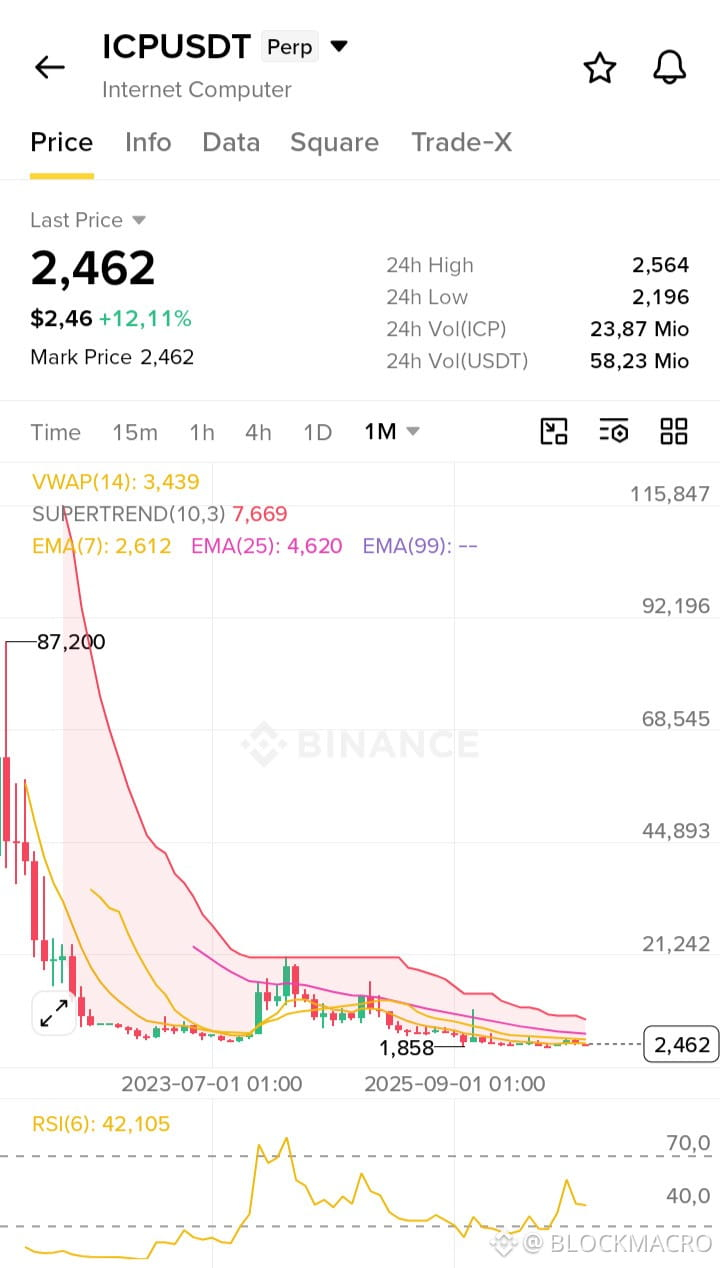
$ICP (1M) – Long-Term LONG Setup
Current Price: $2.462
### Technical Analysis
* ICP is trading near historical support around $2.20–$2.50.
* RSI (6) at 42 indicates recovering momentum.
* Price remains below EMA 7 ($2.612) and EMA 25 ($4.620), confirming that the long-term trend is still bearish.
* A monthly breakout above $2.60–$3.00 would strengthen the bullish scenario.
Key Levels:
* Support: $2.20 / $1.858
* Resistance: $2.61 / $3.44 / $4.62
### Fundamental Analysis
ICP is a decentralized cloud computing blockchain with strong potential in AI, Web3 and cross-chain applications.
* Supports decentralized applications and on-chain computing.
* Chain Fusion connects ICP with other blockchains.
* Its tokenomics combines staking rewards with token burning. internetcomputer.org +2
### LONG Trade Plan
| Target | Price |
| ---------- | ----------- |
| Entry zone | $2.30–$2.46 |
| Stop Loss | $1.80 |
| TP1 | $3.00 |
| TP2 | $3.44 |
| TP3 | $4.62 |
Final Verdict: ICP could offer an attractive long-term recovery opportunity, but confirmation above $2.61 is important. Consider scaling into the position rather than entering all at once.
Long-term speculative setup. The monthly downtrend is not yet reversed.
#ICP. #InternetComputer #TradingIdeas #TradingSignals
$ICP (1M) – Long-Term LONG Setup
Current Price: $2.462
### Technical Analysis
* ICP is trading near historical support around $2.20–$2.50.
* RSI (6) at 42 indicates recovering momentum.
* Price remains below EMA 7 ($2.612) and EMA 25 ($4.620), confirming that the long-term trend is still bearish.
* A monthly breakout above $2.60–$3.00 would strengthen the bullish scenario.
Key Levels:
* Support: $2.20 / $1.858
* Resistance: $2.61 / $3.44 / $4.62
### Fundamental Analysis
ICP is a decentralized cloud computing blockchain with strong potential in AI, Web3 and cross-chain applications.
* Supports decentralized applications and on-chain computing.
* Chain Fusion connects ICP with other blockchains.
* Its tokenomics combines staking rewards with token burning. internetcomputer.org +2
### LONG Trade Plan
| Target | Price |
| ---------- | ----------- |
| Entry zone | $2.30–$2.46 |
| Stop Loss | $1.80 |
| TP1 | $3.00 |
| TP2 | $3.44 |
| TP3 | $4.62 |
Final Verdict: ICP could offer an attractive long-term recovery opportunity, but confirmation above $2.61 is important. Consider scaling into the position rather than entering all at once.
Long-term speculative setup. The monthly downtrend is not yet reversed.
#ICP. #InternetComputer #TradingIdeas #TradingSignals
Current Price: $2.462
### Technical Analysis
* ICP is trading near historical support around $2.20–$2.50.
* RSI (6) at 42 indicates recovering momentum.
* Price remains below EMA 7 ($2.612) and EMA 25 ($4.620), confirming that the long-term trend is still bearish.
* A monthly breakout above $2.60–$3.00 would strengthen the bullish scenario.
Key Levels:
* Support: $2.20 / $1.858
* Resistance: $2.61 / $3.44 / $4.62
### Fundamental Analysis
ICP is a decentralized cloud computing blockchain with strong potential in AI, Web3 and cross-chain applications.
* Supports decentralized applications and on-chain computing.
* Chain Fusion connects ICP with other blockchains.
* Its tokenomics combines staking rewards with token burning. internetcomputer.org +2
### LONG Trade Plan
| Target | Price |
| ---------- | ----------- |
| Entry zone | $2.30–$2.46 |
| Stop Loss | $1.80 |
| TP1 | $3.00 |
| TP2 | $3.44 |
| TP3 | $4.62 |
Final Verdict: ICP could offer an attractive long-term recovery opportunity, but confirmation above $2.61 is important. Consider scaling into the position rather than entering all at once.
Long-term speculative setup. The monthly downtrend is not yet reversed.
#ICP. #InternetComputer #TradingIdeas #TradingSignals
2
2
216
·
--
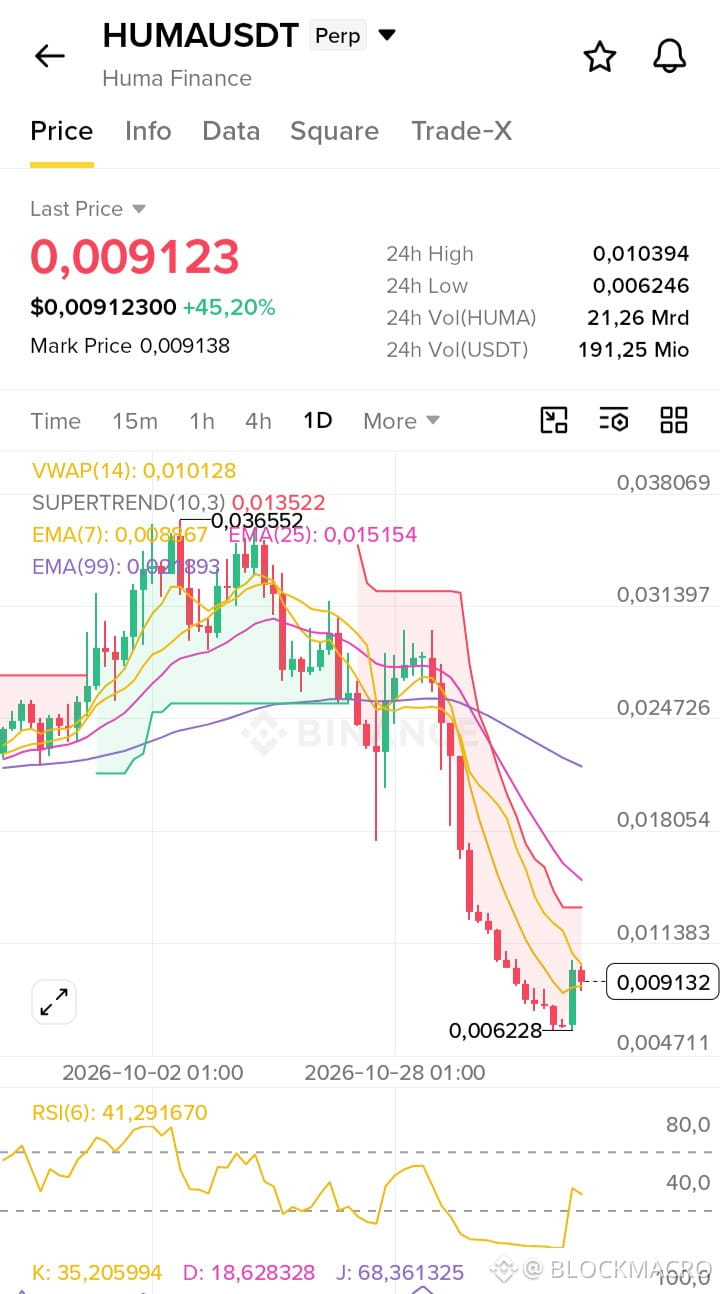
#humausdt (1D) – LONG Setup
Technical Analysis:
* Price: $0.009123
* RSI (6): 41, recovering from oversold levels.
* Price is slightly above EMA 7, showing early bullish momentum.
* Major support: $0.006228.
* Resistance: $0.0101, $0.0114 and $0.0135.
* Overall daily trend remains bearish.
Fundamental Analysis: Huma Finance operates in the growing PayFi and RWA sectors, offering real-world payment and financing solutions. However, token unlocks may create selling pressure.
LONG Trade Plan:
* Entry: $0.0087–$0.0091
* Stop Loss: $0.0080
* TP1: $0.0101
* TP2: $0.0114
* TP3: $0.0135
Verdict: Early recovery signs are emerging, but confirmation above $0.0101 is needed before considering a stronger bullish reversal. Avoid excessive leverage.
$HUMA #TradingSignals
#humausdt (1D) – LONG Setup
Technical Analysis:
* Price: $0.009123
* RSI (6): 41, recovering from oversold levels.
* Price is slightly above EMA 7, showing early bullish momentum.
* Major support: $0.006228.
* Resistance: $0.0101, $0.0114 and $0.0135.
* Overall daily trend remains bearish.
Fundamental Analysis: Huma Finance operates in the growing PayFi and RWA sectors, offering real-world payment and financing solutions. However, token unlocks may create selling pressure.
LONG Trade Plan:
* Entry: $0.0087–$0.0091
* Stop Loss: $0.0080
* TP1: $0.0101
* TP2: $0.0114
* TP3: $0.0135
Verdict: Early recovery signs are emerging, but confirmation above $0.0101 is needed before considering a stronger bullish reversal. Avoid excessive leverage.
$HUMA #TradingSignals
Technical Analysis:
* Price: $0.009123
* RSI (6): 41, recovering from oversold levels.
* Price is slightly above EMA 7, showing early bullish momentum.
* Major support: $0.006228.
* Resistance: $0.0101, $0.0114 and $0.0135.
* Overall daily trend remains bearish.
Fundamental Analysis: Huma Finance operates in the growing PayFi and RWA sectors, offering real-world payment and financing solutions. However, token unlocks may create selling pressure.
LONG Trade Plan:
* Entry: $0.0087–$0.0091
* Stop Loss: $0.0080
* TP1: $0.0101
* TP2: $0.0114
* TP3: $0.0135
Verdict: Early recovery signs are emerging, but confirmation above $0.0101 is needed before considering a stronger bullish reversal. Avoid excessive leverage.
$HUMA #TradingSignals
1
145
·
--
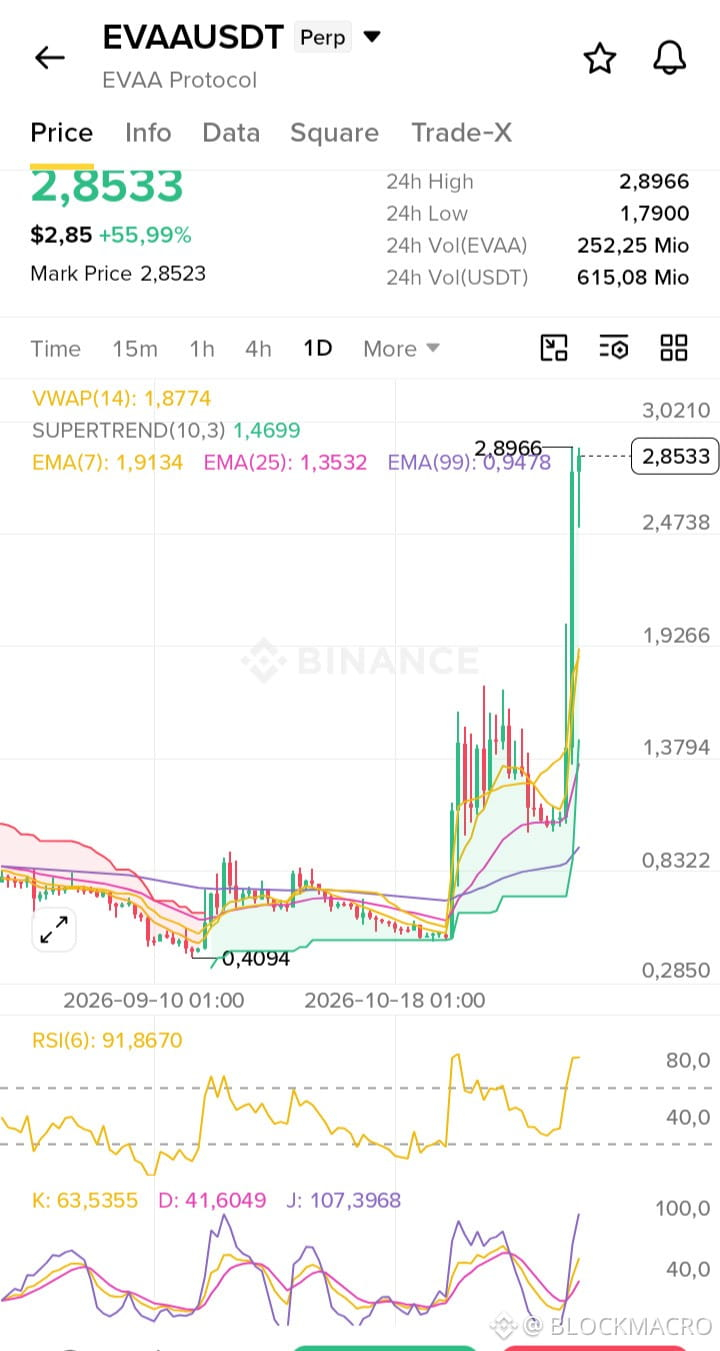
#EVAAUSDT — Technical & Fundamental Analysis
1D timeframe | Price: $2.8533
Technical outlook: Bullish, but extremely overbought.
* EMA 7: $1.9134
* EMA 25: $1.3532
* EMA 99: $0.9478
* RSI (6): 91.87 — extremely overbought.
* Supertrend: $1.4699 — bullish.
Key resistance: $2.90 – $3.02
Key support: $2.47 – $2.50 / $1.90 – $1.95
### LONG setup
* Entry: $2.47–$2.55
* SL: $2.29
* TP1: $2.90
* TP2: $3.02
* TP3: $3.30
Wait for bullish confirmation on 4H.
### SHORT setup
* Entry: $2.90–$3.00 after bearish rejection
* SL: $3.12
* TP1: $2.50
* TP2: $1.95
* TP3: $1.50
Alternative: Short after a confirmed 4H breakdown below $2.47.
### Fundamental outlook
$EVAA is a DeFi lending protocol within the TON ecosystem. It has real utility and institutional backing, but declining TVL and upcoming token unlocks create potential selling pressure.
### Final verdict
Bullish trend, but correction risk is high.
My preference: Wait for a pullback toward $2.50 before considering a LONG. Avoid chasing the current price or shorting without confirmation.
Risk management: Low leverage, maximum 0.5–1% account risk per trade.
$EVAA #EVAAUSDT
#EVAAUSDT — Technical & Fundamental Analysis
1D timeframe | Price: $2.8533
Technical outlook: Bullish, but extremely overbought.
* EMA 7: $1.9134
* EMA 25: $1.3532
* EMA 99: $0.9478
* RSI (6): 91.87 — extremely overbought.
* Supertrend: $1.4699 — bullish.
Key resistance: $2.90 – $3.02
Key support: $2.47 – $2.50 / $1.90 – $1.95
### LONG setup
* Entry: $2.47–$2.55
* SL: $2.29
* TP1: $2.90
* TP2: $3.02
* TP3: $3.30
Wait for bullish confirmation on 4H.
### SHORT setup
* Entry: $2.90–$3.00 after bearish rejection
* SL: $3.12
* TP1: $2.50
* TP2: $1.95
* TP3: $1.50
Alternative: Short after a confirmed 4H breakdown below $2.47.
### Fundamental outlook
$EVAA is a DeFi lending protocol within the TON ecosystem. It has real utility and institutional backing, but declining TVL and upcoming token unlocks create potential selling pressure.
### Final verdict
Bullish trend, but correction risk is high.
My preference: Wait for a pullback toward $2.50 before considering a LONG. Avoid chasing the current price or shorting without confirmation.
Risk management: Low leverage, maximum 0.5–1% account risk per trade.
$EVAA #EVAAUSDT
1D timeframe | Price: $2.8533
Technical outlook: Bullish, but extremely overbought.
* EMA 7: $1.9134
* EMA 25: $1.3532
* EMA 99: $0.9478
* RSI (6): 91.87 — extremely overbought.
* Supertrend: $1.4699 — bullish.
Key resistance: $2.90 – $3.02
Key support: $2.47 – $2.50 / $1.90 – $1.95
### LONG setup
* Entry: $2.47–$2.55
* SL: $2.29
* TP1: $2.90
* TP2: $3.02
* TP3: $3.30
Wait for bullish confirmation on 4H.
### SHORT setup
* Entry: $2.90–$3.00 after bearish rejection
* SL: $3.12
* TP1: $2.50
* TP2: $1.95
* TP3: $1.50
Alternative: Short after a confirmed 4H breakdown below $2.47.
### Fundamental outlook
$EVAA is a DeFi lending protocol within the TON ecosystem. It has real utility and institutional backing, but declining TVL and upcoming token unlocks create potential selling pressure.
### Final verdict
Bullish trend, but correction risk is high.
My preference: Wait for a pullback toward $2.50 before considering a LONG. Avoid chasing the current price or shorting without confirmation.
Risk management: Low leverage, maximum 0.5–1% account risk per trade.
$EVAA #EVAAUSDT
395
·
--
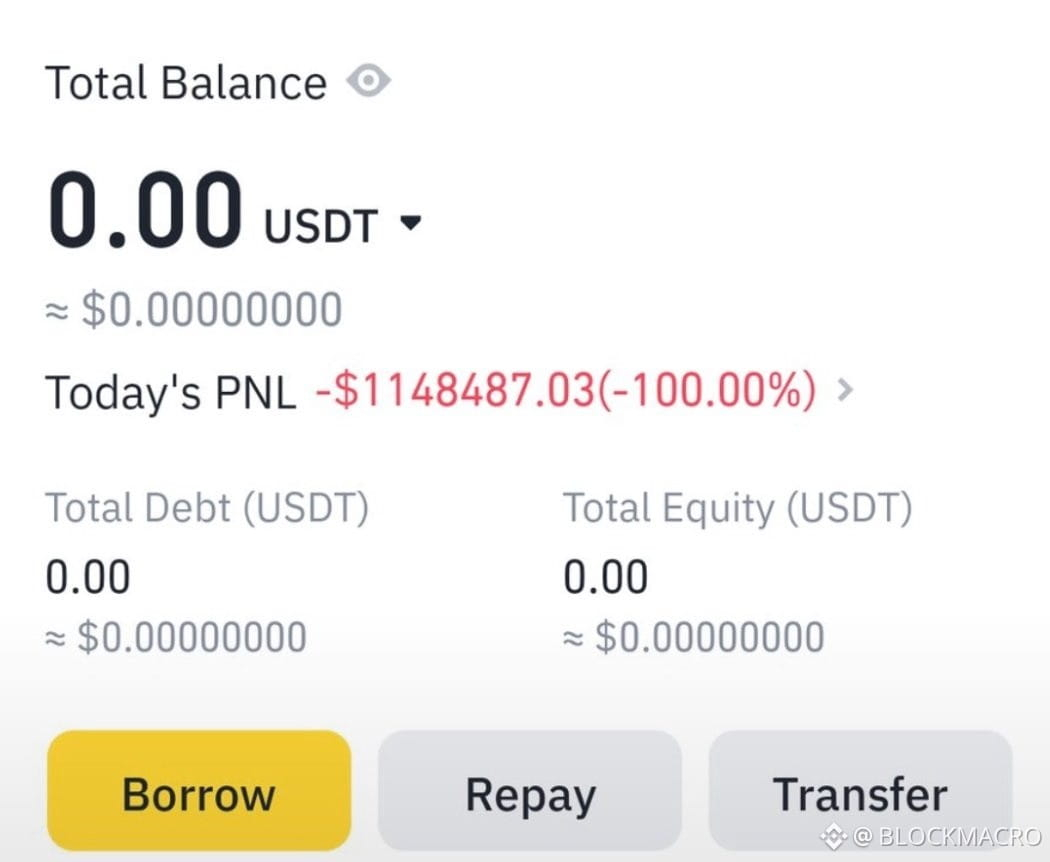
He was waiting for the next bull run. Instead, he woke up to a financial nightmare.
A trader went all-in on leveraged long positions across multiple cryptocurrencies, expecting the market to surge.
But yesterday’s market crash changed everything…
💀 $1,148,487 LOST IN A SINGLE DAY.
His account balance: 0.00 USDT.
This wasn't just another losing trade. It was years of hard work wiped out in a matter of hours.
The lesson?
Leverage can multiply your profits, but it can destroy your capital just as quickly.
Never confuse a bull market expectation with a guaranteed outcome.
Protect your capital. Manage your risk. Survival comes first.
$BTC #CryptoPatience #TradingTales #RiskManagement #Leverage: #cryptocrash
He was waiting for the next bull run. Instead, he woke up to a financial nightmare.
A trader went all-in on leveraged long positions across multiple cryptocurrencies, expecting the market to surge.
But yesterday’s market crash changed everything…
💀 $1,148,487 LOST IN A SINGLE DAY.
His account balance: 0.00 USDT.
This wasn't just another losing trade. It was years of hard work wiped out in a matter of hours.
The lesson?
Leverage can multiply your profits, but it can destroy your capital just as quickly.
Never confuse a bull market expectation with a guaranteed outcome.
Protect your capital. Manage your risk. Survival comes first.
$BTC #CryptoPatience #TradingTales #RiskManagement #Leverage: #cryptocrash
A trader went all-in on leveraged long positions across multiple cryptocurrencies, expecting the market to surge.
But yesterday’s market crash changed everything…
💀 $1,148,487 LOST IN A SINGLE DAY.
His account balance: 0.00 USDT.
This wasn't just another losing trade. It was years of hard work wiped out in a matter of hours.
The lesson?
Leverage can multiply your profits, but it can destroy your capital just as quickly.
Never confuse a bull market expectation with a guaranteed outcome.
Protect your capital. Manage your risk. Survival comes first.
$BTC #CryptoPatience #TradingTales #RiskManagement #Leverage: #cryptocrash
1
1
101
·
--
BLACK WEDNESDAY: The Day George Soros Made $1 Billion
On September 16, 1992, financial history witnessed one of the most legendary trades ever.
George Soros, through his Quantum Fund, bet heavily against the British pound, reportedly making nearly $1 billion in profit in a single day.
The Bank of England desperately tried to defend the pound by buying its own currency and raising interest rates from 10% to 12%, then announcing 15%. But the pressure was too strong. Britain eventually abandoned the European Exchange Rate Mechanism (ERM).
Soros became known as “The Man Who Broke the Bank of England.
What Can Traders Learn From This?
Understand the fundamentals: Never trade against economic reality.
Think independently: The biggest opportunities often appear when the majority is wrong.
Recognize market weakness: Even central banks cannot fight powerful market forces forever.
Have conviction and discipline: A strong trade requires research, timing, and risk management.
The greatest lesson of Black Wednesday:
"Don't fight the market when the fundamentals are against you. Even the most powerful institutions can lose when reality catches up with them."
A question for traders: If you had been trading GBP in September 1992, would you have followed the Bank of England or George Soros.
#FinancialWisdom #FinancialIntelligence $BTC $ETH
BLACK WEDNESDAY: The Day George Soros Made $1 Billion
On September 16, 1992, financial history witnessed one of the most legendary trades ever.
George Soros, through his Quantum Fund, bet heavily against the British pound, reportedly making nearly $1 billion in profit in a single day.
The Bank of England desperately tried to defend the pound by buying its own currency and raising interest rates from 10% to 12%, then announcing 15%. But the pressure was too strong. Britain eventually abandoned the European Exchange Rate Mechanism (ERM).
Soros became known as “The Man Who Broke the Bank of England.
What Can Traders Learn From This?
Understand the fundamentals: Never trade against economic reality.
Think independently: The biggest opportunities often appear when the majority is wrong.
Recognize market weakness: Even central banks cannot fight powerful market forces forever.
Have conviction and discipline: A strong trade requires research, timing, and risk management.
The greatest lesson of Black Wednesday:
"Don't fight the market when the fundamentals are against you. Even the most powerful institutions can lose when reality catches up with them."
A question for traders: If you had been trading GBP in September 1992, would you have followed the Bank of England or George Soros.
#FinancialWisdom #FinancialIntelligence $BTC $ETH
On September 16, 1992, financial history witnessed one of the most legendary trades ever.
George Soros, through his Quantum Fund, bet heavily against the British pound, reportedly making nearly $1 billion in profit in a single day.
The Bank of England desperately tried to defend the pound by buying its own currency and raising interest rates from 10% to 12%, then announcing 15%. But the pressure was too strong. Britain eventually abandoned the European Exchange Rate Mechanism (ERM).
Soros became known as “The Man Who Broke the Bank of England.
What Can Traders Learn From This?
Understand the fundamentals: Never trade against economic reality.
Think independently: The biggest opportunities often appear when the majority is wrong.
Recognize market weakness: Even central banks cannot fight powerful market forces forever.
Have conviction and discipline: A strong trade requires research, timing, and risk management.
The greatest lesson of Black Wednesday:
"Don't fight the market when the fundamentals are against you. Even the most powerful institutions can lose when reality catches up with them."
A question for traders: If you had been trading GBP in September 1992, would you have followed the Bank of England or George Soros.
#FinancialWisdom #FinancialIntelligence $BTC $ETH

2
1
1
62
·
--
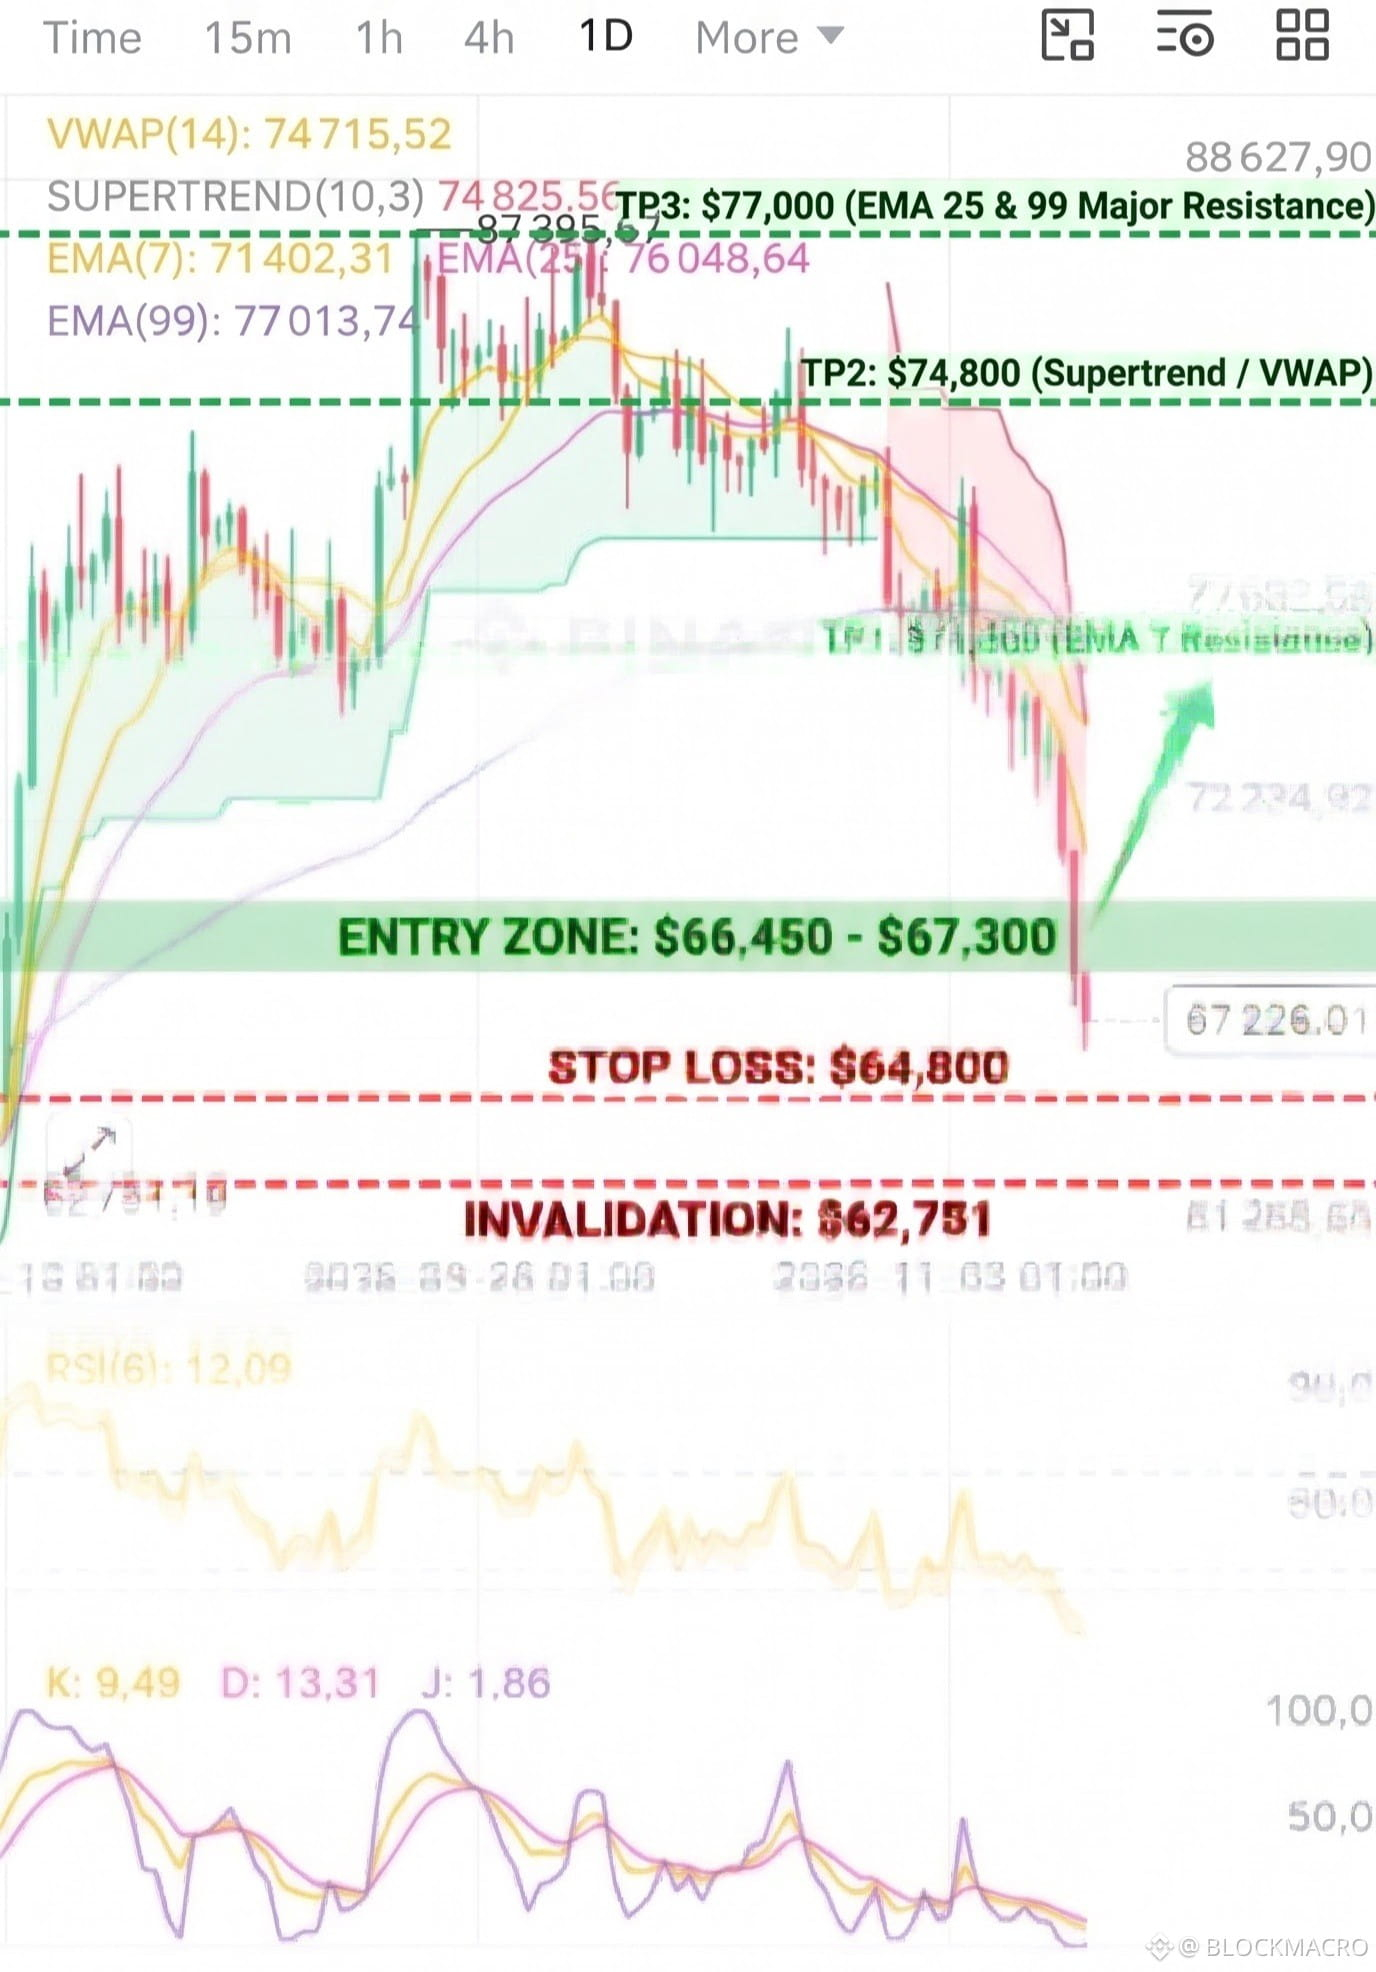
$BTC (1D) — Long Setup Analysis
Technical Outlook: Bitcoin remains strongly bearish, trading below EMA 7 ($71,402), EMA 25 ($76,048), EMA 99 ($77,013), and Supertrend ($74,825).
However, extreme oversold signals suggest a potential short-term rebound:
RSI (6): 12.09
KDJ: 9.49 / 13.31 / 1.86
Fundamental Outlook: Heavy selling and long liquidations have pushed BTC down from $87,395 to $67,226. Nevertheless, institutional adoption, Bitcoin's scarcity, and potential demand around $65K–$67K could support a recovery.
Long Trade Setup:
Entry: $66,450–$67,300
Stop Loss: $64,800
TP1: $71,400
TP2: $74,700–$74,825
TP3: $76,050–$77,000
Conclusion: A relief bounce is possible, but the daily trend remains bearish. Wait for bullish 4H confirmation before entering.
High-risk counter-trend setup. Manage risk carefully.
$BTC #Binance #BTC走势分析 #TradingSignals
$BTC (1D) — Long Setup Analysis
Technical Outlook: Bitcoin remains strongly bearish, trading below EMA 7 ($71,402), EMA 25 ($76,048), EMA 99 ($77,013), and Supertrend ($74,825).
However, extreme oversold signals suggest a potential short-term rebound:
RSI (6): 12.09
KDJ: 9.49 / 13.31 / 1.86
Fundamental Outlook: Heavy selling and long liquidations have pushed BTC down from $87,395 to $67,226. Nevertheless, institutional adoption, Bitcoin's scarcity, and potential demand around $65K–$67K could support a recovery.
Long Trade Setup:
Entry: $66,450–$67,300
Stop Loss: $64,800
TP1: $71,400
TP2: $74,700–$74,825
TP3: $76,050–$77,000
Conclusion: A relief bounce is possible, but the daily trend remains bearish. Wait for bullish 4H confirmation before entering.
High-risk counter-trend setup. Manage risk carefully.
$BTC #Binance #BTC走势分析 #TradingSignals
Technical Outlook: Bitcoin remains strongly bearish, trading below EMA 7 ($71,402), EMA 25 ($76,048), EMA 99 ($77,013), and Supertrend ($74,825).
However, extreme oversold signals suggest a potential short-term rebound:
RSI (6): 12.09
KDJ: 9.49 / 13.31 / 1.86
Fundamental Outlook: Heavy selling and long liquidations have pushed BTC down from $87,395 to $67,226. Nevertheless, institutional adoption, Bitcoin's scarcity, and potential demand around $65K–$67K could support a recovery.
Long Trade Setup:
Entry: $66,450–$67,300
Stop Loss: $64,800
TP1: $71,400
TP2: $74,700–$74,825
TP3: $76,050–$77,000
Conclusion: A relief bounce is possible, but the daily trend remains bearish. Wait for bullish 4H confirmation before entering.
High-risk counter-trend setup. Manage risk carefully.
$BTC #Binance #BTC走势分析 #TradingSignals
2
137
·
--
What happens when everything falls? 🔴📉
Stocks, crypto, gold, silver—usually, when one goes down, investors look for safety in another. But today, the entire screen is a sea of red. When absolutely everything is dropping simultaneously, it’s a rare and unsettling event.
So, what does it mean when there is truly nowhere to hide?
1️⃣ The Dash for Cash: This isn’t just a market dip; it’s a "liquidity squeeze." When panic hits, or when heavily leveraged traders face margin calls, they are forced to sell everything—even their safest assets like gold—just to get cash. Liquidating whatever they can to survive the storm causes everything to fall at once.
2️⃣ Fear Over Fundamentals: Right now, logic is taking a back seat to emotion. When fear dominates, investors don't care if an asset is historically a "safe haven" or has "future utility." They just want out.
3️⃣ Macroeconomic Gravity: Rising interest rates, inflation worries, or global instability can act like a giant anchor, dragging every asset class down together.
It’s easy to panic when the entire board is bleeding, but history shows us that these "correlated drops" are often the most intense, yet temporary, phases of a market cycle. The dust eventually settles, and the forced selling stops.
Take a deep breath, step away from the screens, and remember: markets have always found their footing eventually. How are you holding up through this?
#marketcrash $BTC $ $ETH #XAUUSD
What happens when everything falls? 🔴📉
Stocks, crypto, gold, silver—usually, when one goes down, investors look for safety in another. But today, the entire screen is a sea of red. When absolutely everything is dropping simultaneously, it’s a rare and unsettling event.
So, what does it mean when there is truly nowhere to hide?
1️⃣ The Dash for Cash: This isn’t just a market dip; it’s a "liquidity squeeze." When panic hits, or when heavily leveraged traders face margin calls, they are forced to sell everything—even their safest assets like gold—just to get cash. Liquidating whatever they can to survive the storm causes everything to fall at once.
2️⃣ Fear Over Fundamentals: Right now, logic is taking a back seat to emotion. When fear dominates, investors don't care if an asset is historically a "safe haven" or has "future utility." They just want out.
3️⃣ Macroeconomic Gravity: Rising interest rates, inflation worries, or global instability can act like a giant anchor, dragging every asset class down together.
It’s easy to panic when the entire board is bleeding, but history shows us that these "correlated drops" are often the most intense, yet temporary, phases of a market cycle. The dust eventually settles, and the forced selling stops.
Take a deep breath, step away from the screens, and remember: markets have always found their footing eventually. How are you holding up through this?
#marketcrash $BTC $ $ETH #XAUUSD
Stocks, crypto, gold, silver—usually, when one goes down, investors look for safety in another. But today, the entire screen is a sea of red. When absolutely everything is dropping simultaneously, it’s a rare and unsettling event.
So, what does it mean when there is truly nowhere to hide?
1️⃣ The Dash for Cash: This isn’t just a market dip; it’s a "liquidity squeeze." When panic hits, or when heavily leveraged traders face margin calls, they are forced to sell everything—even their safest assets like gold—just to get cash. Liquidating whatever they can to survive the storm causes everything to fall at once.
2️⃣ Fear Over Fundamentals: Right now, logic is taking a back seat to emotion. When fear dominates, investors don't care if an asset is historically a "safe haven" or has "future utility." They just want out.
3️⃣ Macroeconomic Gravity: Rising interest rates, inflation worries, or global instability can act like a giant anchor, dragging every asset class down together.
It’s easy to panic when the entire board is bleeding, but history shows us that these "correlated drops" are often the most intense, yet temporary, phases of a market cycle. The dust eventually settles, and the forced selling stops.
Take a deep breath, step away from the screens, and remember: markets have always found their footing eventually. How are you holding up through this?
#marketcrash $BTC $ $ETH #XAUUSD

2
1
95
·
--
very good
very good
ETHUNT
·
--
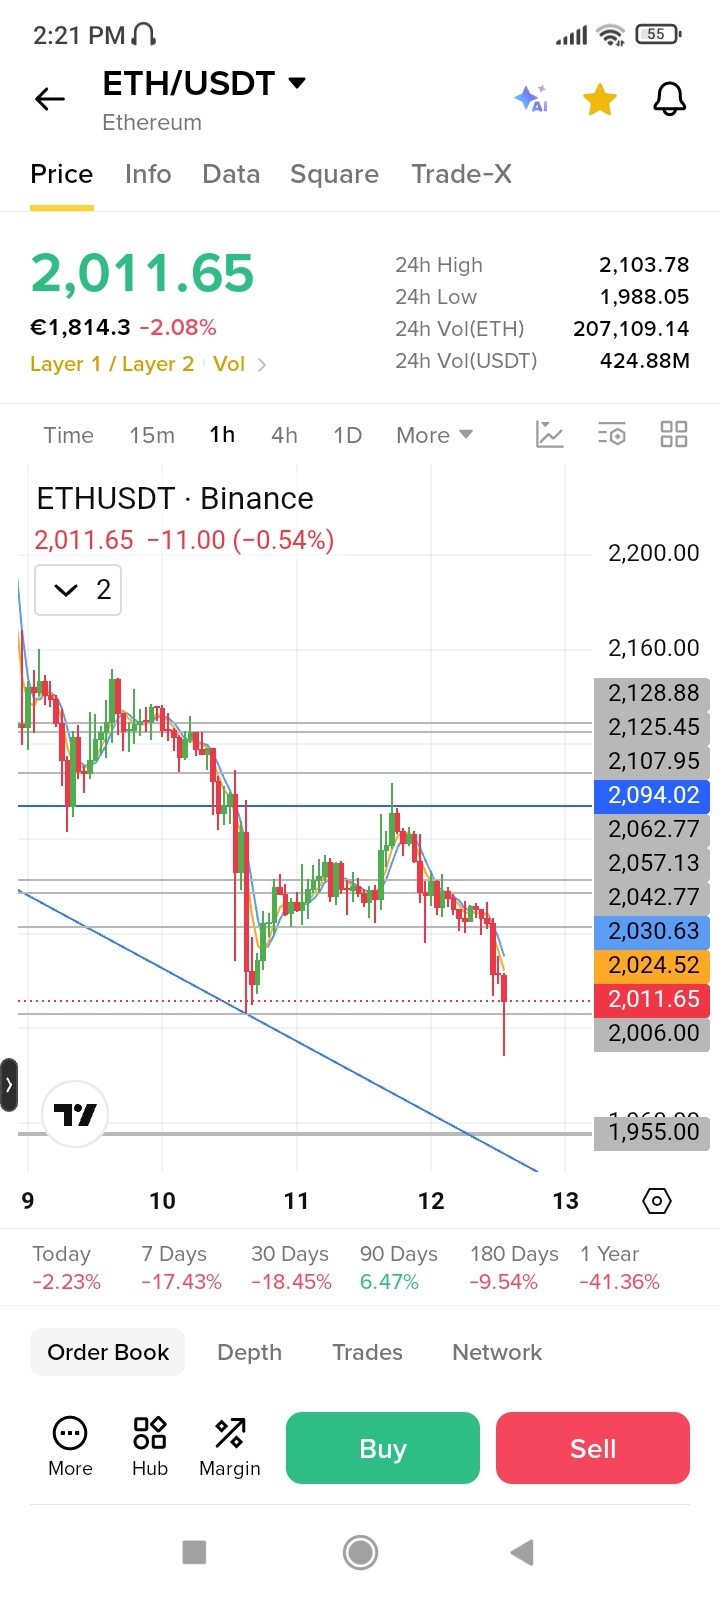
$ETH #Ethereum
It looks like Ethereum is heading toward the first target at 1955.00, just as I predicted in my previous post.
https://app.binance.com/uni-qr/cpos/386651577778194?r=A0PMVUF9&l=en&uco=fvpIXSKVYrLtb_C2p0GlWw&uc=app_square_share_link&us=copylink
But can it drop even further and hit the other two targets as well: 1872.00 – 1735.00???
#TradingSignals #TradingIdeas
It looks like Ethereum is heading toward the first target at 1955.00, just as I predicted in my previous post.
https://app.binance.com/uni-qr/cpos/386651577778194?r=A0PMVUF9&l=en&uco=fvpIXSKVYrLtb_C2p0GlWw&uc=app_square_share_link&us=copylink
But can it drop even further and hit the other two targets as well: 1872.00 – 1735.00???
#TradingSignals #TradingIdeas
1
17
·
--
Fundamental Analysis: Lombard (BARD)
Core Utility: BARD is the native governance and utility token of Lombard, a leading Bitcoin DeFi (BTCFi) infrastructure protocol. It powers liquid Bitcoin staking via LBTC (backed 1:1 by native BTC), enabling holders to deploy Bitcoin across DeFi ecosystems to generate yield without sacrificing liquidity.
Tokenomics & Risks: Out of a 1 billion BARD max supply, roughly 396.56 million (39.66%) are currently in circulation. While the project has strong institutional backing (including YZi Labs) and solid liquidity, traders should watch for the upcoming 22.81 million BARD token unlock on November 18, as well as the fact that the token remains over 90% below its all-time high ($1.72).
Verdict: Strong infrastructure fundamentals within the BTCFi narrative, but the recent +60% surge is heavily momentum-driven and warrants caution ahead of the mid-November unlock.
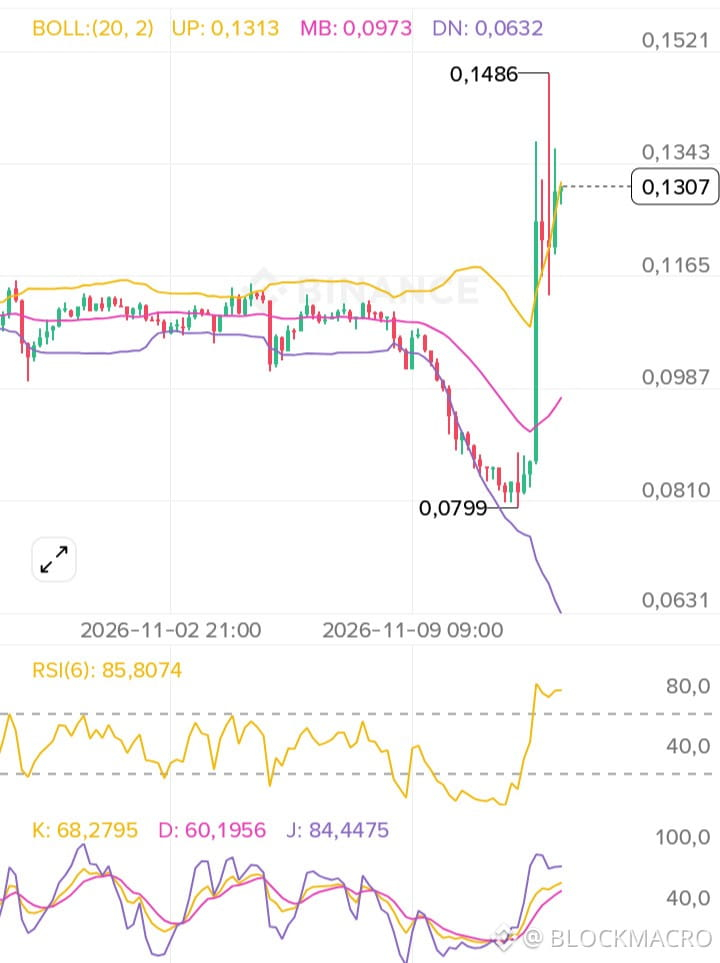
Technical Analysis (4H Chart — BARDUSDT)
Price Action & Trend: BARD staged an explosive breakout from a local bottom at $0.0799 up to a peak of $0.1486, currently consolidating near $0.1307.
Indicators:
Bollinger Bands: Price is hugging the upper band ($0.1313), confirming strong bullish momentum while signaling short-term overextension and a high probability of a pullback or sideways consolidation.
RSI (6) at 85.80: Deep in overbought territory, making an immediate market entry risky. Waiting for a retest of the breakout zone offers a much better risk-to-reward profile.
Long Trade Setup & Targets
LevelPrice (USDT)Technical RationaleEntry Zone$0.1140 – $0.1185Retest of the prior resistance zone flipped into supportStop Loss (SL)$0.0965Below the Bollinger middle band ($0.0973) to invalidate bullish momentumTarget 1 (TP1)$0.1343Immediate minor swing high resistanceTarget 2 (TP2)$0.1486Recent local high on the chartTarget 3 (TP3)$0.1650Measured wave extension upon a confirmed breakout above $0.1486
Note: With RSI above 85 and the November 18 token unlock approaching, use conservative leverage and secure partial profits at TP1.
$BARD #BARDUSDT #TradingSignal
Fundamental Analysis: Lombard (BARD)
Core Utility: BARD is the native governance and utility token of Lombard, a leading Bitcoin DeFi (BTCFi) infrastructure protocol. It powers liquid Bitcoin staking via LBTC (backed 1:1 by native BTC), enabling holders to deploy Bitcoin across DeFi ecosystems to generate yield without sacrificing liquidity.
Tokenomics & Risks: Out of a 1 billion BARD max supply, roughly 396.56 million (39.66%) are currently in circulation. While the project has strong institutional backing (including YZi Labs) and solid liquidity, traders should watch for the upcoming 22.81 million BARD token unlock on November 18, as well as the fact that the token remains over 90% below its all-time high ($1.72).
Verdict: Strong infrastructure fundamentals within the BTCFi narrative, but the recent +60% surge is heavily momentum-driven and warrants caution ahead of the mid-November unlock.
Technical Analysis (4H Chart — BARDUSDT)
Price Action & Trend: BARD staged an explosive breakout from a local bottom at $0.0799 up to a peak of $0.1486, currently consolidating near $0.1307.
Indicators:
Bollinger Bands: Price is hugging the upper band ($0.1313), confirming strong bullish momentum while signaling short-term overextension and a high probability of a pullback or sideways consolidation.
RSI (6) at 85.80: Deep in overbought territory, making an immediate market entry risky. Waiting for a retest of the breakout zone offers a much better risk-to-reward profile.
Long Trade Setup & Targets
LevelPrice (USDT)Technical RationaleEntry Zone$0.1140 – $0.1185Retest of the prior resistance zone flipped into supportStop Loss (SL)$0.0965Below the Bollinger middle band ($0.0973) to invalidate bullish momentumTarget 1 (TP1)$0.1343Immediate minor swing high resistanceTarget 2 (TP2)$0.1486Recent local high on the chartTarget 3 (TP3)$0.1650Measured wave extension upon a confirmed breakout above $0.1486
Note: With RSI above 85 and the November 18 token unlock approaching, use conservative leverage and secure partial profits at TP1.
$BARD #BARDUSDT #TradingSignal
Core Utility: BARD is the native governance and utility token of Lombard, a leading Bitcoin DeFi (BTCFi) infrastructure protocol. It powers liquid Bitcoin staking via LBTC (backed 1:1 by native BTC), enabling holders to deploy Bitcoin across DeFi ecosystems to generate yield without sacrificing liquidity.
Tokenomics & Risks: Out of a 1 billion BARD max supply, roughly 396.56 million (39.66%) are currently in circulation. While the project has strong institutional backing (including YZi Labs) and solid liquidity, traders should watch for the upcoming 22.81 million BARD token unlock on November 18, as well as the fact that the token remains over 90% below its all-time high ($1.72).
Verdict: Strong infrastructure fundamentals within the BTCFi narrative, but the recent +60% surge is heavily momentum-driven and warrants caution ahead of the mid-November unlock.
Technical Analysis (4H Chart — BARDUSDT)
Price Action & Trend: BARD staged an explosive breakout from a local bottom at $0.0799 up to a peak of $0.1486, currently consolidating near $0.1307.
Indicators:
Bollinger Bands: Price is hugging the upper band ($0.1313), confirming strong bullish momentum while signaling short-term overextension and a high probability of a pullback or sideways consolidation.
RSI (6) at 85.80: Deep in overbought territory, making an immediate market entry risky. Waiting for a retest of the breakout zone offers a much better risk-to-reward profile.
Long Trade Setup & Targets
LevelPrice (USDT)Technical RationaleEntry Zone$0.1140 – $0.1185Retest of the prior resistance zone flipped into supportStop Loss (SL)$0.0965Below the Bollinger middle band ($0.0973) to invalidate bullish momentumTarget 1 (TP1)$0.1343Immediate minor swing high resistanceTarget 2 (TP2)$0.1486Recent local high on the chartTarget 3 (TP3)$0.1650Measured wave extension upon a confirmed breakout above $0.1486
Note: With RSI above 85 and the November 18 token unlock approaching, use conservative leverage and secure partial profits at TP1.
$BARD #BARDUSDT #TradingSignal
173
Log in to explore more content
Join global crypto users on Binance Square
⚡️ Get latest and useful information about crypto.
💬 Trusted by the world’s largest crypto exchange.
👍 Discover real insights from verified creators.
Email / Phone number
Trending Topics
CanBTCReboundAfterFallingBelow60K?
117,398 views
509 Discussing
Bitcoin News | Bitcoin Falls Below $60,000 for the First Time Since July as IBIT Posts Record $541 Million Outflow
Binance News
·40 Likes
·70.9k views
GlobalStocksFaceLongestLosingStreakSince2023
51,548 views
497 Discussing
AnthropicPlungesTowardIPOPriceonDay2
17,093 views
200 Discussing