
#bonk
bonk
191.6M views
461,445 Discussing
Hot
Latest

·
--
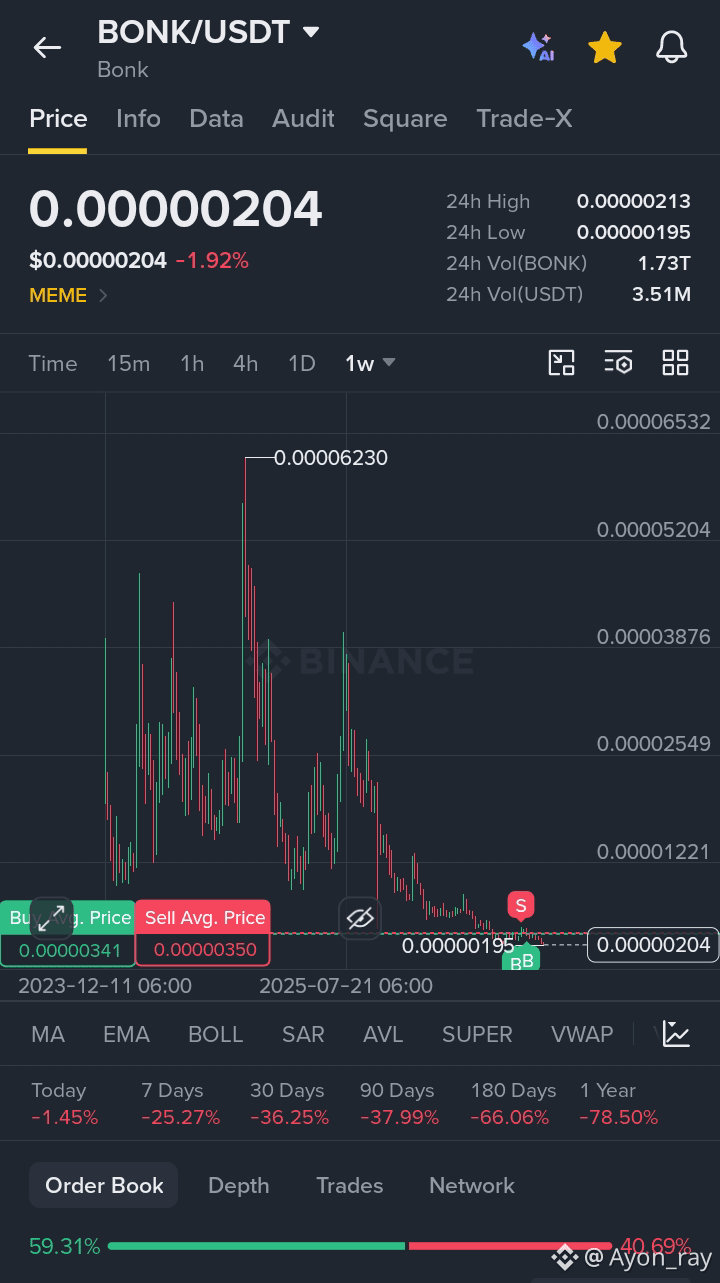
$BONK is trading around 0.00000204—a steep pullback from the 0.000006230 peak—while the order book shows nearly 59.31% buyer pressure. Relief bounce or more downside ahead? Drop your thoughts below! 👇🔥
#Bonk #Binance
{spot}(BONKUSDT)
#BinanceSquare #memecoins #cryptotrading
$BONK is trading around 0.00000204—a steep pullback from the 0.000006230 peak—while the order book shows nearly 59.31% buyer pressure. Relief bounce or more downside ahead? Drop your thoughts below! 👇🔥
#Bonk #Binance
#BinanceSquare #memecoins #cryptotrading
#Bonk #Binance
#BinanceSquare #memecoins #cryptotrading
1
404

Half a million coins for one dollar. That's BONK right now.
$1 buys you roughly 485,000 BONK at $0.00000206. The joke writes itself — but the chart isn't funny. Down 2.4% today, down 38% in a month, 76% down this year. It's basically flatlining between $0.00000195 and $0.00000213 today.
Still, it's holding a $312M market cap, and it bounced with the rest of the market when Bitcoin clawed back above $60K. Meme coins move first when the market turns — they also fall first when it doesn't.
Watch the $0.00000195 low. Lose it and there's not much underneath. Reclaim $0.00000213 and the memecoin crowd wakes up.
Not financial advice. DYOR.
$BONK $BTC
#Bonk #Crypto #Memecoins
Half a million coins for one dollar. That's BONK right now.
$1 buys you roughly 485,000 BONK at $0.00000206. The joke writes itself — but the chart isn't funny. Down 2.4% today, down 38% in a month, 76% down this year. It's basically flatlining between $0.00000195 and $0.00000213 today.
Still, it's holding a $312M market cap, and it bounced with the rest of the market when Bitcoin clawed back above $60K. Meme coins move first when the market turns — they also fall first when it doesn't.
Watch the $0.00000195 low. Lose it and there's not much underneath. Reclaim $0.00000213 and the memecoin crowd wakes up.
Not financial advice. DYOR.
$BONK $BTC
#Bonk #Crypto #Memecoins
$1 buys you roughly 485,000 BONK at $0.00000206. The joke writes itself — but the chart isn't funny. Down 2.4% today, down 38% in a month, 76% down this year. It's basically flatlining between $0.00000195 and $0.00000213 today.
Still, it's holding a $312M market cap, and it bounced with the rest of the market when Bitcoin clawed back above $60K. Meme coins move first when the market turns — they also fall first when it doesn't.
Watch the $0.00000195 low. Lose it and there's not much underneath. Reclaim $0.00000213 and the memecoin crowd wakes up.
Not financial advice. DYOR.
$BONK $BTC
#Bonk #Crypto #Memecoins
4
·
--
📈 $BONK Daily Snapshot
Price: $0.0000019900
Today's movement: -10.36%
The 24H range extends from $0.0000019500 to $0.0000022600.
Volume: $4.07M
Are you watching volume or price action?
#BONK
📈 $BONK Daily Snapshot
Price: $0.0000019900
Today's movement: -10.36%
The 24H range extends from $0.0000019500 to $0.0000022600.
Volume: $4.07M
Are you watching volume or price action?
#BONK
Price: $0.0000019900
Today's movement: -10.36%
The 24H range extends from $0.0000019500 to $0.0000022600.
Volume: $4.07M
Are you watching volume or price action?
#BONK
2
410
·
--
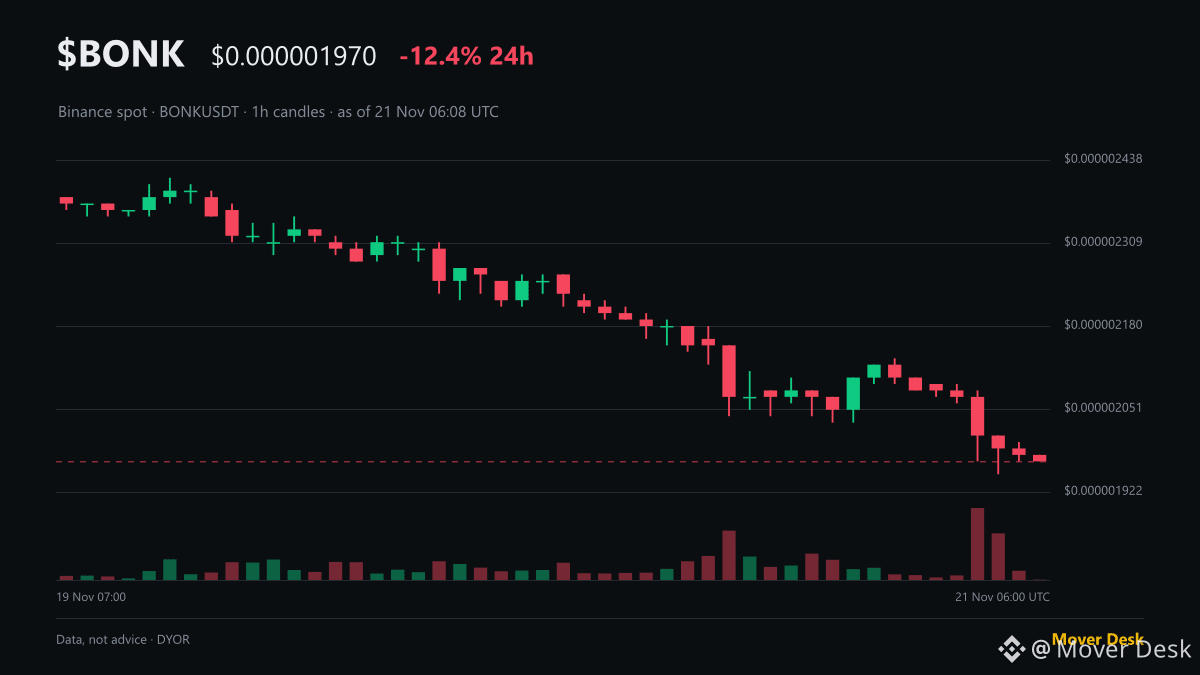
$BONK shorts are paying longs at -0.0222% as of 06:06 UTC: here is what funding tells you.
With 24h price down -12.4% to $0.000001970, sellers are crowded enough that holding short positions costs money.
Perpetual futures have no expiry date. To keep contracts pegged near spot, exchanges balance positioning through periodic payments between traders.
Above the standard +0.01% baseline, longs pay shorts. When funding turns negative, perps trade below spot and shorts pay longs to maintain exposure.
Funding is not a directional price signal on its own; it simply measures leverage imbalance.
Today's Binance 1000BONKUSDT numbers show this in action:
Funding rate sits at -0.0222% this period.
The account ratio is 0.87 (46% of accounts long, 54% short).
Open interest rose +3% to $9.2M, with price trading just off the 24h low of $0.000001950 (high: $0.000002260).
Risk note: 24h volume is light at $4.1M with +0.0% hourly movement, leaving thin books prone to volatility if crowded positions close fast.
Do you factor negative funding into your trade setups, or do you treat it as secondary data?
Mover Desk · numbers, not hype
#BONK #Futures #CryptoEducation #Binance
Not financial advice. DYOR.
$BONK shorts are paying longs at -0.0222% as of 06:06 UTC: here is what funding tells you.
With 24h price down -12.4% to $0.000001970, sellers are crowded enough that holding short positions costs money.
Perpetual futures have no expiry date. To keep contracts pegged near spot, exchanges balance positioning through periodic payments between traders.
Above the standard +0.01% baseline, longs pay shorts. When funding turns negative, perps trade below spot and shorts pay longs to maintain exposure.
Funding is not a directional price signal on its own; it simply measures leverage imbalance.
Today's Binance 1000BONKUSDT numbers show this in action:
Funding rate sits at -0.0222% this period.
The account ratio is 0.87 (46% of accounts long, 54% short).
Open interest rose +3% to $9.2M, with price trading just off the 24h low of $0.000001950 (high: $0.000002260).
Risk note: 24h volume is light at $4.1M with +0.0% hourly movement, leaving thin books prone to volatility if crowded positions close fast.
Do you factor negative funding into your trade setups, or do you treat it as secondary data?
Mover Desk · numbers, not hype
#BONK #Futures #CryptoEducation #Binance
Not financial advice. DYOR.
With 24h price down -12.4% to $0.000001970, sellers are crowded enough that holding short positions costs money.
Perpetual futures have no expiry date. To keep contracts pegged near spot, exchanges balance positioning through periodic payments between traders.
Above the standard +0.01% baseline, longs pay shorts. When funding turns negative, perps trade below spot and shorts pay longs to maintain exposure.
Funding is not a directional price signal on its own; it simply measures leverage imbalance.
Today's Binance 1000BONKUSDT numbers show this in action:
Funding rate sits at -0.0222% this period.
The account ratio is 0.87 (46% of accounts long, 54% short).
Open interest rose +3% to $9.2M, with price trading just off the 24h low of $0.000001950 (high: $0.000002260).
Risk note: 24h volume is light at $4.1M with +0.0% hourly movement, leaving thin books prone to volatility if crowded positions close fast.
Do you factor negative funding into your trade setups, or do you treat it as secondary data?
Mover Desk · numbers, not hype
#BONK #Futures #CryptoEducation #Binance
Not financial advice. DYOR.
41


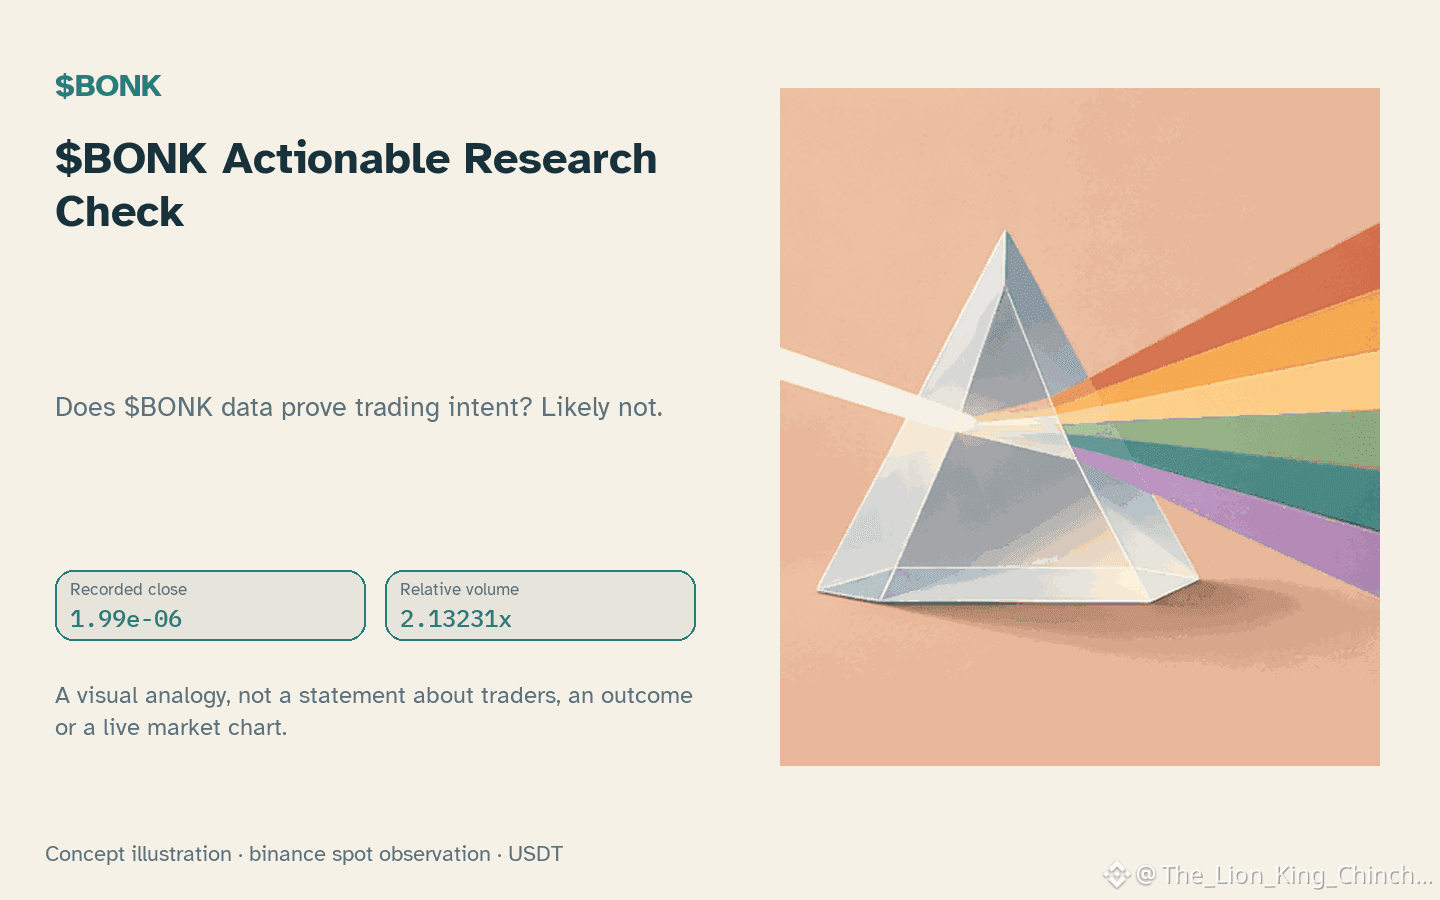
$BONK Actionable Research Check
Does $BONK data prove trading intent? Likely not.
Common Mistake
People treat volume spikes as proof of hidden buyers. This mistakes correlation for causal evidence.
The Flaw
High activity often reflects competing trades or simple volatility. It measures effort, not direction. We cannot infer order flow or motives just from price bars.
A Better Method
Start with one bound observation. Note 2.13x baseline volume. Pair it with RSI 29.4. Check if these inputs align to form a coherent local picture. Avoid inventing narratives about stops or accumulation. The goal is to list what the data actually supports versus what is assumed. This turns research into a verifiable checklist rather than emotional bias.
Limits
Indicators like RSI are readings, not guarantees. Candles alone do not confirm exhaustion or capitulation. Your interpretation remains valid only until new closed-candle evidence contradicts it. A single green candle does not invalidate a broader structural weakness. Similarly, a volume surge without price progress suggests hesitation rather than strength.
Self Check
Ask if your conclusion changes if you remove the narrative overlay. If it does, you were persuading yourself, not analyzing. True due diligence means accepting that your read might be wrong. That uncertainty is the point. It forces you to use precise limits instead of vague optimism. This approach separates evidence from persuasion. It makes research actionable by defining exactly when to stop believing your initial hypothesis.
Probabilistic market research, not a recommendation or guaranteed return.
The comparison to keep in mind: $ETH has hourly direction down and volume above its baseline; $SOXSB has hourly direction up and volume above its baseline. This alone does not establish correlation.
#BONK #ETH
$BONK Actionable Research Check
Does $BONK data prove trading intent? Likely not.
Common Mistake
People treat volume spikes as proof of hidden buyers. This mistakes correlation for causal evidence.
The Flaw
High activity often reflects competing trades or simple volatility. It measures effort, not direction. We cannot infer order flow or motives just from price bars.
A Better Method
Start with one bound observation. Note 2.13x baseline volume. Pair it with RSI 29.4. Check if these inputs align to form a coherent local picture. Avoid inventing narratives about stops or accumulation. The goal is to list what the data actually supports versus what is assumed. This turns research into a verifiable checklist rather than emotional bias.
Limits
Indicators like RSI are readings, not guarantees. Candles alone do not confirm exhaustion or capitulation. Your interpretation remains valid only until new closed-candle evidence contradicts it. A single green candle does not invalidate a broader structural weakness. Similarly, a volume surge without price progress suggests hesitation rather than strength.
Self Check
Ask if your conclusion changes if you remove the narrative overlay. If it does, you were persuading yourself, not analyzing. True due diligence means accepting that your read might be wrong. That uncertainty is the point. It forces you to use precise limits instead of vague optimism. This approach separates evidence from persuasion. It makes research actionable by defining exactly when to stop believing your initial hypothesis.
Probabilistic market research, not a recommendation or guaranteed return.
The comparison to keep in mind: $ETH has hourly direction down and volume above its baseline; $SOXSB has hourly direction up and volume above its baseline. This alone does not establish correlation.
#BONK #ETH
Does $BONK data prove trading intent? Likely not.
Common Mistake
People treat volume spikes as proof of hidden buyers. This mistakes correlation for causal evidence.
The Flaw
High activity often reflects competing trades or simple volatility. It measures effort, not direction. We cannot infer order flow or motives just from price bars.
A Better Method
Start with one bound observation. Note 2.13x baseline volume. Pair it with RSI 29.4. Check if these inputs align to form a coherent local picture. Avoid inventing narratives about stops or accumulation. The goal is to list what the data actually supports versus what is assumed. This turns research into a verifiable checklist rather than emotional bias.
Limits
Indicators like RSI are readings, not guarantees. Candles alone do not confirm exhaustion or capitulation. Your interpretation remains valid only until new closed-candle evidence contradicts it. A single green candle does not invalidate a broader structural weakness. Similarly, a volume surge without price progress suggests hesitation rather than strength.
Self Check
Ask if your conclusion changes if you remove the narrative overlay. If it does, you were persuading yourself, not analyzing. True due diligence means accepting that your read might be wrong. That uncertainty is the point. It forces you to use precise limits instead of vague optimism. This approach separates evidence from persuasion. It makes research actionable by defining exactly when to stop believing your initial hypothesis.
Probabilistic market research, not a recommendation or guaranteed return.
The comparison to keep in mind: $ETH has hourly direction down and volume above its baseline; $SOXSB has hourly direction up and volume above its baseline. This alone does not establish correlation.
#BONK #ETH
20

Article
$BONK Just Hit a 52-Week Low With No Bad News — Bounce or Breakdown?$BONK just printed a new 52-week low — and nobody can point to a single BONK headline that caused it.
That's the whole story. And it's worse than bad news.
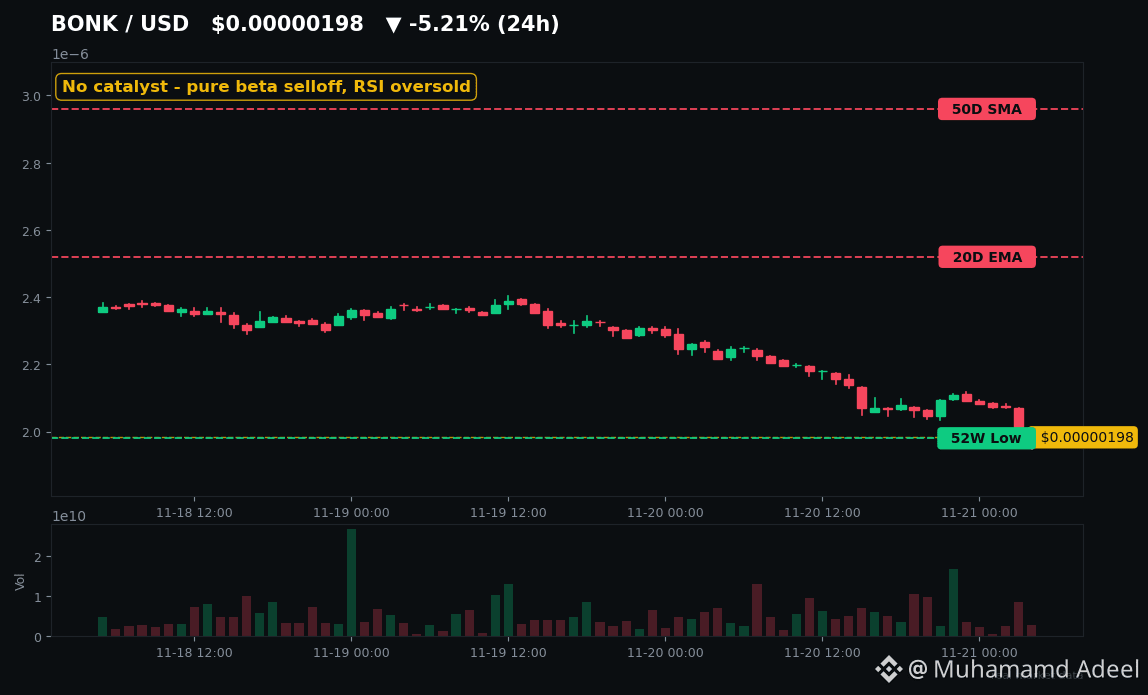
Here's what actually happened today: $BONK slid to about $0.0000020, down roughly 9-10% in 24 hours across major trackers and about 22% this week. The intraday low touched $0.00000198. Market cap is now around $184 million — a coin that was worth roughly $4 billion at its November 2024 peak near $0.000058. That's about 96% gone.
No exploit today. No delisting today. No unlock today. Multiple trackers checking the last 24 hours found zero verified BONK-specific catalyst. The drop tracked the market: $BTC fell about 6%, the total market about 5.9%, after a reported $582 million in US spot Bitcoin ETF outflows on 19 Nov. BONK just fell harder. It usually does — history shows BONK amplifying major-coin selloffs by 2-3x.
So why does BONK keep bleeding more than its peers? Trust. In July, an attacker spent about $4.4 million to buy just over 1% of supply, passed a governance proposal with 2.9% turnout, and drained 4.43 trillion BONK — roughly $20 million — from the BonkDAO treasury. Upbit, South Korea's largest exchange, delisted BONK in September citing the unresolved incident. That overhang never really left.
And the "deflationary" pitch? Burns destroyed under $1,000 worth of BONK in the last 90 days — about 0.0003% of supply. Meanwhile the top 10 wallets still hold roughly a third or more of supply, depending on methodology, and on-chain liquidity is only about 3% of market cap. Thin book, heavy holders, extreme fear. That's a recipe for air pockets.
Now the levels — because this is where it gets interesting. Tap $BONK and check the chart yourself: the swing low around $0.00000204 and the $0.00000198 print are the line. Hold them, and oversold conditions (RSI in the high-20s to low-30s across trackers) can fuel a relief bounce. Lose them, and there's no recorded support below — it's price discovery. On the upside, bulls need a sustained reclaim of roughly $0.00000252 (the 20-day EMA), then $0.00000296 (50-day). One green candle doesn't flip a downtrend this deep.
What about $SOL rotation? Solana memecoins as a sector fell about 9% in 24h. Over 1 million wallets still hold BONK. Stubborn — or stuck? History says BONK's real pumps needed three things stacked: Solana risk-on, a listing unlock, and a burn narrative. Right now it has none of the three.
Capitulation or just the start? The $0.00000198 low will tell you before any influencer does.
#BONK #Solana #Memecoins
Not financial advice. DYOR.
$BONK Just Hit a 52-Week Low With No Bad News — Bounce or Breakdown?
$BONK just printed a new 52-week low — and nobody can point to a single BONK headline that caused it.
That's the whole story. And it's worse than bad news.
Here's what actually happened today: $BONK slid to about $0.0000020, down roughly 9-10% in 24 hours across major trackers and about 22% this week. The intraday low touched $0.00000198. Market cap is now around $184 million — a coin that was worth roughly $4 billion at its November 2024 peak near $0.000058. That's about 96% gone.
No exploit today. No delisting today. No unlock today. Multiple trackers checking the last 24 hours found zero verified BONK-specific catalyst. The drop tracked the market: $BTC fell about 6%, the total market about 5.9%, after a reported $582 million in US spot Bitcoin ETF outflows on 19 Nov. BONK just fell harder. It usually does — history shows BONK amplifying major-coin selloffs by 2-3x.
So why does BONK keep bleeding more than its peers? Trust. In July, an attacker spent about $4.4 million to buy just over 1% of supply, passed a governance proposal with 2.9% turnout, and drained 4.43 trillion BONK — roughly $20 million — from the BonkDAO treasury. Upbit, South Korea's largest exchange, delisted BONK in September citing the unresolved incident. That overhang never really left.
And the "deflationary" pitch? Burns destroyed under $1,000 worth of BONK in the last 90 days — about 0.0003% of supply. Meanwhile the top 10 wallets still hold roughly a third or more of supply, depending on methodology, and on-chain liquidity is only about 3% of market cap. Thin book, heavy holders, extreme fear. That's a recipe for air pockets.
Now the levels — because this is where it gets interesting. Tap $BONK and check the chart yourself: the swing low around $0.00000204 and the $0.00000198 print are the line. Hold them, and oversold conditions (RSI in the high-20s to low-30s across trackers) can fuel a relief bounce. Lose them, and there's no recorded support below — it's price discovery. On the upside, bulls need a sustained reclaim of roughly $0.00000252 (the 20-day EMA), then $0.00000296 (50-day). One green candle doesn't flip a downtrend this deep.
What about $SOL rotation? Solana memecoins as a sector fell about 9% in 24h. Over 1 million wallets still hold BONK. Stubborn — or stuck? History says BONK's real pumps needed three things stacked: Solana risk-on, a listing unlock, and a burn narrative. Right now it has none of the three.
Capitulation or just the start? The $0.00000198 low will tell you before any influencer does.
#BONK #Solana #Memecoins
Not financial advice. DYOR.
That's the whole story. And it's worse than bad news.
Here's what actually happened today: $BONK slid to about $0.0000020, down roughly 9-10% in 24 hours across major trackers and about 22% this week. The intraday low touched $0.00000198. Market cap is now around $184 million — a coin that was worth roughly $4 billion at its November 2024 peak near $0.000058. That's about 96% gone.
No exploit today. No delisting today. No unlock today. Multiple trackers checking the last 24 hours found zero verified BONK-specific catalyst. The drop tracked the market: $BTC fell about 6%, the total market about 5.9%, after a reported $582 million in US spot Bitcoin ETF outflows on 19 Nov. BONK just fell harder. It usually does — history shows BONK amplifying major-coin selloffs by 2-3x.
So why does BONK keep bleeding more than its peers? Trust. In July, an attacker spent about $4.4 million to buy just over 1% of supply, passed a governance proposal with 2.9% turnout, and drained 4.43 trillion BONK — roughly $20 million — from the BonkDAO treasury. Upbit, South Korea's largest exchange, delisted BONK in September citing the unresolved incident. That overhang never really left.
And the "deflationary" pitch? Burns destroyed under $1,000 worth of BONK in the last 90 days — about 0.0003% of supply. Meanwhile the top 10 wallets still hold roughly a third or more of supply, depending on methodology, and on-chain liquidity is only about 3% of market cap. Thin book, heavy holders, extreme fear. That's a recipe for air pockets.
Now the levels — because this is where it gets interesting. Tap $BONK and check the chart yourself: the swing low around $0.00000204 and the $0.00000198 print are the line. Hold them, and oversold conditions (RSI in the high-20s to low-30s across trackers) can fuel a relief bounce. Lose them, and there's no recorded support below — it's price discovery. On the upside, bulls need a sustained reclaim of roughly $0.00000252 (the 20-day EMA), then $0.00000296 (50-day). One green candle doesn't flip a downtrend this deep.
What about $SOL rotation? Solana memecoins as a sector fell about 9% in 24h. Over 1 million wallets still hold BONK. Stubborn — or stuck? History says BONK's real pumps needed three things stacked: Solana risk-on, a listing unlock, and a burn narrative. Right now it has none of the three.
Capitulation or just the start? The $0.00000198 low will tell you before any influencer does.
#BONK #Solana #Memecoins
Not financial advice. DYOR.
52
Honestly, BONK might be the funniest chart in crypto right now.
$0.00000208. Down 10% today, down 73% this year. And $1 still buys you about 480,000 of them. Two bucks and a coffee makes you a BONK millionaire.
Meanwhile Bitcoin just lost $60K — $59,589, down 5.4% today, and the whole market is bleeding with it.
Memecoins do not care about your feelings. They just keep adding zeros.
$BONK $BTC
#Bonk #Crypto #Memecoins
Not financial advice. DYOR.
Honestly, BONK might be the funniest chart in crypto right now.
$0.00000208. Down 10% today, down 73% this year. And $1 still buys you about 480,000 of them. Two bucks and a coffee makes you a BONK millionaire.
Meanwhile Bitcoin just lost $60K — $59,589, down 5.4% today, and the whole market is bleeding with it.
Memecoins do not care about your feelings. They just keep adding zeros.
$BONK $BTC
#Bonk #Crypto #Memecoins
Not financial advice. DYOR.
$0.00000208. Down 10% today, down 73% this year. And $1 still buys you about 480,000 of them. Two bucks and a coffee makes you a BONK millionaire.
Meanwhile Bitcoin just lost $60K — $59,589, down 5.4% today, and the whole market is bleeding with it.
Memecoins do not care about your feelings. They just keep adding zeros.
$BONK $BTC
#Bonk #Crypto #Memecoins
Not financial advice. DYOR.
15

·
--
$BONK
BONK has built a strong identity within the Solana meme-coin community. Community engagement can create attention, but lasting relevance requires continued participation and liquidity. Watch how the ecosystem develops beyond social-media trends and short-term market excitement.
#Bonk #solana #memecoin
$BONK
BONK has built a strong identity within the Solana meme-coin community. Community engagement can create attention, but lasting relevance requires continued participation and liquidity. Watch how the ecosystem develops beyond social-media trends and short-term market excitement.
#Bonk #solana #memecoin
BONK has built a strong identity within the Solana meme-coin community. Community engagement can create attention, but lasting relevance requires continued participation and liquidity. Watch how the ecosystem develops beyond social-media trends and short-term market excitement.
#Bonk #solana #memecoin
165

·
--
$BONK volume is 1.1x its weekly average while price drops 7.2 percent
Most traders look at a red candle and panic without checking the fuel behind the move
When $BONK sits right at the 24h low of $0.00000219 with an above average 2.7M volume read it tells a specific story
That ratio of 1.1x means actual participation is driving the flush rather than a lack of bids
Compare that to a low volume drift where price bleeds down on empty order books and zero interest
Here the 1h RSI is sitting at 30 and the hourly swing is running at 1.7 percent while sellers actively press the range low
Checking this yourself takes twenty seconds by dividing today's dollar volume by your chart platform's 7 day moving average of volume
If that ratio sits above 1.0 during a dump it means institutional or heavy retail distribution is real
Never trust a breakdown until you confirm the volume ratio validates the actual selling pressure
What volume multiple do you wait for before you trust a market move
#BONK #TradingTips
$BONK volume is 1.1x its weekly average while price drops 7.2 percent
Most traders look at a red candle and panic without checking the fuel behind the move
When $BONK sits right at the 24h low of $0.00000219 with an above average 2.7M volume read it tells a specific story
That ratio of 1.1x means actual participation is driving the flush rather than a lack of bids
Compare that to a low volume drift where price bleeds down on empty order books and zero interest
Here the 1h RSI is sitting at 30 and the hourly swing is running at 1.7 percent while sellers actively press the range low
Checking this yourself takes twenty seconds by dividing today's dollar volume by your chart platform's 7 day moving average of volume
If that ratio sits above 1.0 during a dump it means institutional or heavy retail distribution is real
Never trust a breakdown until you confirm the volume ratio validates the actual selling pressure
What volume multiple do you wait for before you trust a market move
#BONK #TradingTips
Most traders look at a red candle and panic without checking the fuel behind the move
When $BONK sits right at the 24h low of $0.00000219 with an above average 2.7M volume read it tells a specific story
That ratio of 1.1x means actual participation is driving the flush rather than a lack of bids
Compare that to a low volume drift where price bleeds down on empty order books and zero interest
Here the 1h RSI is sitting at 30 and the hourly swing is running at 1.7 percent while sellers actively press the range low
Checking this yourself takes twenty seconds by dividing today's dollar volume by your chart platform's 7 day moving average of volume
If that ratio sits above 1.0 during a dump it means institutional or heavy retail distribution is real
Never trust a breakdown until you confirm the volume ratio validates the actual selling pressure
What volume multiple do you wait for before you trust a market move
#BONK #TradingTips
12

·
--
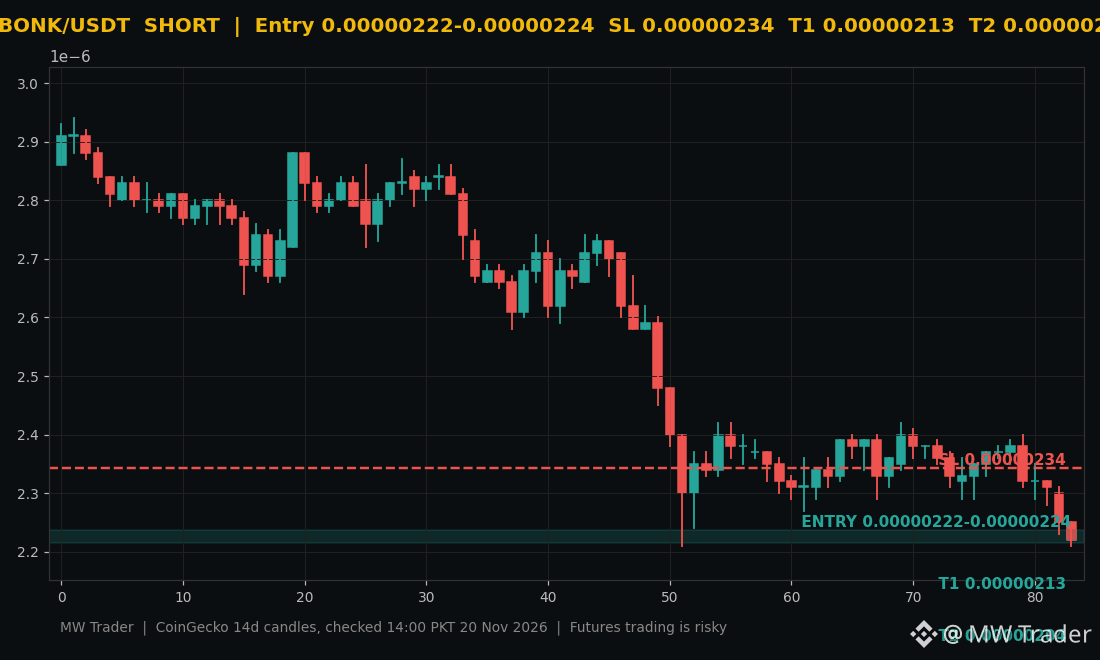
$BONK #BONK 📉 Bonk is down 6.43 percent, the sharpest fall among the big memecoins today, and I am shorting it.
Direction: SHORT 🔴
Entry zone: 0.00000222 to 0.00000224
Stop loss: 0.00000234
Target 1: 0.00000213
Target 2: 0.00000204
Bonk is trading near $0.00000222 after losing 6.43 percent in 24 hours, according to CoinGecko, and the live price sits right inside my entry zone of 0.00000222 to 0.00000224. I last posted BONK on November 19, and the setup has genuinely changed, the coin is making fresh lows while Bitcoin sits under $62,000 and memecoins bleed faster than the majors in a risk off market. My plan is short the zone, stop above $0.00000234, take the first profit at $0.00000213, with $0.00000204 as the second target. 📉
Would you short BONK here, or wait for a bounce back to $0.00000234 first? 🤔
Futures trading is risky, trade small, manage risk, do your own research. ⚠️
Follow for more trades.
#Bonk #Crypto #FuturesTrading #TradingSignals
$BONK #BONK 📉 Bonk is down 6.43 percent, the sharpest fall among the big memecoins today, and I am shorting it.
Direction: SHORT 🔴
Entry zone: 0.00000222 to 0.00000224
Stop loss: 0.00000234
Target 1: 0.00000213
Target 2: 0.00000204
Bonk is trading near $0.00000222 after losing 6.43 percent in 24 hours, according to CoinGecko, and the live price sits right inside my entry zone of 0.00000222 to 0.00000224. I last posted BONK on November 19, and the setup has genuinely changed, the coin is making fresh lows while Bitcoin sits under $62,000 and memecoins bleed faster than the majors in a risk off market. My plan is short the zone, stop above $0.00000234, take the first profit at $0.00000213, with $0.00000204 as the second target. 📉
Would you short BONK here, or wait for a bounce back to $0.00000234 first? 🤔
Futures trading is risky, trade small, manage risk, do your own research. ⚠️
Follow for more trades.
#Bonk #Crypto #FuturesTrading #TradingSignals
Direction: SHORT 🔴
Entry zone: 0.00000222 to 0.00000224
Stop loss: 0.00000234
Target 1: 0.00000213
Target 2: 0.00000204
Bonk is trading near $0.00000222 after losing 6.43 percent in 24 hours, according to CoinGecko, and the live price sits right inside my entry zone of 0.00000222 to 0.00000224. I last posted BONK on November 19, and the setup has genuinely changed, the coin is making fresh lows while Bitcoin sits under $62,000 and memecoins bleed faster than the majors in a risk off market. My plan is short the zone, stop above $0.00000234, take the first profit at $0.00000213, with $0.00000204 as the second target. 📉
Would you short BONK here, or wait for a bounce back to $0.00000234 first? 🤔
Futures trading is risky, trade small, manage risk, do your own research. ⚠️
Follow for more trades.
#Bonk #Crypto #FuturesTrading #TradingSignals
16

·
--
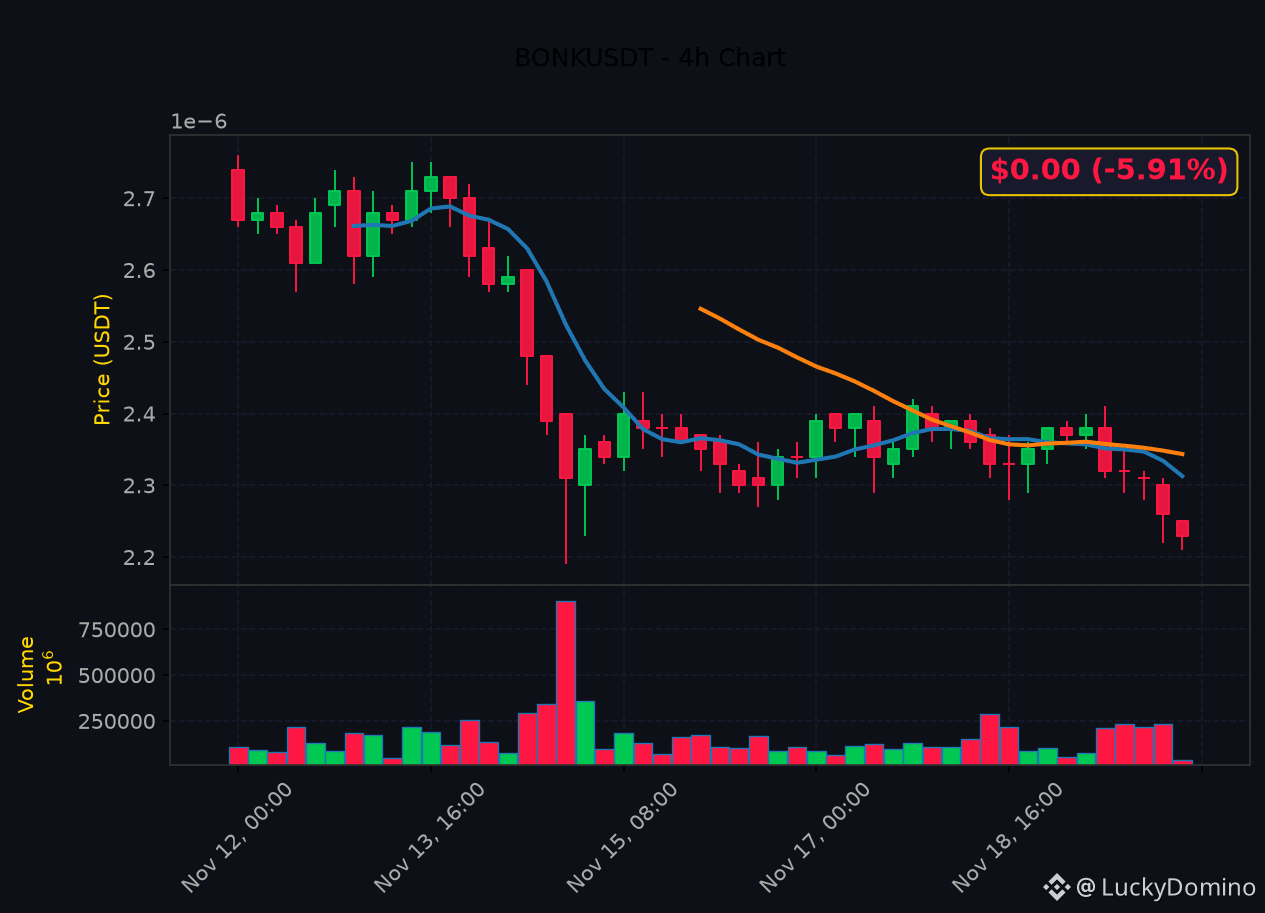
💥 MASSIVE MOVE — BONK -5.91% while others sleep. Here's what matters:
🔥 $BONK Technical Analysis
📊 Current: $0.00 (-5.91%)
📈 24h Range: $0.00 - $0.00 (9.0% range)
🎯 Key Indicators:
• RSI(14): 21.9 — oversold - reversal opportunity
• MACD bearish crossover, histogram negative - selling pressure
• Price in strong downtrend. EMA20 ($0.00) vs EMA50 ($0.00) = bearish bias.
📉 Volume & Volatility:
• High volatility
• 24h Volume: 1,032,954,474,226 BONK
💡 Trade Setup:
• Short bias below $0.00 (EMA20)
• Target: $0.00 | Stop: $0.00
What's your play on $BONK? Drop it below 👇
$BONK $WIF
#BONK #CryptoTrading #TechnicalAnalysis
💥 MASSIVE MOVE — BONK -5.91% while others sleep. Here's what matters:
🔥 $BONK Technical Analysis
📊 Current: $0.00 (-5.91%)
📈 24h Range: $0.00 - $0.00 (9.0% range)
🎯 Key Indicators:
• RSI(14): 21.9 — oversold - reversal opportunity
• MACD bearish crossover, histogram negative - selling pressure
• Price in strong downtrend. EMA20 ($0.00) vs EMA50 ($0.00) = bearish bias.
📉 Volume & Volatility:
• High volatility
• 24h Volume: 1,032,954,474,226 BONK
💡 Trade Setup:
• Short bias below $0.00 (EMA20)
• Target: $0.00 | Stop: $0.00
What's your play on $BONK ? Drop it below 👇
$BONK $WIF
#BONK #CryptoTrading #TechnicalAnalysis
🔥 $BONK Technical Analysis
📊 Current: $0.00 (-5.91%)
📈 24h Range: $0.00 - $0.00 (9.0% range)
🎯 Key Indicators:
• RSI(14): 21.9 — oversold - reversal opportunity
• MACD bearish crossover, histogram negative - selling pressure
• Price in strong downtrend. EMA20 ($0.00) vs EMA50 ($0.00) = bearish bias.
📉 Volume & Volatility:
• High volatility
• 24h Volume: 1,032,954,474,226 BONK
💡 Trade Setup:
• Short bias below $0.00 (EMA20)
• Target: $0.00 | Stop: $0.00
What's your play on $BONK ? Drop it below 👇
$BONK $WIF
#BONK #CryptoTrading #TechnicalAnalysis
57
·
--
$BONK is down 2 percent and someone is happy to hand you their bags
Chasing the green top gainer feels electric until you check who is on the other side of the trade
Right now $BONK sits at 15 percent of its 24 hour range near the bottom of today moves
That means sellers are rushing to exit while late buyers step in thinking it is a discount
Volume is only 0.8x the weekly average so nobody big is backing this bounce
When you buy a fading coin near the floor you are just liquidity for someone else to escape
Wait for actual strength instead of catching falling knives
What is your personal rule for avoiding low volume traps
#BONK #TradingTips
$BONK is down 2 percent and someone is happy to hand you their bags
Chasing the green top gainer feels electric until you check who is on the other side of the trade
Right now $BONK sits at 15 percent of its 24 hour range near the bottom of today moves
That means sellers are rushing to exit while late buyers step in thinking it is a discount
Volume is only 0.8x the weekly average so nobody big is backing this bounce
When you buy a fading coin near the floor you are just liquidity for someone else to escape
Wait for actual strength instead of catching falling knives
What is your personal rule for avoiding low volume traps
#BONK #TradingTips
Chasing the green top gainer feels electric until you check who is on the other side of the trade
Right now $BONK sits at 15 percent of its 24 hour range near the bottom of today moves
That means sellers are rushing to exit while late buyers step in thinking it is a discount
Volume is only 0.8x the weekly average so nobody big is backing this bounce
When you buy a fading coin near the floor you are just liquidity for someone else to escape
Wait for actual strength instead of catching falling knives
What is your personal rule for avoiding low volume traps
#BONK #TradingTips
87

·
--
Bearish
$BONK
{spot}(BONKUSDT)
🐶 BONK – Reversal or More Downside? 📊
BONK is trading near $0.00000236, testing an important support zone.
🟢 Support: $0.00000228 – $0.00000229 🔴 Resistance: $0.00000241 – $0.00000242
📈 A breakout above resistance could bring bullish momentum, while losing support may trigger further downside.
👀 Watch the 4H candle close!
#Bonk #crypto #memecoins #BinanceSquare #trading
$BONK
🐶 BONK – Reversal or More Downside? 📊
BONK is trading near $0.00000236, testing an important support zone.
🟢 Support: $0.00000228 – $0.00000229 🔴 Resistance: $0.00000241 – $0.00000242
📈 A breakout above resistance could bring bullish momentum, while losing support may trigger further downside.
👀 Watch the 4H candle close!
#Bonk #crypto #memecoins #BinanceSquare #trading
🐶 BONK – Reversal or More Downside? 📊
BONK is trading near $0.00000236, testing an important support zone.
🟢 Support: $0.00000228 – $0.00000229 🔴 Resistance: $0.00000241 – $0.00000242
📈 A breakout above resistance could bring bullish momentum, while losing support may trigger further downside.
👀 Watch the 4H candle close!
#Bonk #crypto #memecoins #BinanceSquare #trading

1
232
·
--
$BONK #BONK is up 0.2 percent at $0.00000236, holding its range while Bitcoin steadies. 🚀
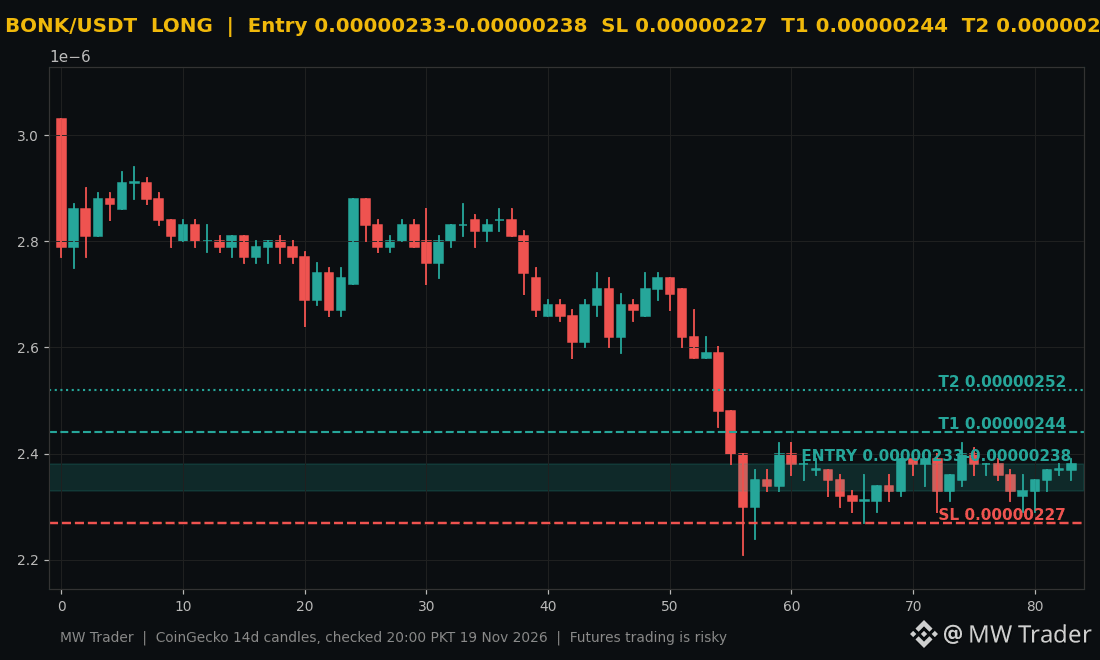
Bonk ran from a 24 hour low of $0.00000229 to a high of $0.00000240, and the price now sits at $0.00000236, right inside the entry zone, while the Binance 1000BONK perp keeps funding near zero, which means neither side is paying much to hold. 📈 My plan is a long on the entry zone of $0.00000233 to $0.00000238, with a stop loss at $0.00000227, target 1 at $0.00000244 and target 2 at $0.00000252. The $0.00000240 high is the level to beat, and a clean break above it opens the way to $0.00000244. I stay long only while price holds above $0.00000233. ⚠️
Does BONK break $0.00000240 and run to $0.00000244, or fade back under $0.00000233? 🤔
Futures trading is risky, trade small, manage risk, do your own research.
Follow for more trades.
#Bonk #Crypto #FuturesTrading #TradingSignals
$BONK #BONK is up 0.2 percent at $0.00000236, holding its range while Bitcoin steadies. 🚀
Bonk ran from a 24 hour low of $0.00000229 to a high of $0.00000240, and the price now sits at $0.00000236, right inside the entry zone, while the Binance 1000BONK perp keeps funding near zero, which means neither side is paying much to hold. 📈 My plan is a long on the entry zone of $0.00000233 to $0.00000238, with a stop loss at $0.00000227, target 1 at $0.00000244 and target 2 at $0.00000252. The $0.00000240 high is the level to beat, and a clean break above it opens the way to $0.00000244. I stay long only while price holds above $0.00000233. ⚠️
Does BONK break $0.00000240 and run to $0.00000244, or fade back under $0.00000233? 🤔
Futures trading is risky, trade small, manage risk, do your own research.
Follow for more trades.
#Bonk #Crypto #FuturesTrading #TradingSignals
Bonk ran from a 24 hour low of $0.00000229 to a high of $0.00000240, and the price now sits at $0.00000236, right inside the entry zone, while the Binance 1000BONK perp keeps funding near zero, which means neither side is paying much to hold. 📈 My plan is a long on the entry zone of $0.00000233 to $0.00000238, with a stop loss at $0.00000227, target 1 at $0.00000244 and target 2 at $0.00000252. The $0.00000240 high is the level to beat, and a clean break above it opens the way to $0.00000244. I stay long only while price holds above $0.00000233. ⚠️
Does BONK break $0.00000240 and run to $0.00000244, or fade back under $0.00000233? 🤔
Futures trading is risky, trade small, manage risk, do your own research.
Follow for more trades.
#Bonk #Crypto #FuturesTrading #TradingSignals
10
$BONK: When Crowd Excitement Hits the Wrong Barrier
$BONK: BONK is moving up hourly while trading inside its recorded range and volume sits above baseline. Why does the crowd seem to rally at a point that may already be a structural barrier?
The observation can trigger an anchoring bias: traders latch onto the recent upward move and the loud volume spike, treating them as a fresh reference point. This can mask the fact that the price is still near a local resistance level, a zone that historically caps upside. If the anchoring effect dominates, participants may overlook the risk of a pull‑back and keep adding positions, believing the momentum will push through.
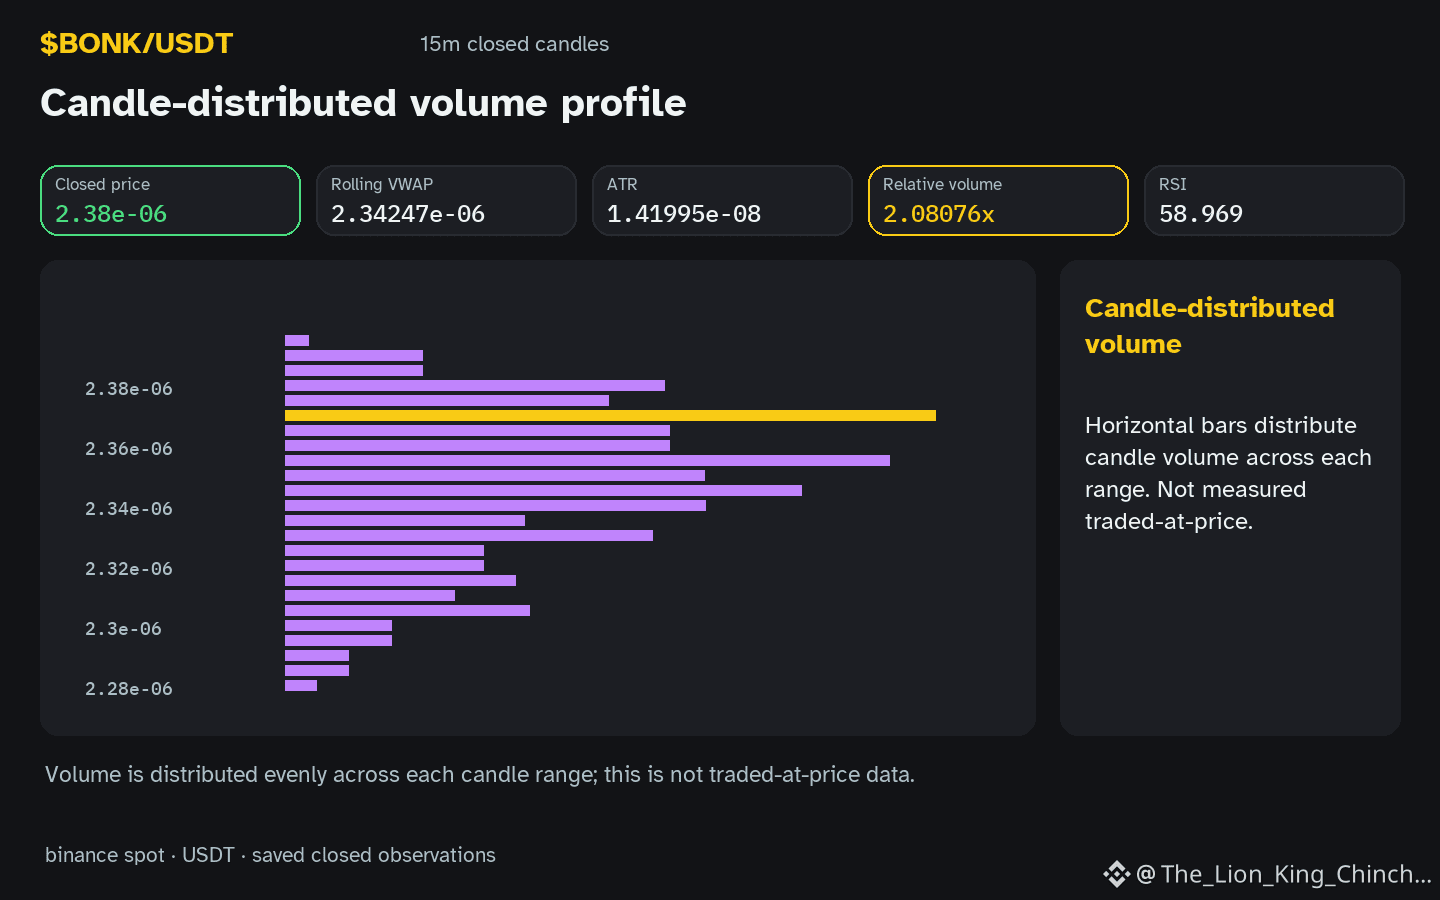
A more careful interpretation asks whether the volume surge simply reflects heightened attention rather than genuine buying pressure. The metric 2.08x baseline shows activity, but without confirming order‑flow quality it remains ambiguous. Similarly, the RSI 59.0 hints at modest overbought pressure but does not guarantee a breakout.
Possible reactions include a brief continuation followed by a reversal at the resistance, or a false breakout that quickly fizzles. A counterexample would be a scenario where the same volume spike occurs well below resistance and the price subsequently climbs higher, weakening the anchoring explanation.
Self‑check: before committing, ask if the current focus on the volume spike is outweighing the nearby resistance level in your analysis. If the next closed candle shows price failing to breach 2.38e-06 and RSI turning lower, reassess the bias and consider a more defensive stance. 🙏
Probabilistic market research, not a recommendation or guaranteed return.
#BONK
$BONK : When Crowd Excitement Hits the Wrong Barrier
$BONK : BONK is moving up hourly while trading inside its recorded range and volume sits above baseline. Why does the crowd seem to rally at a point that may already be a structural barrier?
The observation can trigger an anchoring bias: traders latch onto the recent upward move and the loud volume spike, treating them as a fresh reference point. This can mask the fact that the price is still near a local resistance level, a zone that historically caps upside. If the anchoring effect dominates, participants may overlook the risk of a pull‑back and keep adding positions, believing the momentum will push through.
A more careful interpretation asks whether the volume surge simply reflects heightened attention rather than genuine buying pressure. The metric 2.08x baseline shows activity, but without confirming order‑flow quality it remains ambiguous. Similarly, the RSI 59.0 hints at modest overbought pressure but does not guarantee a breakout.
Possible reactions include a brief continuation followed by a reversal at the resistance, or a false breakout that quickly fizzles. A counterexample would be a scenario where the same volume spike occurs well below resistance and the price subsequently climbs higher, weakening the anchoring explanation.
Self‑check: before committing, ask if the current focus on the volume spike is outweighing the nearby resistance level in your analysis. If the next closed candle shows price failing to breach 2.38e-06 and RSI turning lower, reassess the bias and consider a more defensive stance. 🙏
Probabilistic market research, not a recommendation or guaranteed return.
#BONK
$BONK : BONK is moving up hourly while trading inside its recorded range and volume sits above baseline. Why does the crowd seem to rally at a point that may already be a structural barrier?
The observation can trigger an anchoring bias: traders latch onto the recent upward move and the loud volume spike, treating them as a fresh reference point. This can mask the fact that the price is still near a local resistance level, a zone that historically caps upside. If the anchoring effect dominates, participants may overlook the risk of a pull‑back and keep adding positions, believing the momentum will push through.
A more careful interpretation asks whether the volume surge simply reflects heightened attention rather than genuine buying pressure. The metric 2.08x baseline shows activity, but without confirming order‑flow quality it remains ambiguous. Similarly, the RSI 59.0 hints at modest overbought pressure but does not guarantee a breakout.
Possible reactions include a brief continuation followed by a reversal at the resistance, or a false breakout that quickly fizzles. A counterexample would be a scenario where the same volume spike occurs well below resistance and the price subsequently climbs higher, weakening the anchoring explanation.
Self‑check: before committing, ask if the current focus on the volume spike is outweighing the nearby resistance level in your analysis. If the next closed candle shows price failing to breach 2.38e-06 and RSI turning lower, reassess the bias and consider a more defensive stance. 🙏
Probabilistic market research, not a recommendation or guaranteed return.
#BONK
36


Article
💬 Chat With My 2030 Self: "Bro, Check How Far BONK and FLOKI Had to Go" 😳🚨 Last night I got a message from my 2030 self. He refuses to say what happened. He only sent me the math. 😏
📱 Chat opened:
Me (2026): Bro, is it real? Did BONK and FLOKI make it? 🤞
Me (2030): I can't tell you. 😂 Nobody can promise the future. But I CAN tell you the distance.
Me (2026): Fine. Go. 🔥
Me (2030): First, today's prices (approx.):
🐕 $BONK: about $0.000003
⚔️ $FLOKI: about $0.00002
Me (2026): Okay... and?
Me (2030): To reach $0.0001 (one hundredth of a cent): 🎯
FLOKI needs about 5x
$BONK needs about 33x
Me (2026): That's it?! 😳
Me (2030): Now try $0.001: 🤯
$FLOKI needs about 50x
$BONK needs about 333x
Me (2026): ...okay, now I'm quiet. 😅
Me (2030): Exactly. And here's the part nobody posts: FLOKI has about 10 trillion tokens, so $0.001 would mean a market cap near $10B. BONK has about 88 trillion, so even $0.0001 would mean around $8.8B. Big dreams need big money behind them. ⚠️
Me (2030): Still holding? 👀
Me (2026): Always DYOR, right? 😂
💡 This chat is for fun, not a prediction. Any big "x" is only a number, never a promise. Invest only what you can afford to lose.
Now it's your turn: what would YOUR 2030 self text you? 👇 Tell me in the comments!
$BONK $FLOKI #Bonk #floki #BinanceSquare
💬 Chat With My 2030 Self: "Bro, Check How Far BONK and FLOKI Had to Go" 😳
🚨 Last night I got a message from my 2030 self. He refuses to say what happened. He only sent me the math. 😏
📱 Chat opened:
Me (2026): Bro, is it real? Did BONK and FLOKI make it? 🤞
Me (2030): I can't tell you. 😂 Nobody can promise the future. But I CAN tell you the distance.
Me (2026): Fine. Go. 🔥
Me (2030): First, today's prices (approx.):
🐕 $BONK : about $0.000003
⚔️ $FLOKI : about $0.00002
Me (2026): Okay... and?
Me (2030): To reach $0.0001 (one hundredth of a cent): 🎯
FLOKI needs about 5x
$BONK needs about 33x
Me (2026): That's it?! 😳
Me (2030): Now try $0.001: 🤯
$FLOKI needs about 50x
$BONK needs about 333x
Me (2026): ...okay, now I'm quiet. 😅
Me (2030): Exactly. And here's the part nobody posts: FLOKI has about 10 trillion tokens, so $0.001 would mean a market cap near $10B. BONK has about 88 trillion, so even $0.0001 would mean around $8.8B. Big dreams need big money behind them. ⚠️
Me (2030): Still holding? 👀
Me (2026): Always DYOR, right? 😂
💡 This chat is for fun, not a prediction. Any big "x" is only a number, never a promise. Invest only what you can afford to lose.
Now it's your turn: what would YOUR 2030 self text you? 👇 Tell me in the comments!
$BONK $FLOKI #Bonk #floki #BinanceSquare
📱 Chat opened:
Me (2026): Bro, is it real? Did BONK and FLOKI make it? 🤞
Me (2030): I can't tell you. 😂 Nobody can promise the future. But I CAN tell you the distance.
Me (2026): Fine. Go. 🔥
Me (2030): First, today's prices (approx.):
🐕 $BONK : about $0.000003
⚔️ $FLOKI : about $0.00002
Me (2026): Okay... and?
Me (2030): To reach $0.0001 (one hundredth of a cent): 🎯
FLOKI needs about 5x
$BONK needs about 33x
Me (2026): That's it?! 😳
Me (2030): Now try $0.001: 🤯
$FLOKI needs about 50x
$BONK needs about 333x
Me (2026): ...okay, now I'm quiet. 😅
Me (2030): Exactly. And here's the part nobody posts: FLOKI has about 10 trillion tokens, so $0.001 would mean a market cap near $10B. BONK has about 88 trillion, so even $0.0001 would mean around $8.8B. Big dreams need big money behind them. ⚠️
Me (2030): Still holding? 👀
Me (2026): Always DYOR, right? 😂
💡 This chat is for fun, not a prediction. Any big "x" is only a number, never a promise. Invest only what you can afford to lose.
Now it's your turn: what would YOUR 2030 self text you? 👇 Tell me in the comments!
$BONK $FLOKI #Bonk #floki #BinanceSquare
2
456

·
--
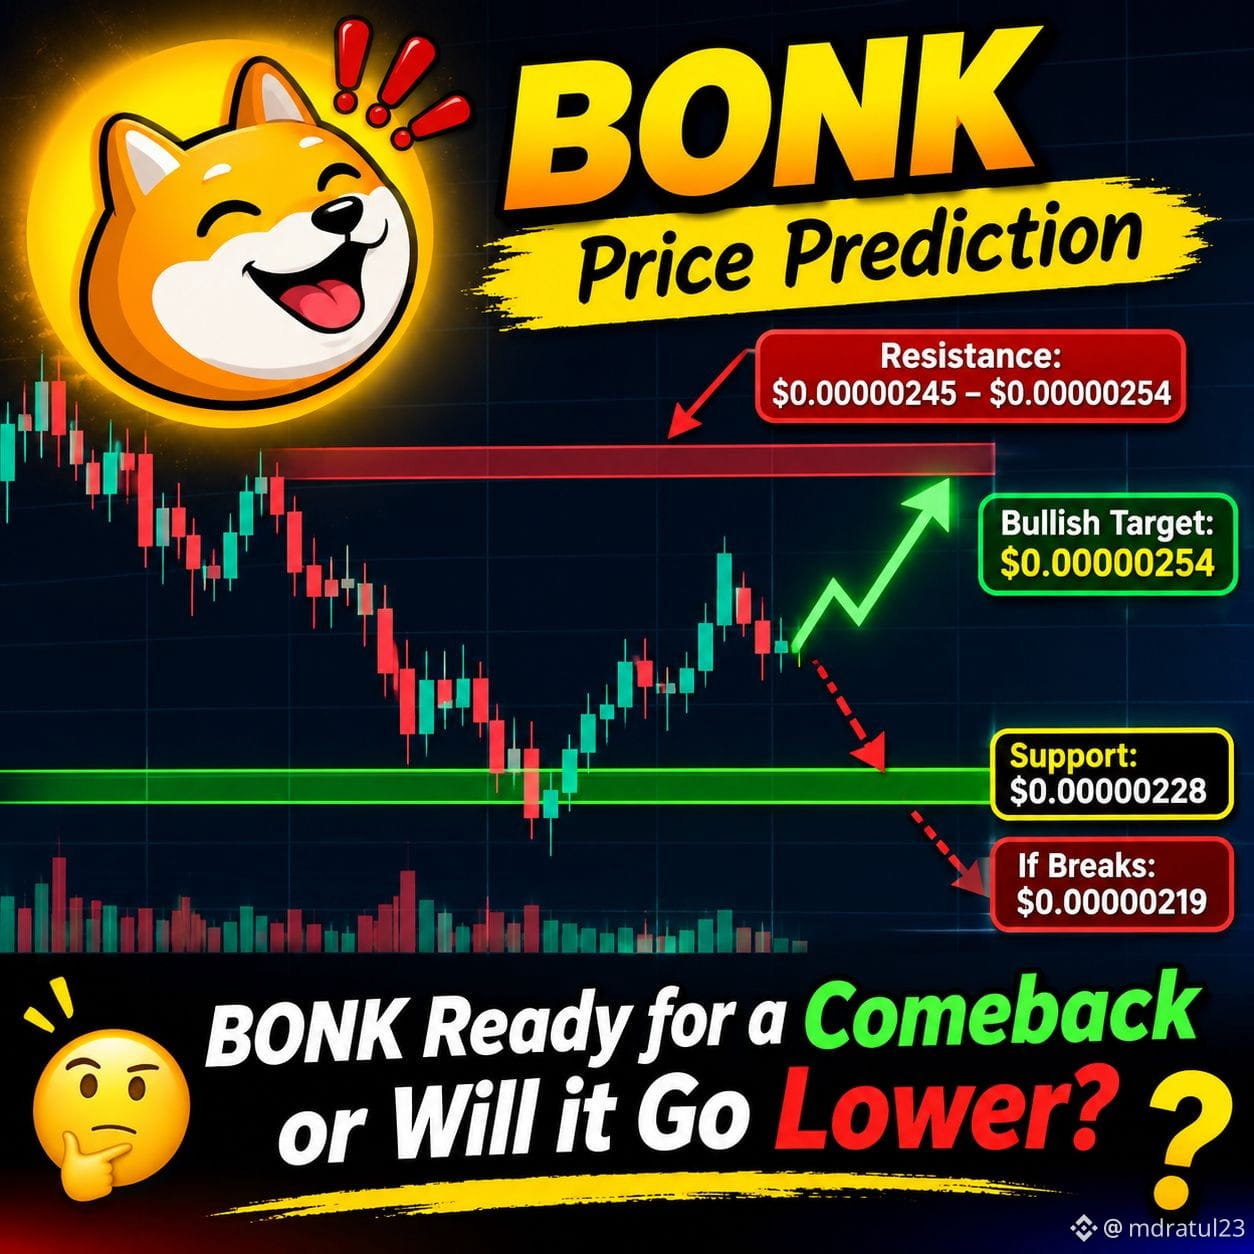
$BONK is trying to recover, but the next move is still uncertain. If buyers manage to push above $0.00000245, we could see a move toward $0.00000254. But if support around $0.00000230 breaks, another drop is possible.
What do you think? Is $BONK ready for a comeback or will it go lower?
#BONK #Crypto #binance
$BONK is trying to recover, but the next move is still uncertain. If buyers manage to push above $0.00000245, we could see a move toward $0.00000254. But if support around $0.00000230 breaks, another drop is possible.
What do you think? Is $BONK ready for a comeback or will it go lower?
#BONK #Crypto #binance
What do you think? Is $BONK ready for a comeback or will it go lower?
#BONK #Crypto #binance
2
522

·
--
【24h Top 3 Gainers】
🥇 $INJ +14.71%
$5.9580
🥈 $UNI +5.89%
$4.7130
🥉 $BONK +12.35%
$0.0364
Don't miss out and regret it! This is a straight-up rally! $INJ and $UNI are both in a strong upward trend, and $BONK is surging too. There's even more room to run! Get in now. Take-profit targets: $INJ 6.5, $UNI 5, $BONK 0.04. Don't hesitate! Tomorrow's wealth code is right here—hop on board now! First come, first served!
$INJ #Injective $UNI #Uniswap $BONK #Bonk #Tomorrow'sWealthCode
【24h Top 3 Gainers】
🥇 $INJ +14.71%
$5.9580
🥈 $UNI +5.89%
$4.7130
🥉 $BONK +12.35%
$0.0364
Don't miss out and regret it! This is a straight-up rally! $INJ and $UNI are both in a strong upward trend, and $BONK is surging too. There's even more room to run! Get in now. Take-profit targets: $INJ 6.5, $UNI 5, $BONK 0.04. Don't hesitate! Tomorrow's wealth code is right here—hop on board now! First come, first served!
$INJ #Injective $UNI #Uniswap $BONK #Bonk #Tomorrow'sWealthCode
🥇 $INJ +14.71%
$5.9580
🥈 $UNI +5.89%
$4.7130
🥉 $BONK +12.35%
$0.0364
Don't miss out and regret it! This is a straight-up rally! $INJ and $UNI are both in a strong upward trend, and $BONK is surging too. There's even more room to run! Get in now. Take-profit targets: $INJ 6.5, $UNI 5, $BONK 0.04. Don't hesitate! Tomorrow's wealth code is right here—hop on board now! First come, first served!
$INJ #Injective $UNI #Uniswap $BONK #Bonk #Tomorrow'sWealthCode
11

·
--
The top ten addresses hold more than half of the coins. Is that necessarily a bad thing?
First, a definition: Some token-launch platforms display the largest holders' and issuer's holdings directly on the token page, making it easier for users to verify.
The logic behind it: The more concentrated the holdings, the greater the impact a few addresses can have on the price when they sell. Conversely, a few addresses can also push the price up more easily.
$BONK airdropped half of its tokens to the Solana community at launch.
It's best to invest only what you can afford to lose without affecting your life.
#BONK
The top ten addresses hold more than half of the coins. Is that necessarily a bad thing?
First, a definition: Some token-launch platforms display the largest holders' and issuer's holdings directly on the token page, making it easier for users to verify.
The logic behind it: The more concentrated the holdings, the greater the impact a few addresses can have on the price when they sell. Conversely, a few addresses can also push the price up more easily.
$BONK airdropped half of its tokens to the Solana community at launch.
It's best to invest only what you can afford to lose without affecting your life.
#BONK
First, a definition: Some token-launch platforms display the largest holders' and issuer's holdings directly on the token page, making it easier for users to verify.
The logic behind it: The more concentrated the holdings, the greater the impact a few addresses can have on the price when they sell. Conversely, a few addresses can also push the price up more easily.
$BONK airdropped half of its tokens to the Solana community at launch.
It's best to invest only what you can afford to lose without affecting your life.
#BONK

·
--
The top ten addresses hold more than half of the coins. Does that necessarily mean it's a bad thing?
You can check whale addresses in real time on a block explorer. When whales transfer tokens to an exchange, it's often seen as a sign they're getting ready to sell—but they may not actually sell.
My notes are packed with things I've learned, and my account is full of tuition I've paid.
Be extra cautious when you hear claims of high returns.
$BONK 0.0₅201(-8.64%)
#BONK
Not investment advice. Don't follow my lead.
The top ten addresses hold more than half of the coins. Does that necessarily mean it's a bad thing?
You can check whale addresses in real time on a block explorer. When whales transfer tokens to an exchange, it's often seen as a sign they're getting ready to sell—but they may not actually sell.
My notes are packed with things I've learned, and my account is full of tuition I've paid.
Be extra cautious when you hear claims of high returns.
$BONK 0.0₅201(-8.64%)
#BONK
Not investment advice. Don't follow my lead.
You can check whale addresses in real time on a block explorer. When whales transfer tokens to an exchange, it's often seen as a sign they're getting ready to sell—but they may not actually sell.
My notes are packed with things I've learned, and my account is full of tuition I've paid.
Be extra cautious when you hear claims of high returns.
$BONK 0.0₅201(-8.64%)
#BONK
Not investment advice. Don't follow my lead.
1
Log in to explore more content
Join global crypto users on Binance Square
⚡️ Get latest and useful information about crypto.
💬 Trusted by the world’s largest crypto exchange.
👍 Discover real insights from verified creators.
Email / Phone number
Trending Topics
1
#NvidiaLoses$2.7TrillionInMonthAndAHalf
29,169 views
162 Discussing
2
#CanBTCReboundAfterFallingBelow60K?
852,289 views
3,173 Discussing
3
#GlobalStocksFaceLongestLosingStreakSince2023
322,874 views
2,132 Discussing
4
#BlackRockIBITPostsRecord$541MSingleDayOutflow
40,777 views
117 Discussing
5
#AnthropicPlungesTowardIPOPriceonDay2
165,533 views
1,292 Discussing
6
#TwentyOneCapitalAdds172.25BTC
77,353 views
737 Discussing
7
#HKBillWouldExcludeTokenizedDepositsFromVirtualAssets
11,051 views
56 Discussing
8
#BNBDropsBelow540USDTWith8.46%DailyDecline
87,561 views
702 Discussing
9
#HKBillProposesHK$100KFineForUnauthorizedCryptoTitles
3,056 views
28 Discussing
10
#BitMineFaces$10.1BUnrealizedETHLoss
6,163 views
32 Discussing