
#blockzenith
blockzenith
124 views
4 Discussing
Hot
Latest

·
--
🚀 Welcome to Block Zenith!
The crypto world never sleeps, and neither does innovation. ₿
Here at Block Zenith, we’ll explore: 📊 Crypto Market Insights ₿ Bitcoin & Altcoin Updates 📈 Trading Knowledge & Market Trends 🧠 Blockchain Education
Our mission is simple: Learn the market. Understand the trends. Think beyond the noise.
No hype. No blind decisions. Just knowledge, research, and smarter thinking.
💬 What are you most interested in right now — Bitcoin, Altcoins, or Crypto Market Analysis?
Follow Block Zenith and let's grow together! 🌐
#BlockZenith #Crypto
🚀 Welcome to Block Zenith!
The crypto world never sleeps, and neither does innovation. ₿
Here at Block Zenith, we’ll explore: 📊 Crypto Market Insights ₿ Bitcoin & Altcoin Updates 📈 Trading Knowledge & Market Trends 🧠 Blockchain Education
Our mission is simple: Learn the market. Understand the trends. Think beyond the noise.
No hype. No blind decisions. Just knowledge, research, and smarter thinking.
💬 What are you most interested in right now — Bitcoin, Altcoins, or Crypto Market Analysis?
Follow Block Zenith and let's grow together! 🌐
#BlockZenith #Crypto
The crypto world never sleeps, and neither does innovation. ₿
Here at Block Zenith, we’ll explore: 📊 Crypto Market Insights ₿ Bitcoin & Altcoin Updates 📈 Trading Knowledge & Market Trends 🧠 Blockchain Education
Our mission is simple: Learn the market. Understand the trends. Think beyond the noise.
No hype. No blind decisions. Just knowledge, research, and smarter thinking.
💬 What are you most interested in right now — Bitcoin, Altcoins, or Crypto Market Analysis?
Follow Block Zenith and let's grow together! 🌐
#BlockZenith #Crypto

73
·
--
📊 ETHEREUM MARKET ANALYSIS: Bullish Trend or Market Consolidation?
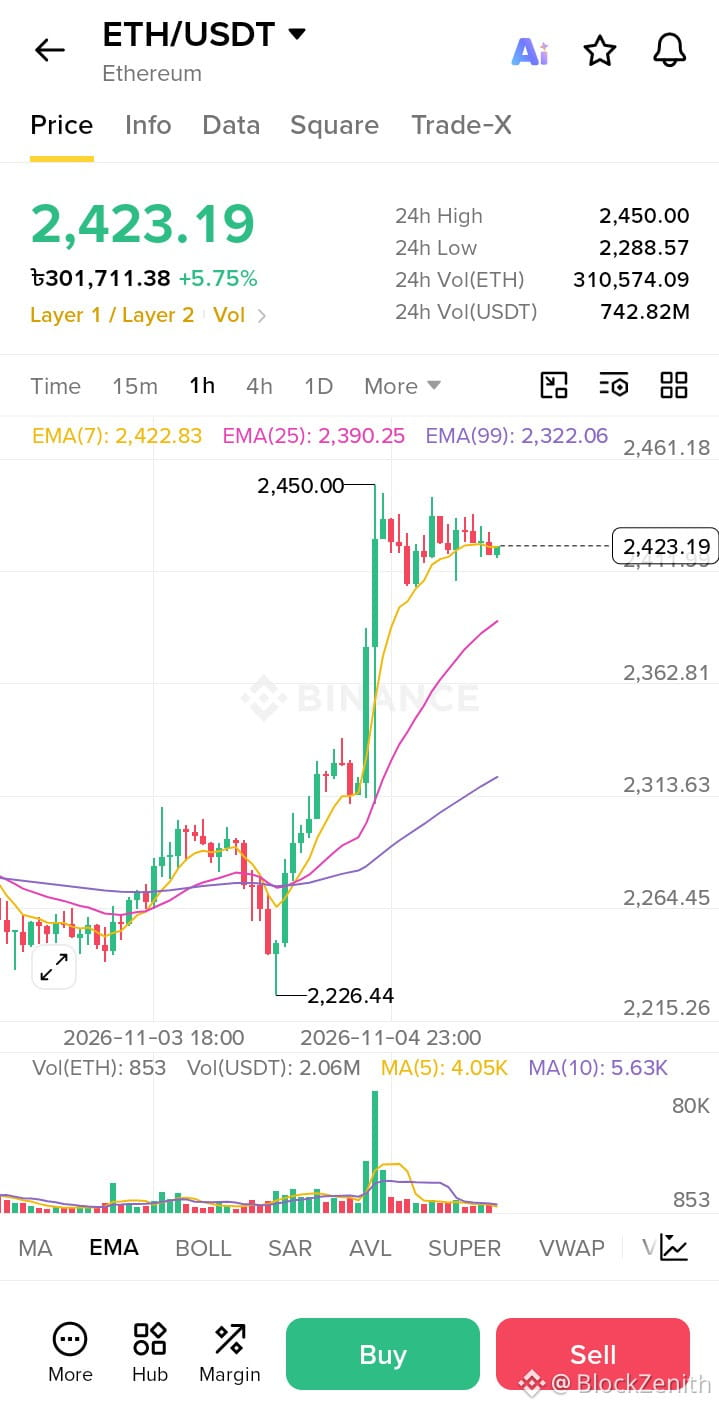
Ethereum is showing a stronger bullish structure on the 1-hour chart.
Current Market Data:
ETH Price: 2,423.19 USDT
24H Change: +5.75%
24H High: 2,450.00 USDT
EMA 7: 2,422.83
EMA 25: 2,390.25
EMA 99: 2,322.06
What Does the 1H Chart Tell Us?
🔹 EMA 7 is above EMA 25 and EMA 99, showing a bullish structure.
🔹 Price is currently trading above all three EMAs.
🔹 ETH recently moved sharply upward before entering a consolidation phase near 2,450 USDT.
🔹 Trading volume increased during the major upward move and later cooled down.
Key Takeaway:
The 1-hour chart shows a bullish structure, but consolidation near recent highs means the next market direction is not confirmed.
Remember: Indicators describe past price behavior; they cannot guarantee future movements.
💬 What do you find more interesting: EMA alignment or volume behavior?
Follow Block Zenith for educational crypto market insights.
#Ethereum #ETH #CryptoAnalysis #BlockZenith
$ETH
📊 ETHEREUM MARKET ANALYSIS: Bullish Trend or Market Consolidation?
Ethereum is showing a stronger bullish structure on the 1-hour chart.
Current Market Data:
ETH Price: 2,423.19 USDT
24H Change: +5.75%
24H High: 2,450.00 USDT
EMA 7: 2,422.83
EMA 25: 2,390.25
EMA 99: 2,322.06
What Does the 1H Chart Tell Us?
🔹 EMA 7 is above EMA 25 and EMA 99, showing a bullish structure.
🔹 Price is currently trading above all three EMAs.
🔹 ETH recently moved sharply upward before entering a consolidation phase near 2,450 USDT.
🔹 Trading volume increased during the major upward move and later cooled down.
Key Takeaway:
The 1-hour chart shows a bullish structure, but consolidation near recent highs means the next market direction is not confirmed.
Remember: Indicators describe past price behavior; they cannot guarantee future movements.
💬 What do you find more interesting: EMA alignment or volume behavior?
Follow Block Zenith for educational crypto market insights.
#Ethereum #ETH #CryptoAnalysis #BlockZenith
$ETH
Ethereum is showing a stronger bullish structure on the 1-hour chart.
Current Market Data:
ETH Price: 2,423.19 USDT
24H Change: +5.75%
24H High: 2,450.00 USDT
EMA 7: 2,422.83
EMA 25: 2,390.25
EMA 99: 2,322.06
What Does the 1H Chart Tell Us?
🔹 EMA 7 is above EMA 25 and EMA 99, showing a bullish structure.
🔹 Price is currently trading above all three EMAs.
🔹 ETH recently moved sharply upward before entering a consolidation phase near 2,450 USDT.
🔹 Trading volume increased during the major upward move and later cooled down.
Key Takeaway:
The 1-hour chart shows a bullish structure, but consolidation near recent highs means the next market direction is not confirmed.
Remember: Indicators describe past price behavior; they cannot guarantee future movements.
💬 What do you find more interesting: EMA alignment or volume behavior?
Follow Block Zenith for educational crypto market insights.
#Ethereum #ETH #CryptoAnalysis #BlockZenith
$ETH
72
·
--
🚨 TRUMP COIN: WHAT DOES THIS CHART REALLY TELL US?
Forget the usual price predictions. Let's read the story behind the candles. 👀
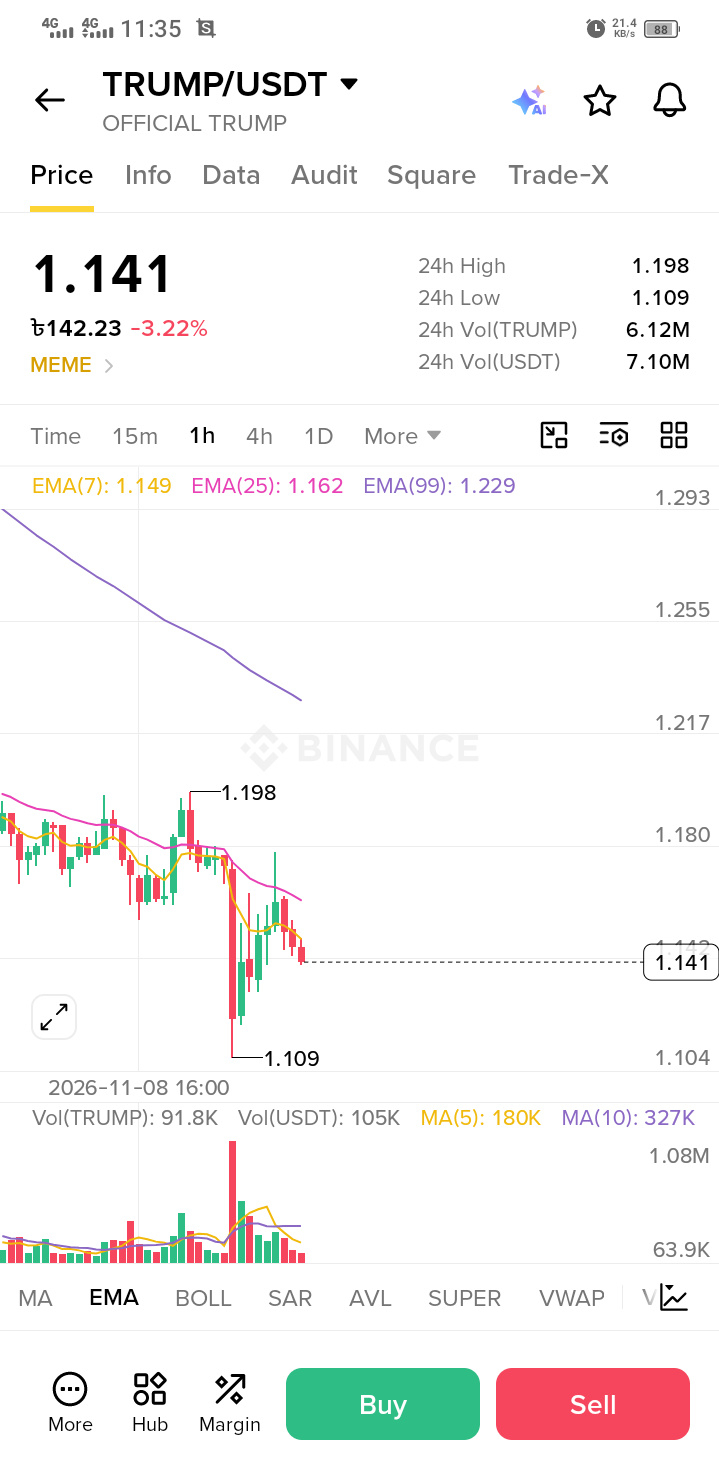
Look closely at the TRUMP/USDT 1H chart.
📉 THE CLUES:
🔴 Price: $1.141
🔻 24H Change: -3.22%
📍 24H High: $1.198
📍 24H Low: $1.109
But here's what makes this chart interesting:
1️⃣ A noticeable volume spike appeared during the sharp downward move.
2️⃣ Price attempted a recovery after reaching $1.109.
3️⃣ The recovery struggled to move above the EMA 25.
4️⃣ EMA 7 ($1.149), EMA 25 ($1.162), and EMA 99 ($1.229) are all above the current price.
🧠 THE BIG QUESTION
A sudden volume spike during a price decline can have different explanations.
It may reflect increased selling activity, liquidations, or other market activity. Volume alone cannot tell us exactly what happened.
🎯 COMMUNITY QUIZ
Which observation do you find most important?
A) The sudden volume spike
B) The failed recovery
C) Price staying below all three EMAs
D) The overall downward structure
👇 Drop your answer (A, B, C, or D) and explain WHY!
Let's learn to read charts instead of blindly following predictions.
— BLOCK ZENITH
#TRUMP #CryptoEducation #ChartAnalysis #MemeCoins #BlockZenith
$BTC $TRUMP
🚨 TRUMP COIN: WHAT DOES THIS CHART REALLY TELL US?
Forget the usual price predictions. Let's read the story behind the candles. 👀
Look closely at the TRUMP/USDT 1H chart.
📉 THE CLUES:
🔴 Price: $1.141
🔻 24H Change: -3.22%
📍 24H High: $1.198
📍 24H Low: $1.109
But here's what makes this chart interesting:
1️⃣ A noticeable volume spike appeared during the sharp downward move.
2️⃣ Price attempted a recovery after reaching $1.109.
3️⃣ The recovery struggled to move above the EMA 25.
4️⃣ EMA 7 ($1.149), EMA 25 ($1.162), and EMA 99 ($1.229) are all above the current price.
🧠 THE BIG QUESTION
A sudden volume spike during a price decline can have different explanations.
It may reflect increased selling activity, liquidations, or other market activity. Volume alone cannot tell us exactly what happened.
🎯 COMMUNITY QUIZ
Which observation do you find most important?
A) The sudden volume spike
B) The failed recovery
C) Price staying below all three EMAs
D) The overall downward structure
👇 Drop your answer (A, B, C, or D) and explain WHY!
Let's learn to read charts instead of blindly following predictions.
— BLOCK ZENITH
#TRUMP #CryptoEducation #ChartAnalysis #MemeCoins #BlockZenith
$BTC $TRUMP
Forget the usual price predictions. Let's read the story behind the candles. 👀
Look closely at the TRUMP/USDT 1H chart.
📉 THE CLUES:
🔴 Price: $1.141
🔻 24H Change: -3.22%
📍 24H High: $1.198
📍 24H Low: $1.109
But here's what makes this chart interesting:
1️⃣ A noticeable volume spike appeared during the sharp downward move.
2️⃣ Price attempted a recovery after reaching $1.109.
3️⃣ The recovery struggled to move above the EMA 25.
4️⃣ EMA 7 ($1.149), EMA 25 ($1.162), and EMA 99 ($1.229) are all above the current price.
🧠 THE BIG QUESTION
A sudden volume spike during a price decline can have different explanations.
It may reflect increased selling activity, liquidations, or other market activity. Volume alone cannot tell us exactly what happened.
🎯 COMMUNITY QUIZ
Which observation do you find most important?
A) The sudden volume spike
B) The failed recovery
C) Price staying below all three EMAs
D) The overall downward structure
👇 Drop your answer (A, B, C, or D) and explain WHY!
Let's learn to read charts instead of blindly following predictions.
— BLOCK ZENITH
#TRUMP #CryptoEducation #ChartAnalysis #MemeCoins #BlockZenith
$BTC $TRUMP
239
Log in to explore more content
Join global crypto users on Binance Square
⚡️ Get latest and useful information about crypto.
💬 Trusted by the world’s largest crypto exchange.
👍 Discover real insights from verified creators.
Email / Phone number
Trending Topics
1
#XRPDropsToTwoYearLowNear87Cents
1,129 views
74 Discussing
2
#BitcoinFallsBelow$57KToTwoYearLow
567 views
17 Discussing
3
#NvidiaLoses$2.7TrillionInMonthAndAHalf
531 views
30 Discussing
4
#CanBTCReboundAfterFallingBelow60K?
507,124 views
2,222 Discussing
5
#GlobalStocksFaceLongestLosingStreakSince2023
177,452 views
1,546 Discussing
6
#BlackRockIBITPostsRecord$541MSingleDayOutflow
9,618 views
50 Discussing
7
#AnthropicPlungesTowardIPOPriceonDay2
85,238 views
885 Discussing
8
#TwentyOneCapitalAdds172.25BTC
36,020 views
408 Discussing
9
#HKBillWouldExcludeTokenizedDepositsFromVirtualAssets
3,176 views
41 Discussing
10
#BNBDropsBelow540USDTWith8.46%DailyDecline
49,602 views
455 Discussing