
#chartanalysis
chartanalysis
1M views
3,254 Discussing
Hot
Latest

The bearish signal is supported by price trading below both moving averages, with the faster average positioned beneath the slower one.
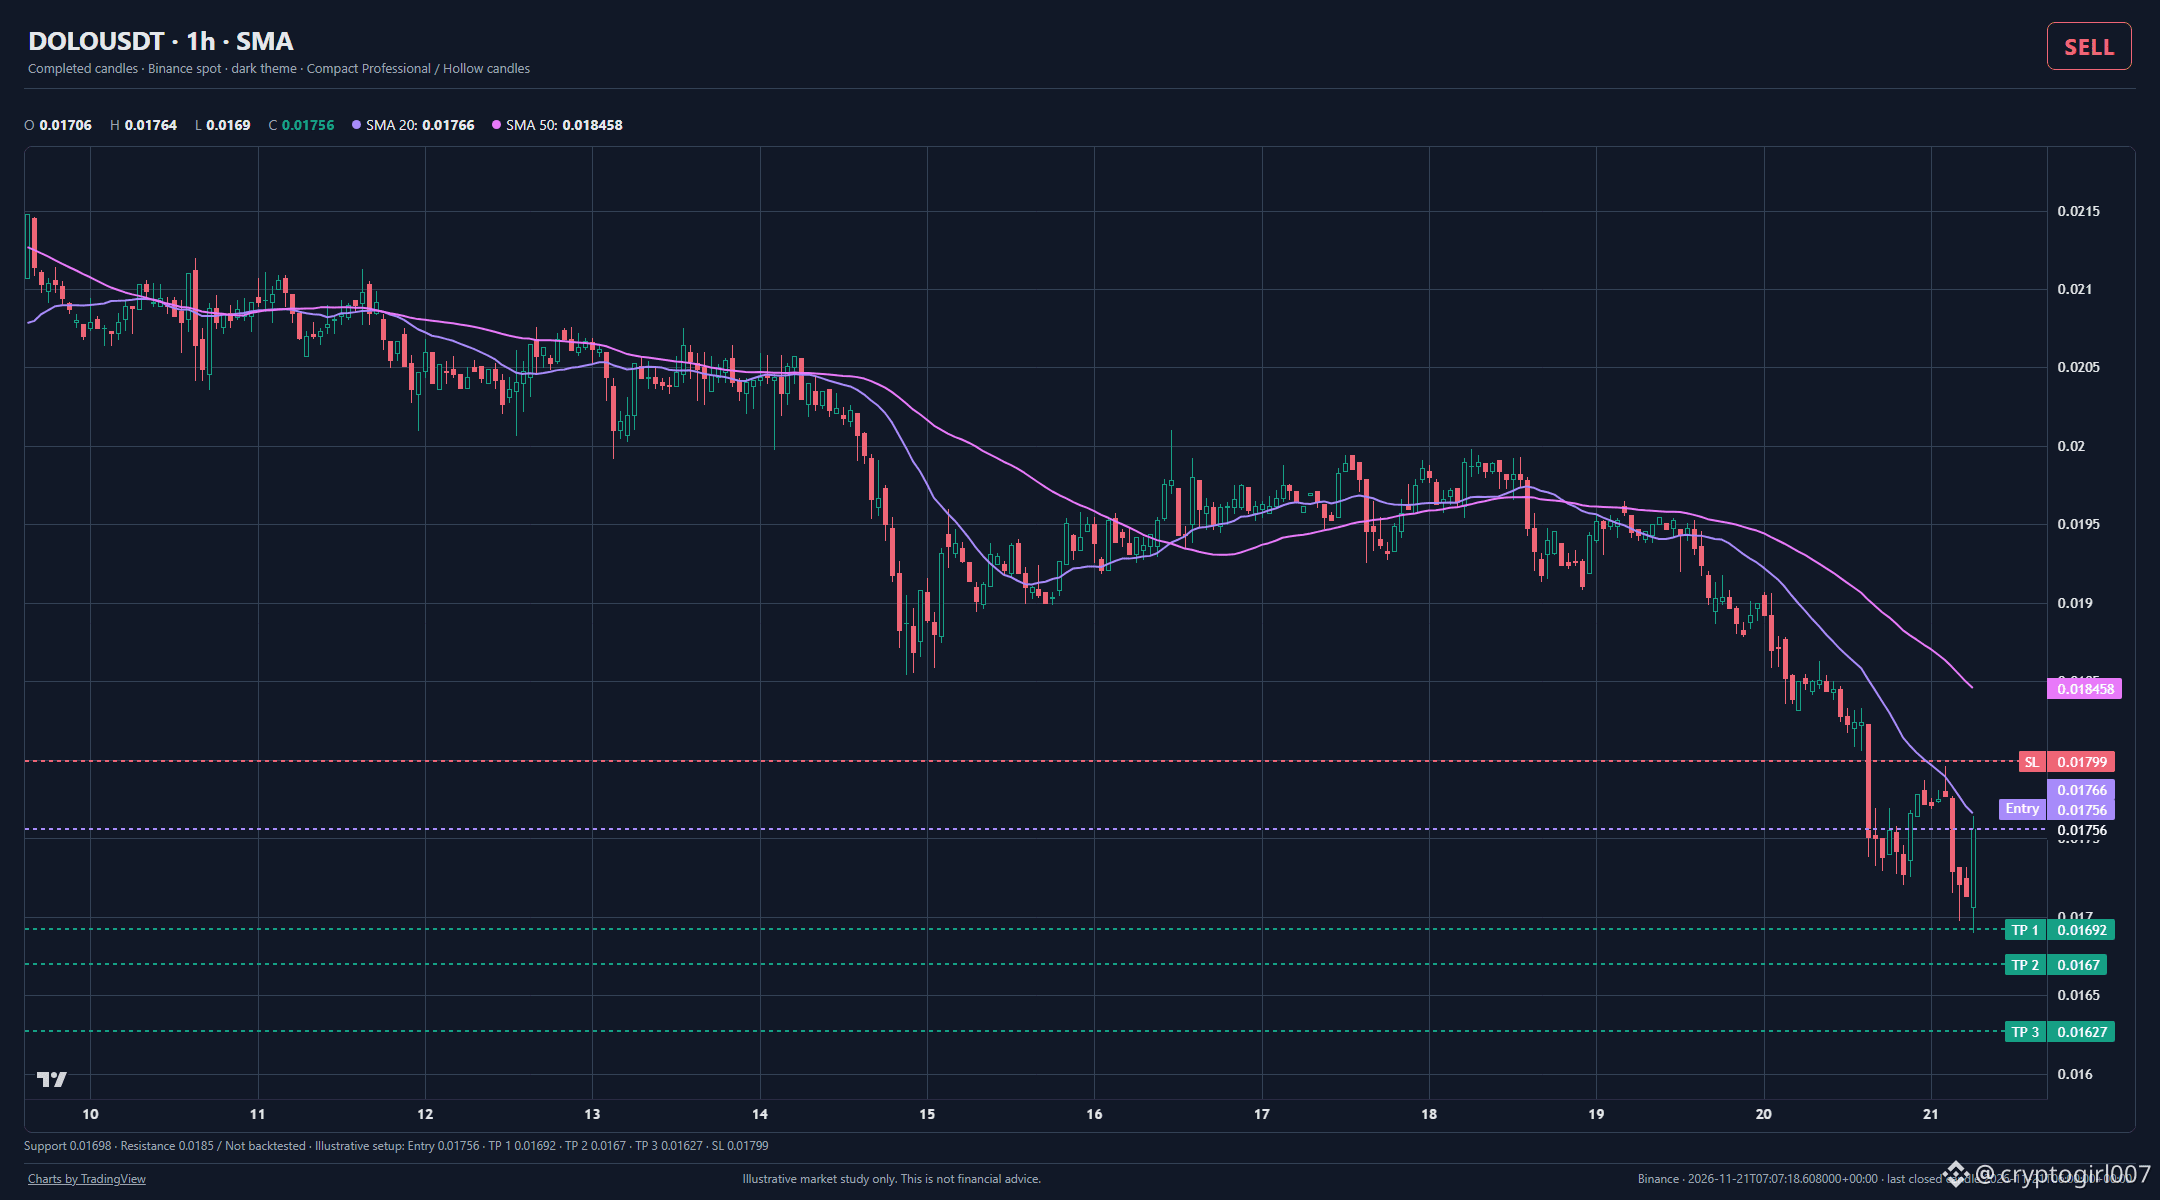
$DOLO is showing a bearish setup on the hourly chart.
Price is below both SMAs, with the faster average below the slower one. This supports the Sell signal. The last closed candle was around 0.01756 USDT. Support sits near 0.01698, with resistance around 0.0185.
SELL · illustrative short setup (USDT)
Entry ≈ 0.01756
TP1 ≈ 0.01692
TP2 ≈ 0.0167
TP3 ≈ 0.01627
SL ≈ 0.01799
Closed-candle analysis, not a live quote or trade instruction; not backtested.
#MarketStructure #ChartAnalysis
Illustrative market study only. This is not financial advice.
{spot}(DOLOUSDT)
The bearish signal is supported by price trading below both moving averages, with the faster average positioned beneath the slower one.
$DOLO is showing a bearish setup on the hourly chart.
Price is below both SMAs, with the faster average below the slower one. This supports the Sell signal. The last closed candle was around 0.01756 USDT. Support sits near 0.01698, with resistance around 0.0185.
SELL · illustrative short setup (USDT)
Entry ≈ 0.01756
TP1 ≈ 0.01692
TP2 ≈ 0.0167
TP3 ≈ 0.01627
SL ≈ 0.01799
Closed-candle analysis, not a live quote or trade instruction; not backtested.
#MarketStructure #ChartAnalysis
Illustrative market study only. This is not financial advice.
$DOLO is showing a bearish setup on the hourly chart.
Price is below both SMAs, with the faster average below the slower one. This supports the Sell signal. The last closed candle was around 0.01756 USDT. Support sits near 0.01698, with resistance around 0.0185.
SELL · illustrative short setup (USDT)
Entry ≈ 0.01756
TP1 ≈ 0.01692
TP2 ≈ 0.0167
TP3 ≈ 0.01627
SL ≈ 0.01799
Closed-candle analysis, not a live quote or trade instruction; not backtested.
#MarketStructure #ChartAnalysis
Illustrative market study only. This is not financial advice.
53
The thirty-minute chart indicates a bearish setup for MORPHO, with the MFI supporting this directional bias as part of an illustrative short market structure analysis.
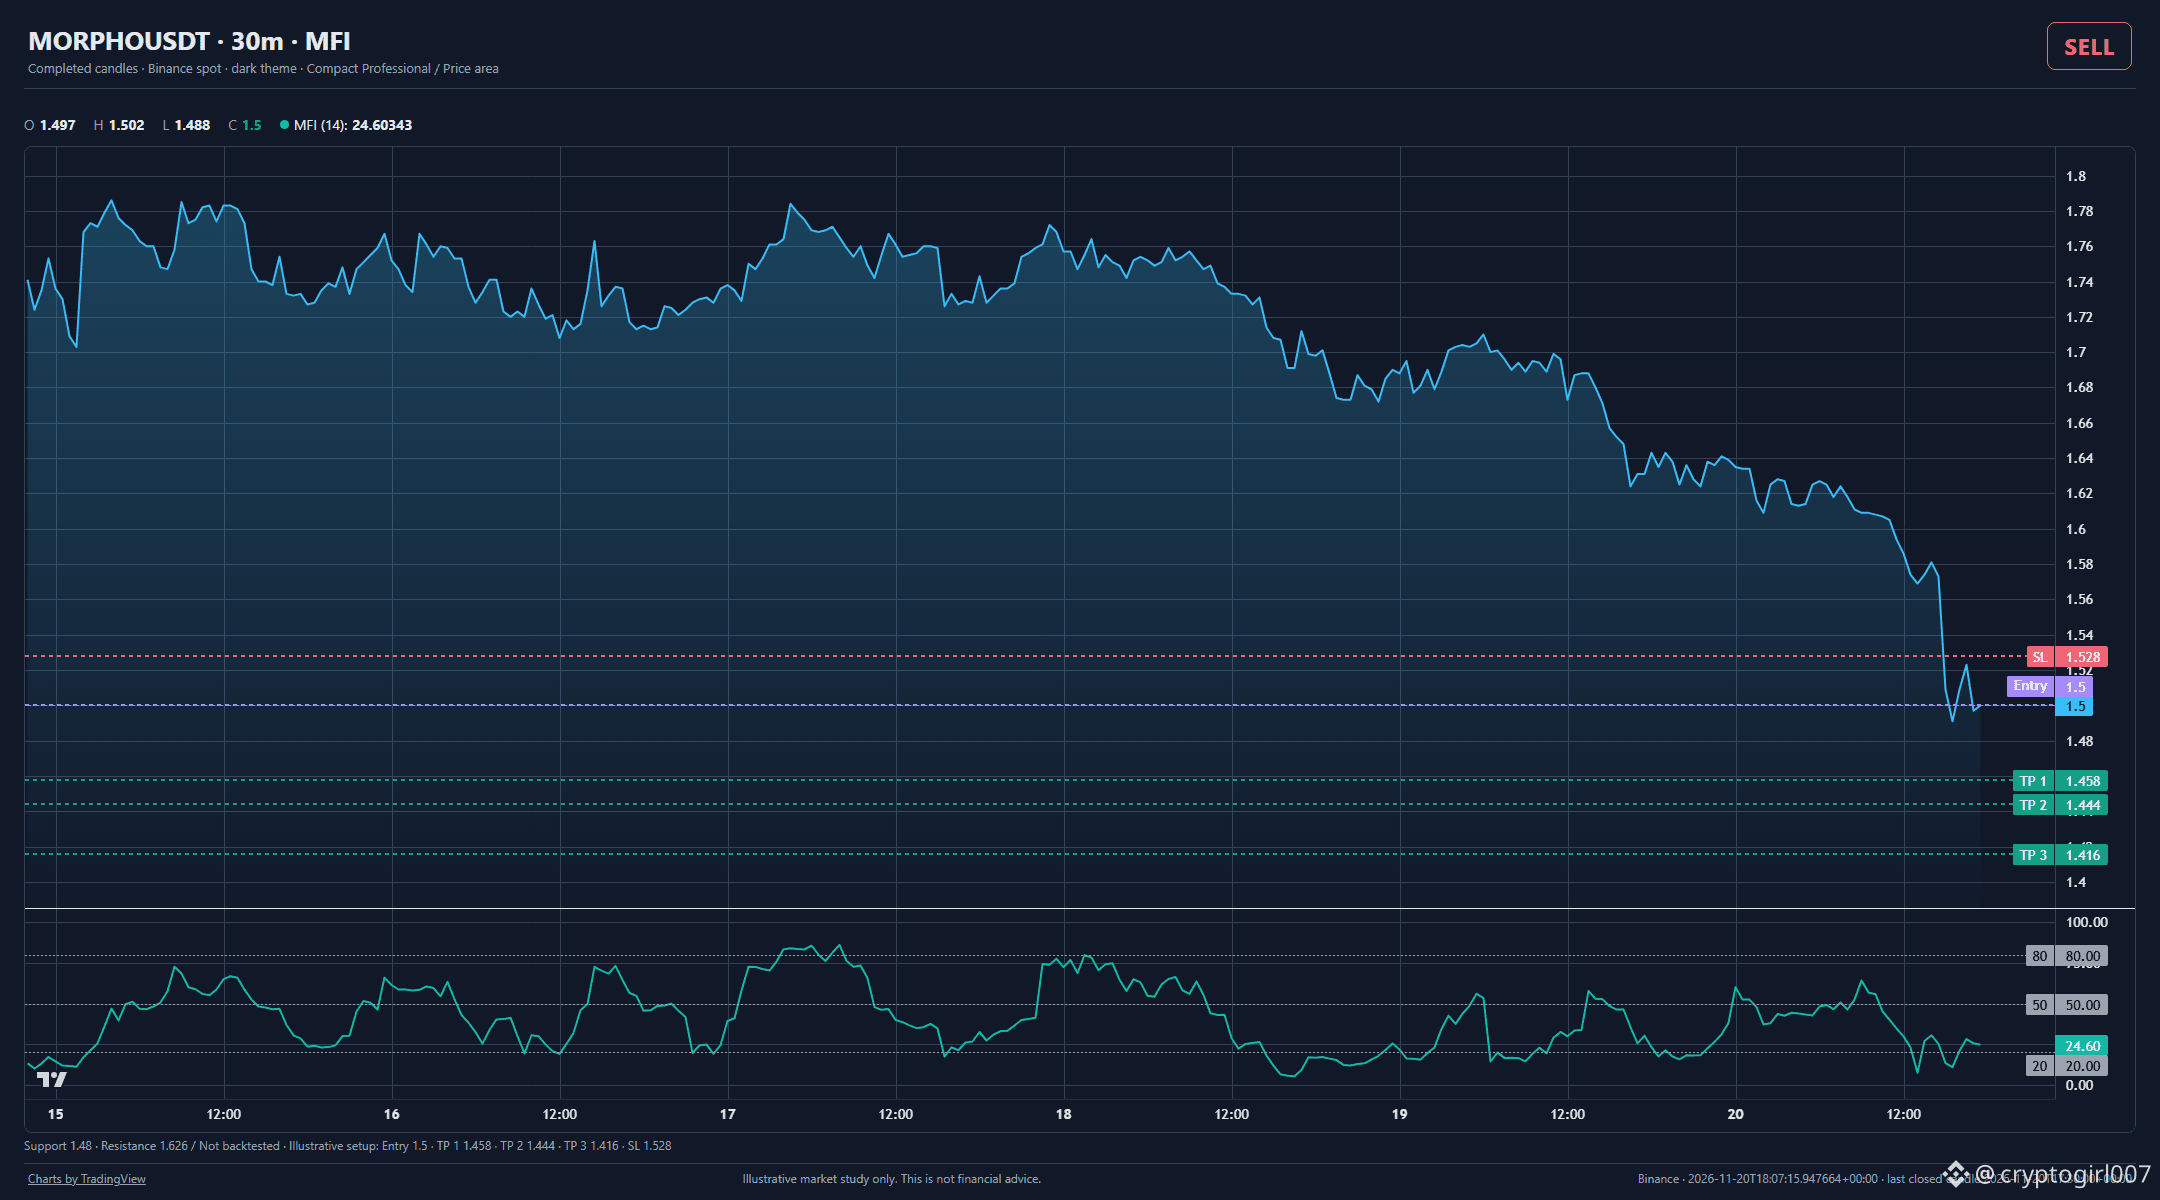
$MORPHO is showing a bearish setup on the thirty-minute chart.
MFI supports the bearish reading. This supports the Sell signal. The last closed candle was around 1.5 USDT. Support sits near 1.48, with resistance around 1.626.
SELL · illustrative short setup (USDT)
Entry ≈ 1.5
TP1 ≈ 1.458
TP2 ≈ 1.444
TP3 ≈ 1.416
SL ≈ 1.528
Closed-candle analysis, not a live quote or trade instruction; not backtested.
#MarketStructure #ChartAnalysis
Illustrative market study only. This is not financial advice.
{spot}(MORPHOUSDT)
The thirty-minute chart indicates a bearish setup for MORPHO, with the MFI supporting this directional bias as part of an illustrative short market structure analysis.
$MORPHO is showing a bearish setup on the thirty-minute chart.
MFI supports the bearish reading. This supports the Sell signal. The last closed candle was around 1.5 USDT. Support sits near 1.48, with resistance around 1.626.
SELL · illustrative short setup (USDT)
Entry ≈ 1.5
TP1 ≈ 1.458
TP2 ≈ 1.444
TP3 ≈ 1.416
SL ≈ 1.528
Closed-candle analysis, not a live quote or trade instruction; not backtested.
#MarketStructure #ChartAnalysis
Illustrative market study only. This is not financial advice.
$MORPHO is showing a bearish setup on the thirty-minute chart.
MFI supports the bearish reading. This supports the Sell signal. The last closed candle was around 1.5 USDT. Support sits near 1.48, with resistance around 1.626.
SELL · illustrative short setup (USDT)
Entry ≈ 1.5
TP1 ≈ 1.458
TP2 ≈ 1.444
TP3 ≈ 1.416
SL ≈ 1.528
Closed-candle analysis, not a live quote or trade instruction; not backtested.
#MarketStructure #ChartAnalysis
Illustrative market study only. This is not financial advice.
7
The Bollinger indicator supports the bearish reading, which aligns with the sell signal for this asset.
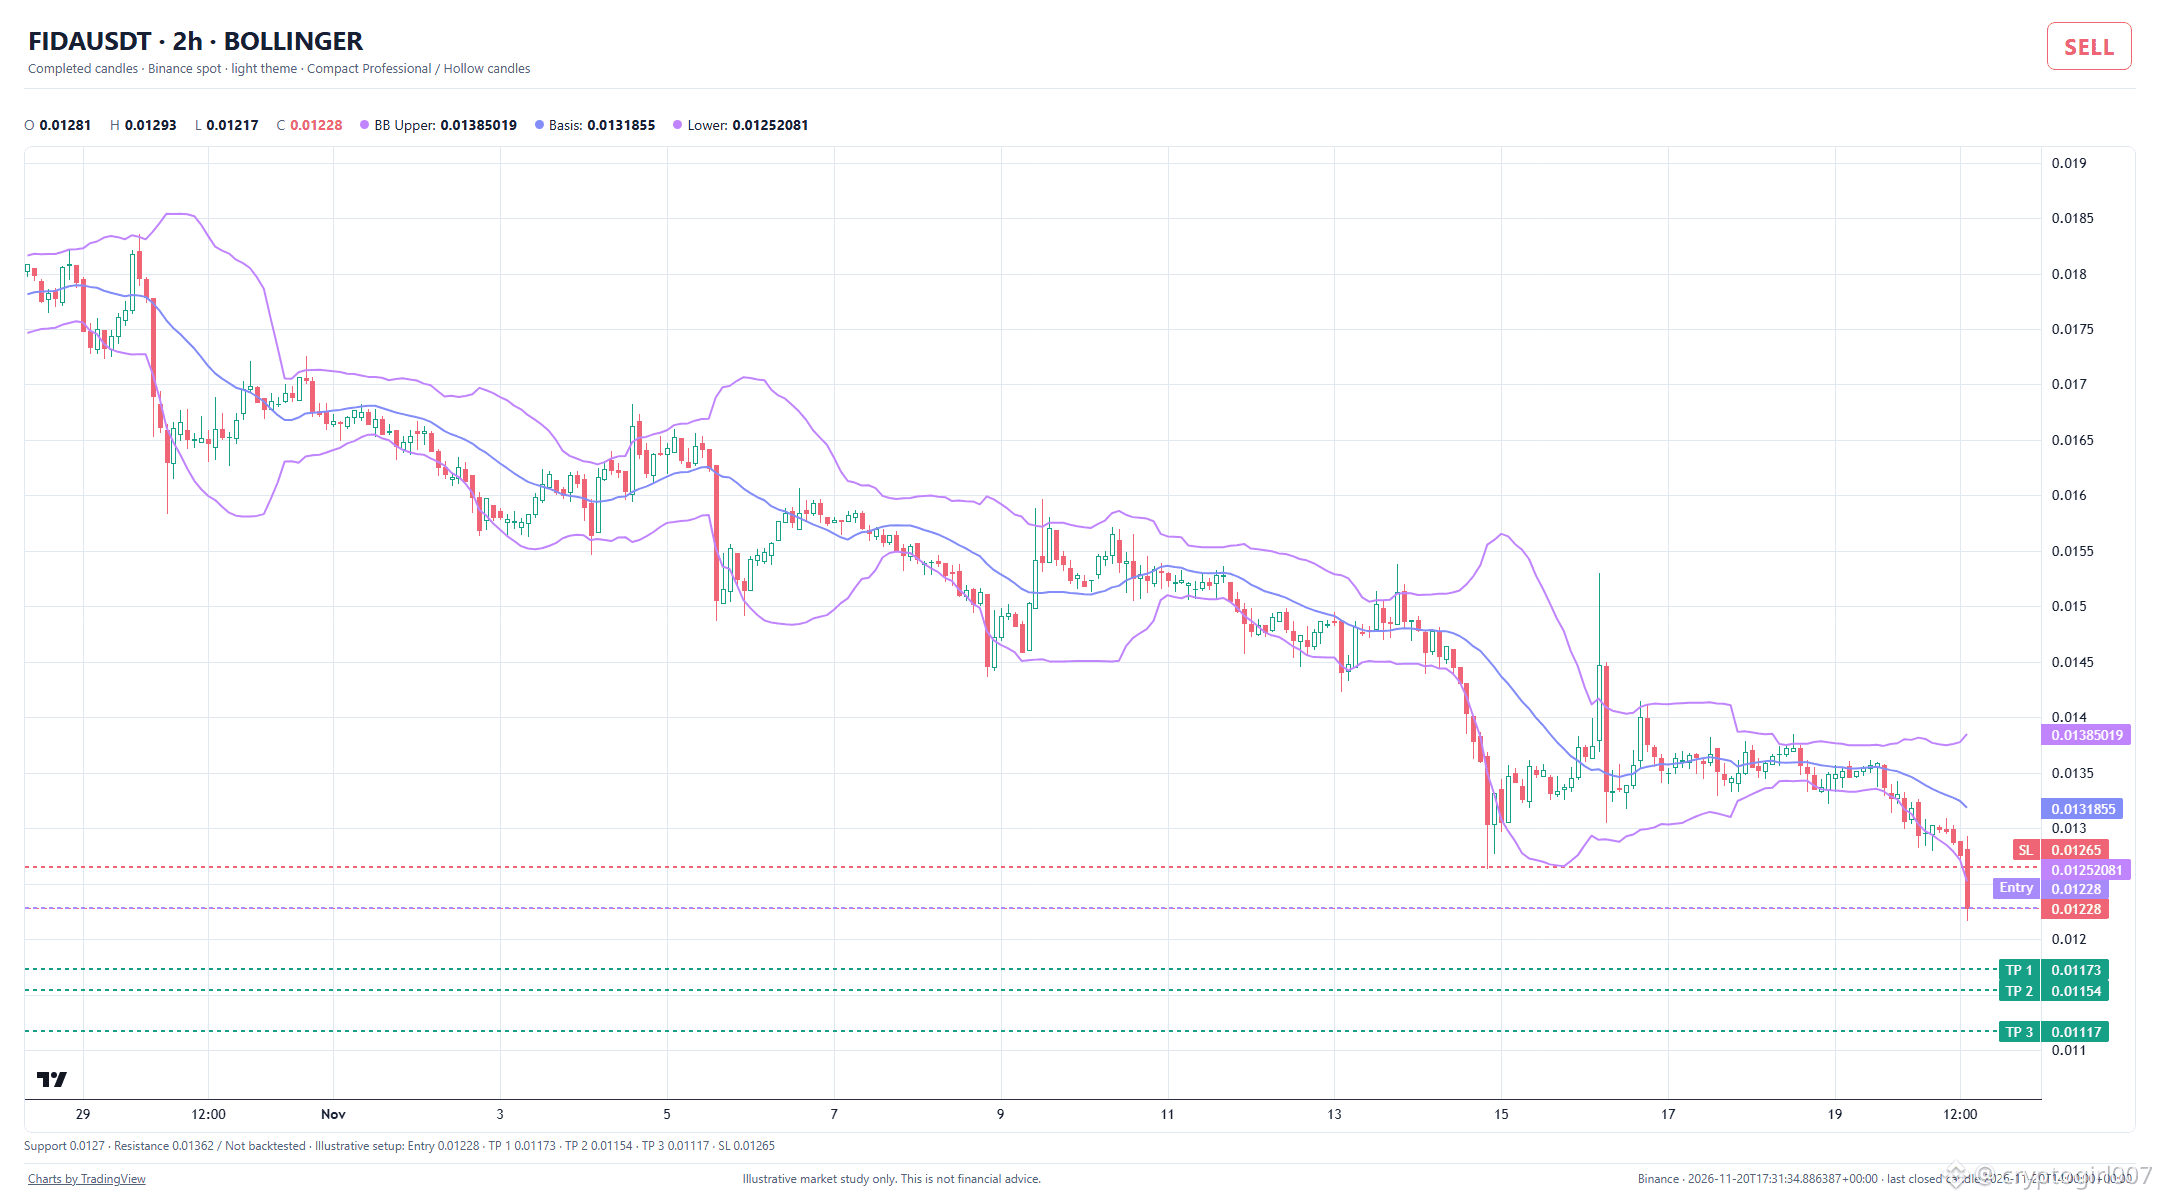
$FIDA is showing a bearish setup on the two-hour chart.
BOLLINGER supports the bearish reading. This supports the Sell signal. The last closed candle was around 0.01228 USDT. Support sits near 0.0127, with resistance around 0.01362.
SELL · illustrative short setup (USDT)
Entry ≈ 0.01228
TP1 ≈ 0.01173
TP2 ≈ 0.01154
TP3 ≈ 0.01117
SL ≈ 0.01265
Closed-candle analysis, not a live quote or trade instruction; not backtested.
#MarketStructure #ChartAnalysis
Illustrative market study only. This is not financial advice.
{spot}(FIDAUSDT)
The Bollinger indicator supports the bearish reading, which aligns with the sell signal for this asset.
$FIDA is showing a bearish setup on the two-hour chart.
BOLLINGER supports the bearish reading. This supports the Sell signal. The last closed candle was around 0.01228 USDT. Support sits near 0.0127, with resistance around 0.01362.
SELL · illustrative short setup (USDT)
Entry ≈ 0.01228
TP1 ≈ 0.01173
TP2 ≈ 0.01154
TP3 ≈ 0.01117
SL ≈ 0.01265
Closed-candle analysis, not a live quote or trade instruction; not backtested.
#MarketStructure #ChartAnalysis
Illustrative market study only. This is not financial advice.
$FIDA is showing a bearish setup on the two-hour chart.
BOLLINGER supports the bearish reading. This supports the Sell signal. The last closed candle was around 0.01228 USDT. Support sits near 0.0127, with resistance around 0.01362.
SELL · illustrative short setup (USDT)
Entry ≈ 0.01228
TP1 ≈ 0.01173
TP2 ≈ 0.01154
TP3 ≈ 0.01117
SL ≈ 0.01265
Closed-candle analysis, not a live quote or trade instruction; not backtested.
#MarketStructure #ChartAnalysis
Illustrative market study only. This is not financial advice.
57
The SUPERTREND indicator supports the bearish reading for this asset, reinforcing the directional bias derived from the hourly chart structure.
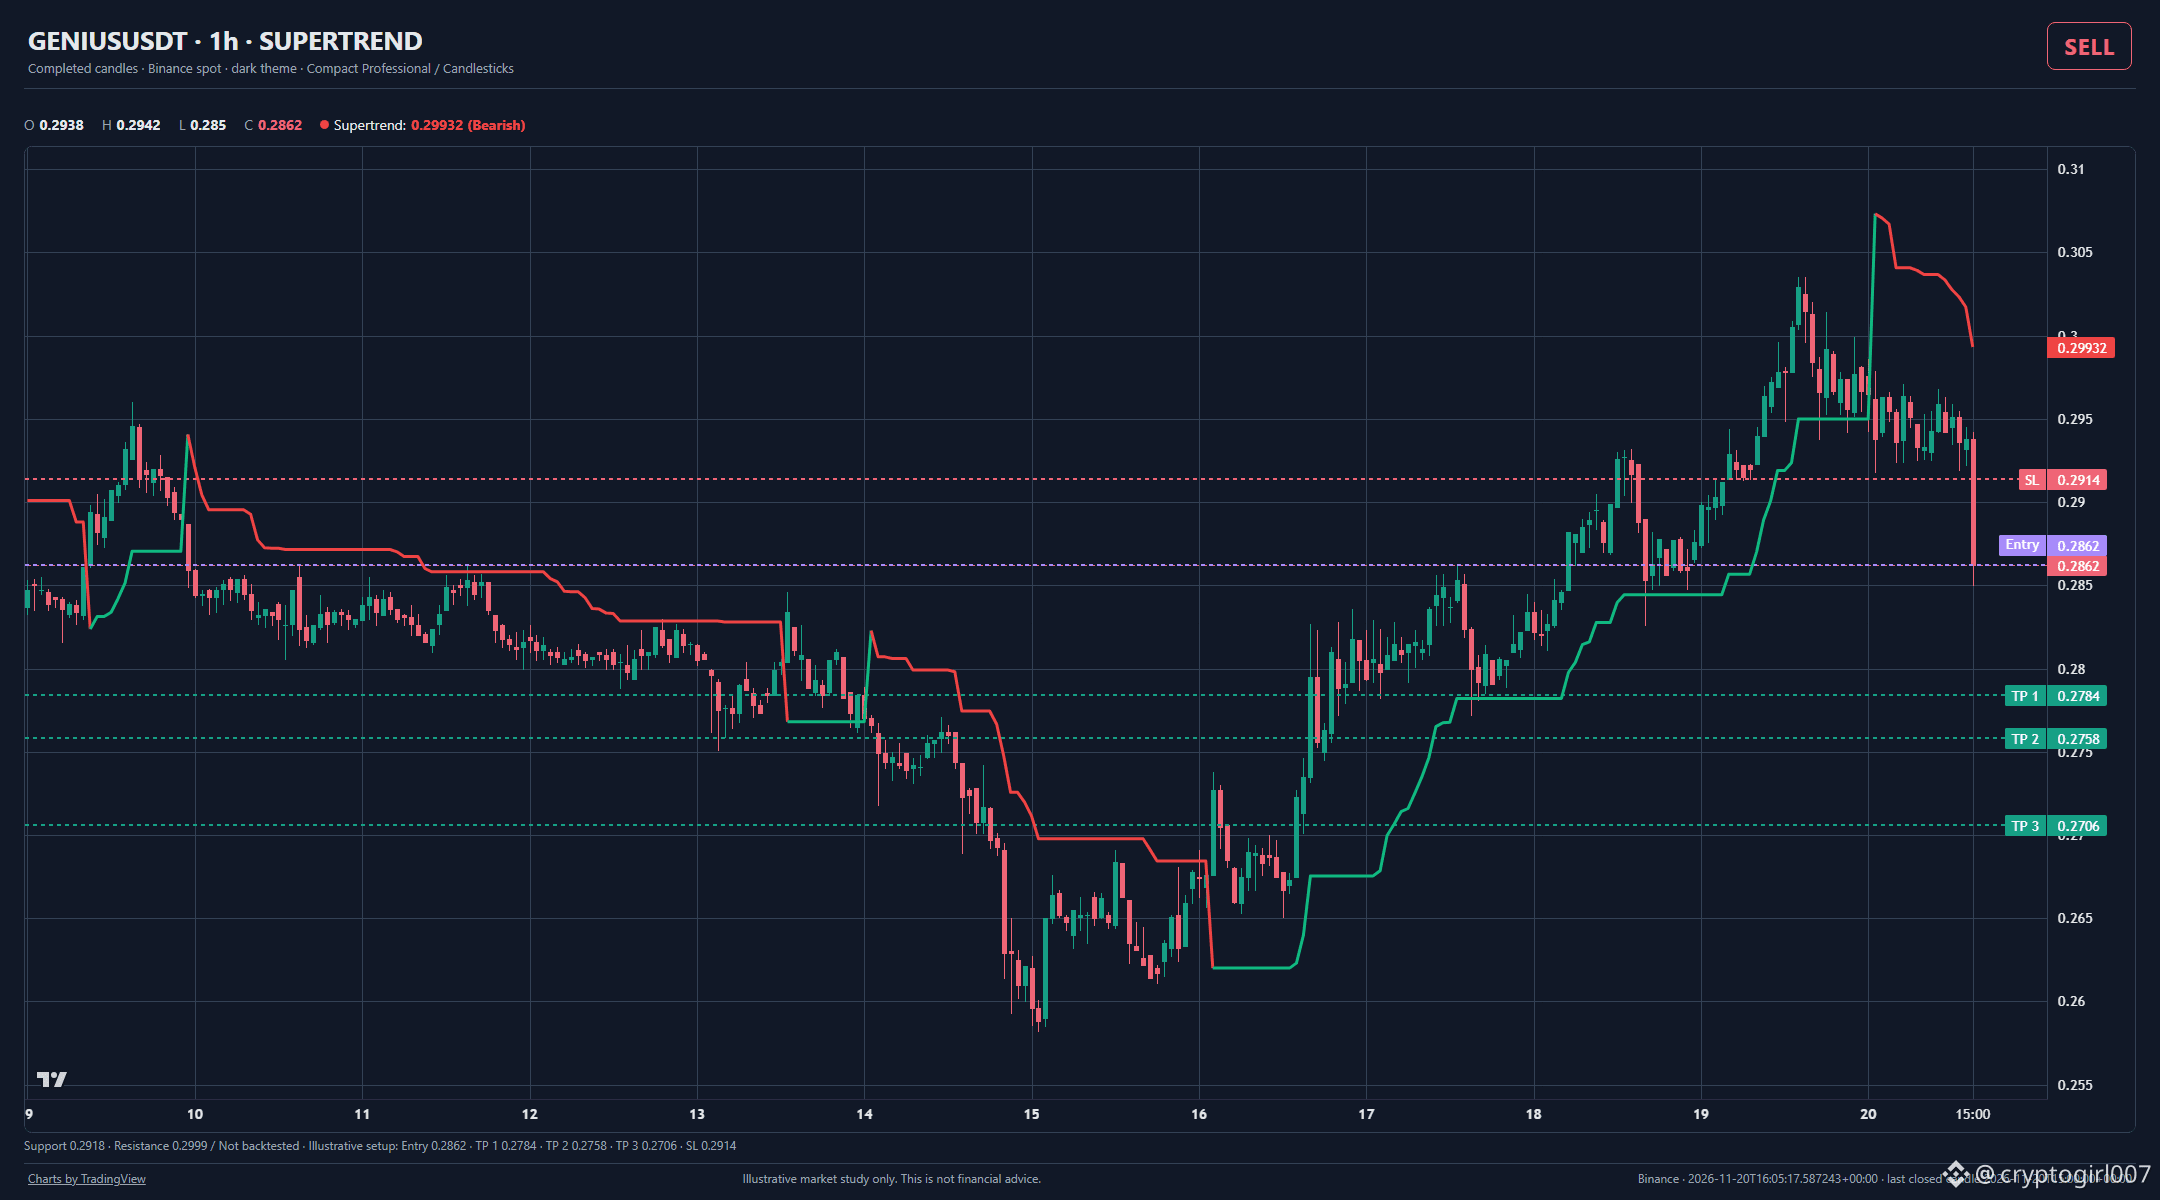
$GENIUS is showing a bearish setup on the hourly chart.
SUPERTREND supports the bearish reading. This supports the Sell signal. The last closed candle was around 0.2862 USDT. Support sits near 0.2918, with resistance around 0.2999.
SELL · illustrative short setup (USDT)
Entry ≈ 0.2862
TP1 ≈ 0.2784
TP2 ≈ 0.2758
TP3 ≈ 0.2706
SL ≈ 0.2914
Closed-candle analysis, not a live quote or trade instruction; not backtested.
#MarketStructure #ChartAnalysis
Illustrative market study only. This is not financial advice.
The SUPERTREND indicator supports the bearish reading for this asset, reinforcing the directional bias derived from the hourly chart structure.
$GENIUS is showing a bearish setup on the hourly chart.
SUPERTREND supports the bearish reading. This supports the Sell signal. The last closed candle was around 0.2862 USDT. Support sits near 0.2918, with resistance around 0.2999.
SELL · illustrative short setup (USDT)
Entry ≈ 0.2862
TP1 ≈ 0.2784
TP2 ≈ 0.2758
TP3 ≈ 0.2706
SL ≈ 0.2914
Closed-candle analysis, not a live quote or trade instruction; not backtested.
#MarketStructure #ChartAnalysis
Illustrative market study only. This is not financial advice.
$GENIUS is showing a bearish setup on the hourly chart.
SUPERTREND supports the bearish reading. This supports the Sell signal. The last closed candle was around 0.2862 USDT. Support sits near 0.2918, with resistance around 0.2999.
SELL · illustrative short setup (USDT)
Entry ≈ 0.2862
TP1 ≈ 0.2784
TP2 ≈ 0.2758
TP3 ≈ 0.2706
SL ≈ 0.2914
Closed-candle analysis, not a live quote or trade instruction; not backtested.
#MarketStructure #ChartAnalysis
Illustrative market study only. This is not financial advice.
36
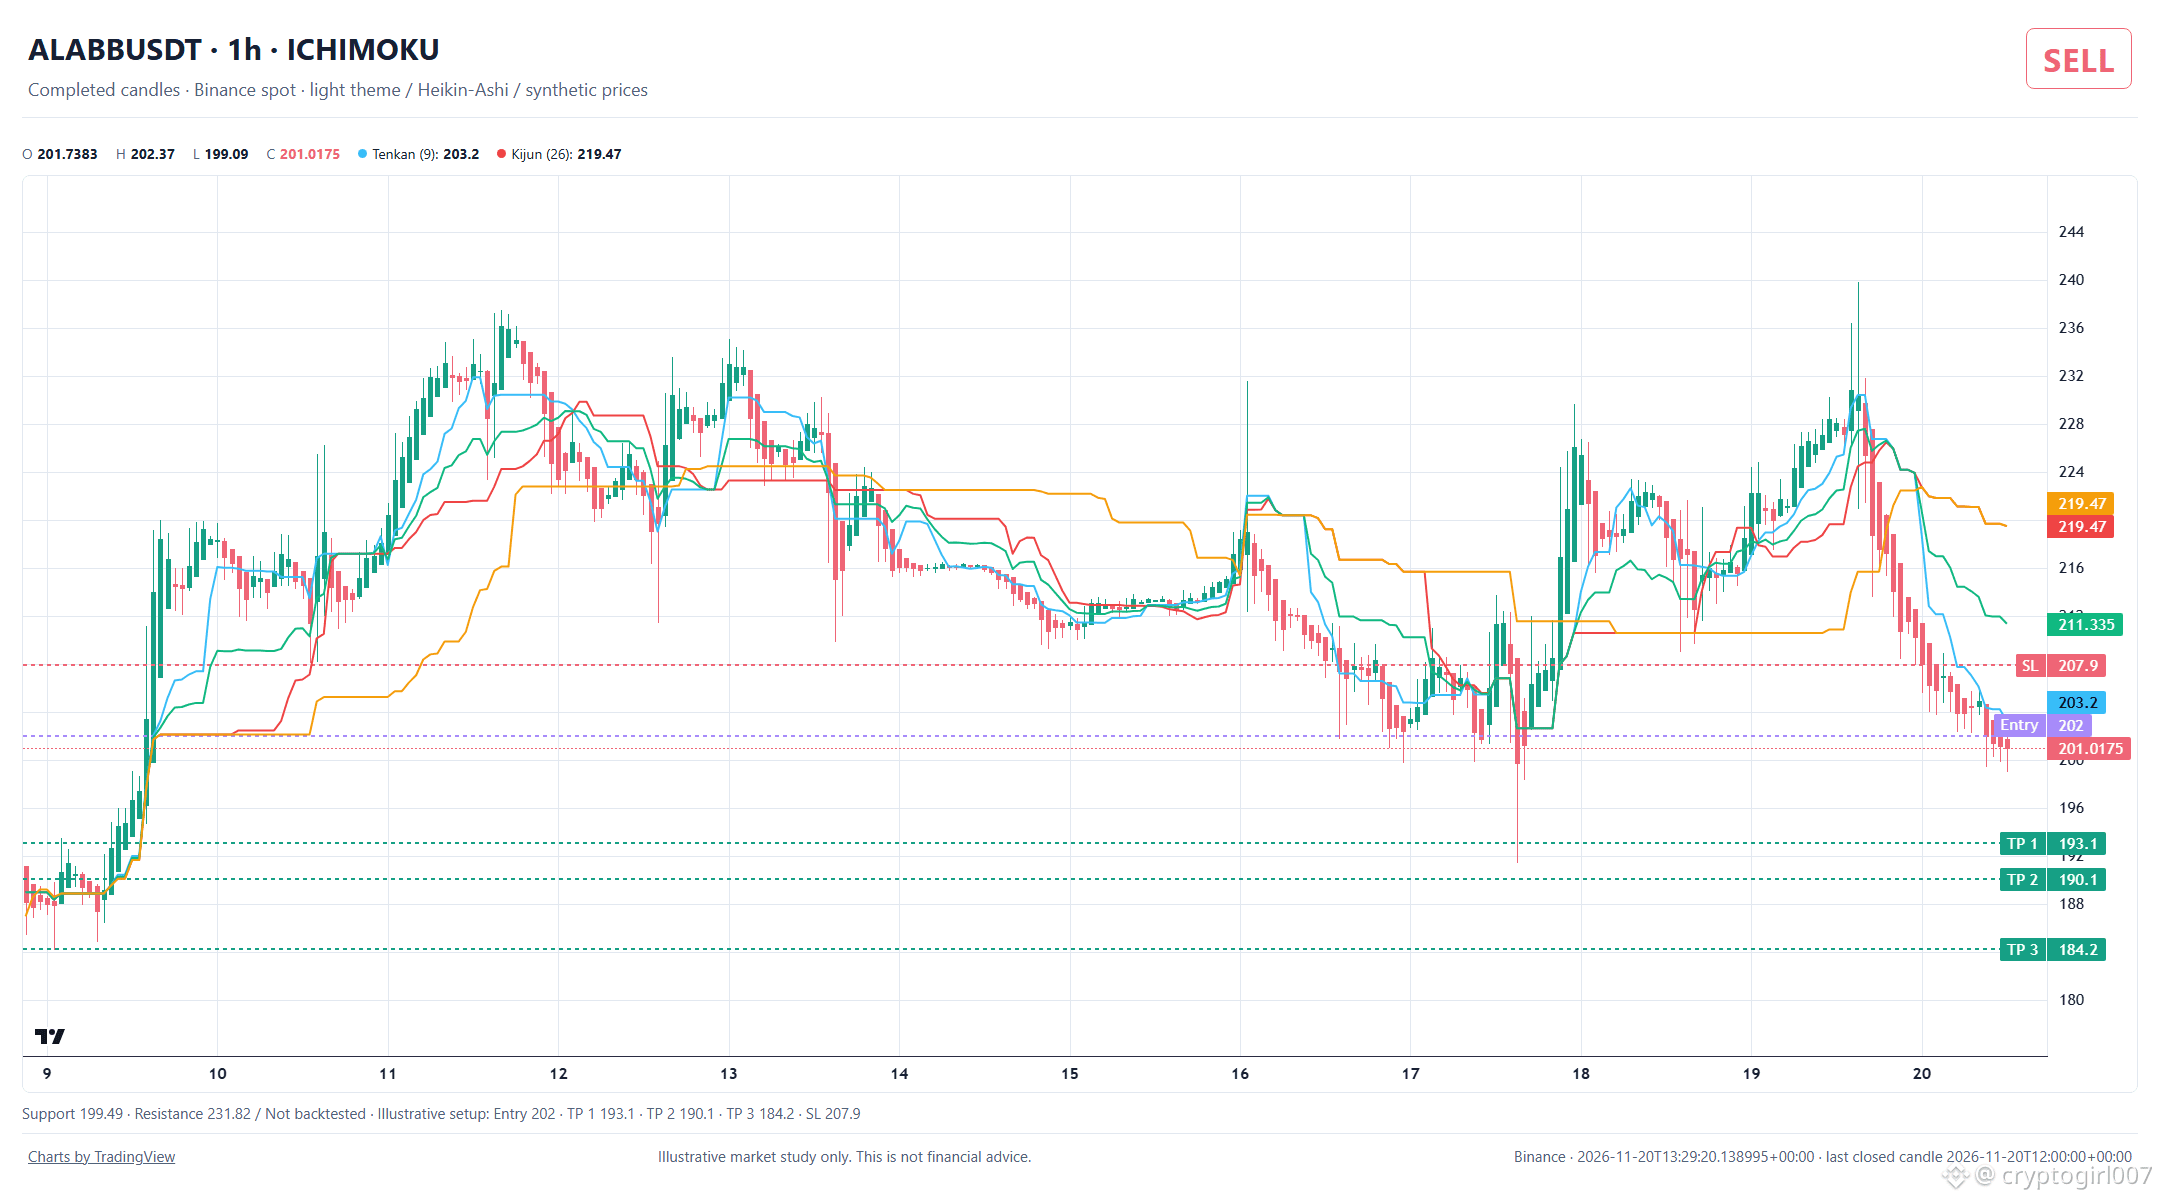
The Ichimoku indicator supports the bearish reading, aligning with the sell signal for this asset.
$ALABB is showing a bearish setup on the hourly chart.
ICHIMOKU supports the bearish reading. This supports the Sell signal. The last closed candle was around 202 USDT. Support sits near 199.5, with resistance around 231.8.
SELL · illustrative short setup (USDT)
Entry ≈ 202
TP1 ≈ 193.1
TP2 ≈ 190.1
TP3 ≈ 184.2
SL ≈ 207.9
Closed-candle analysis, not a live quote or trade instruction; not backtested.
#MarketStructure #ChartAnalysis
Illustrative market study only. This is not financial advice.
{spot}(ALABBUSDT)
The Ichimoku indicator supports the bearish reading, aligning with the sell signal for this asset.
$ALABB is showing a bearish setup on the hourly chart.
ICHIMOKU supports the bearish reading. This supports the Sell signal. The last closed candle was around 202 USDT. Support sits near 199.5, with resistance around 231.8.
SELL · illustrative short setup (USDT)
Entry ≈ 202
TP1 ≈ 193.1
TP2 ≈ 190.1
TP3 ≈ 184.2
SL ≈ 207.9
Closed-candle analysis, not a live quote or trade instruction; not backtested.
#MarketStructure #ChartAnalysis
Illustrative market study only. This is not financial advice.
$ALABB is showing a bearish setup on the hourly chart.
ICHIMOKU supports the bearish reading. This supports the Sell signal. The last closed candle was around 202 USDT. Support sits near 199.5, with resistance around 231.8.
SELL · illustrative short setup (USDT)
Entry ≈ 202
TP1 ≈ 193.1
TP2 ≈ 190.1
TP3 ≈ 184.2
SL ≈ 207.9
Closed-candle analysis, not a live quote or trade instruction; not backtested.
#MarketStructure #ChartAnalysis
Illustrative market study only. This is not financial advice.
6
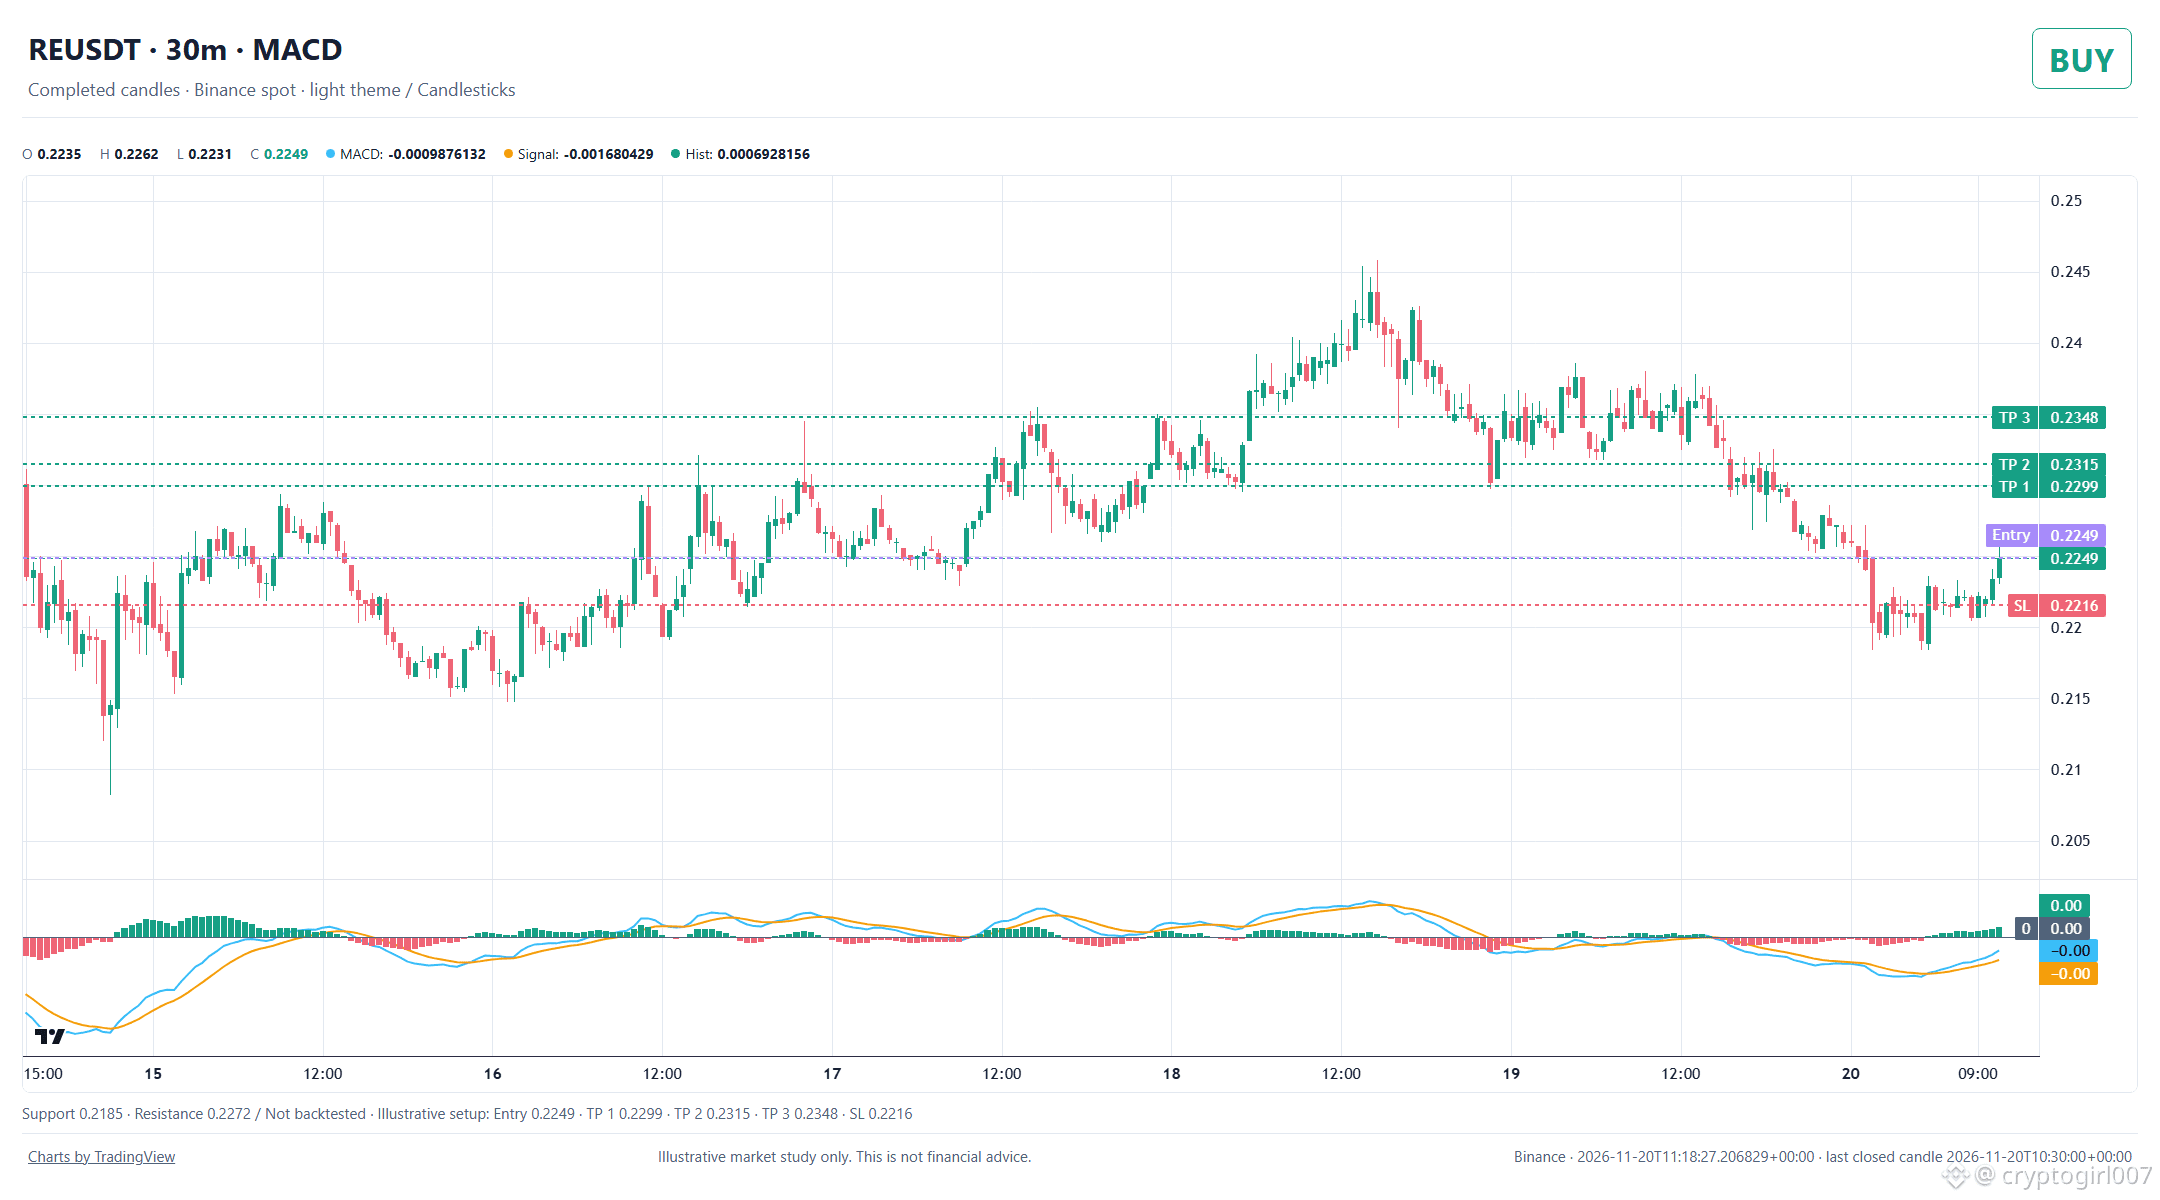
The MACD histogram being above zero supports the bullish setup indicated by the Buy signal on the thirty-minute chart.
$RE is showing a bullish setup on the thirty-minute chart.
The MACD histogram is above zero. This supports the Buy signal. The last closed candle was around 0.2249 USDT. Support sits near 0.2185, with resistance around 0.2272.
BUY · illustrative long setup (USDT)
Entry ≈ 0.2249
TP1 ≈ 0.2299
TP2 ≈ 0.2315
TP3 ≈ 0.2348
SL ≈ 0.2216
Closed-candle analysis, not a live quote or trade instruction; not backtested.
#MarketStructure #ChartAnalysis
Illustrative market study only. This is not financial advice.
{spot}(REUSDT)
The MACD histogram being above zero supports the bullish setup indicated by the Buy signal on the thirty-minute chart.
$RE is showing a bullish setup on the thirty-minute chart.
The MACD histogram is above zero. This supports the Buy signal. The last closed candle was around 0.2249 USDT. Support sits near 0.2185, with resistance around 0.2272.
BUY · illustrative long setup (USDT)
Entry ≈ 0.2249
TP1 ≈ 0.2299
TP2 ≈ 0.2315
TP3 ≈ 0.2348
SL ≈ 0.2216
Closed-candle analysis, not a live quote or trade instruction; not backtested.
#MarketStructure #ChartAnalysis
Illustrative market study only. This is not financial advice.
$RE is showing a bullish setup on the thirty-minute chart.
The MACD histogram is above zero. This supports the Buy signal. The last closed candle was around 0.2249 USDT. Support sits near 0.2185, with resistance around 0.2272.
BUY · illustrative long setup (USDT)
Entry ≈ 0.2249
TP1 ≈ 0.2299
TP2 ≈ 0.2315
TP3 ≈ 0.2348
SL ≈ 0.2216
Closed-candle analysis, not a live quote or trade instruction; not backtested.
#MarketStructure #ChartAnalysis
Illustrative market study only. This is not financial advice.
97
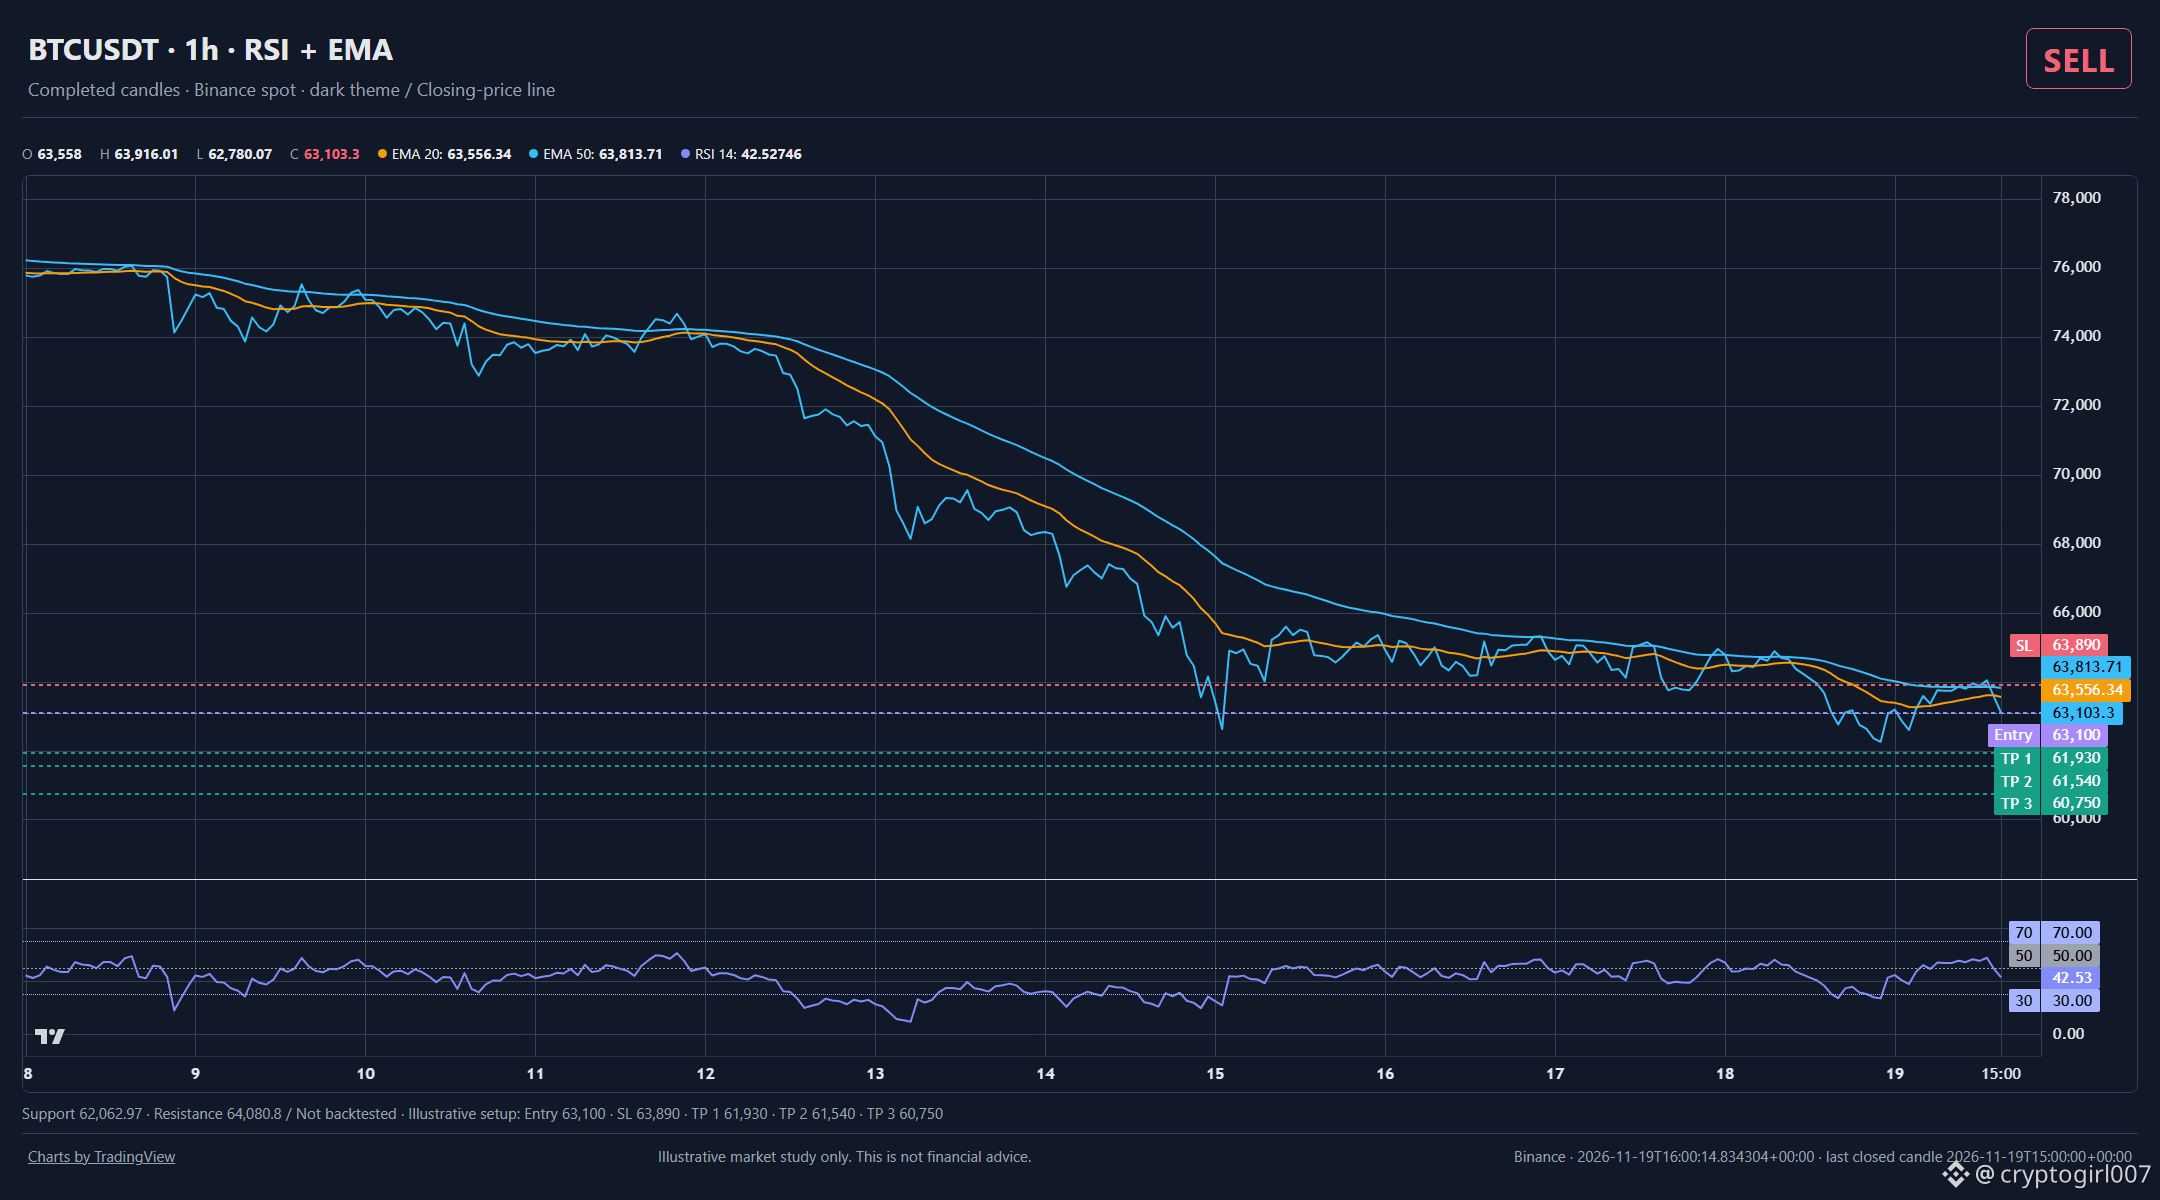
The faster moving average crossing below the slower one confirms downward momentum, making this structural relationship critical for validating the bearish bias.
$BTC is showing a bearish setup on the hourly chart.
RSI supports the bearish reading. Price is below both EMAs, with the faster average below the slower one. This supports the Sell signal. The last closed candle was around 63,100 USDT. Support sits near 62,060, with resistance around 64,080.
The illustrative short setup uses an entry near 63,100, a stop near 63,890 and targets around 61,930, 61,540, 60,750.
Closed-candle analysis, not a live quote or trade instruction; not backtested.
#MarketStructure #ChartAnalysis
Illustrative market study only. This is not financial advice.
{spot}(BTCUSDT)
The faster moving average crossing below the slower one confirms downward momentum, making this structural relationship critical for validating the bearish bias.
$BTC is showing a bearish setup on the hourly chart.
RSI supports the bearish reading. Price is below both EMAs, with the faster average below the slower one. This supports the Sell signal. The last closed candle was around 63,100 USDT. Support sits near 62,060, with resistance around 64,080.
The illustrative short setup uses an entry near 63,100, a stop near 63,890 and targets around 61,930, 61,540, 60,750.
Closed-candle analysis, not a live quote or trade instruction; not backtested.
#MarketStructure #ChartAnalysis
Illustrative market study only. This is not financial advice.
$BTC is showing a bearish setup on the hourly chart.
RSI supports the bearish reading. Price is below both EMAs, with the faster average below the slower one. This supports the Sell signal. The last closed candle was around 63,100 USDT. Support sits near 62,060, with resistance around 64,080.
The illustrative short setup uses an entry near 63,100, a stop near 63,890 and targets around 61,930, 61,540, 60,750.
Closed-candle analysis, not a live quote or trade instruction; not backtested.
#MarketStructure #ChartAnalysis
Illustrative market study only. This is not financial advice.
7

·
--
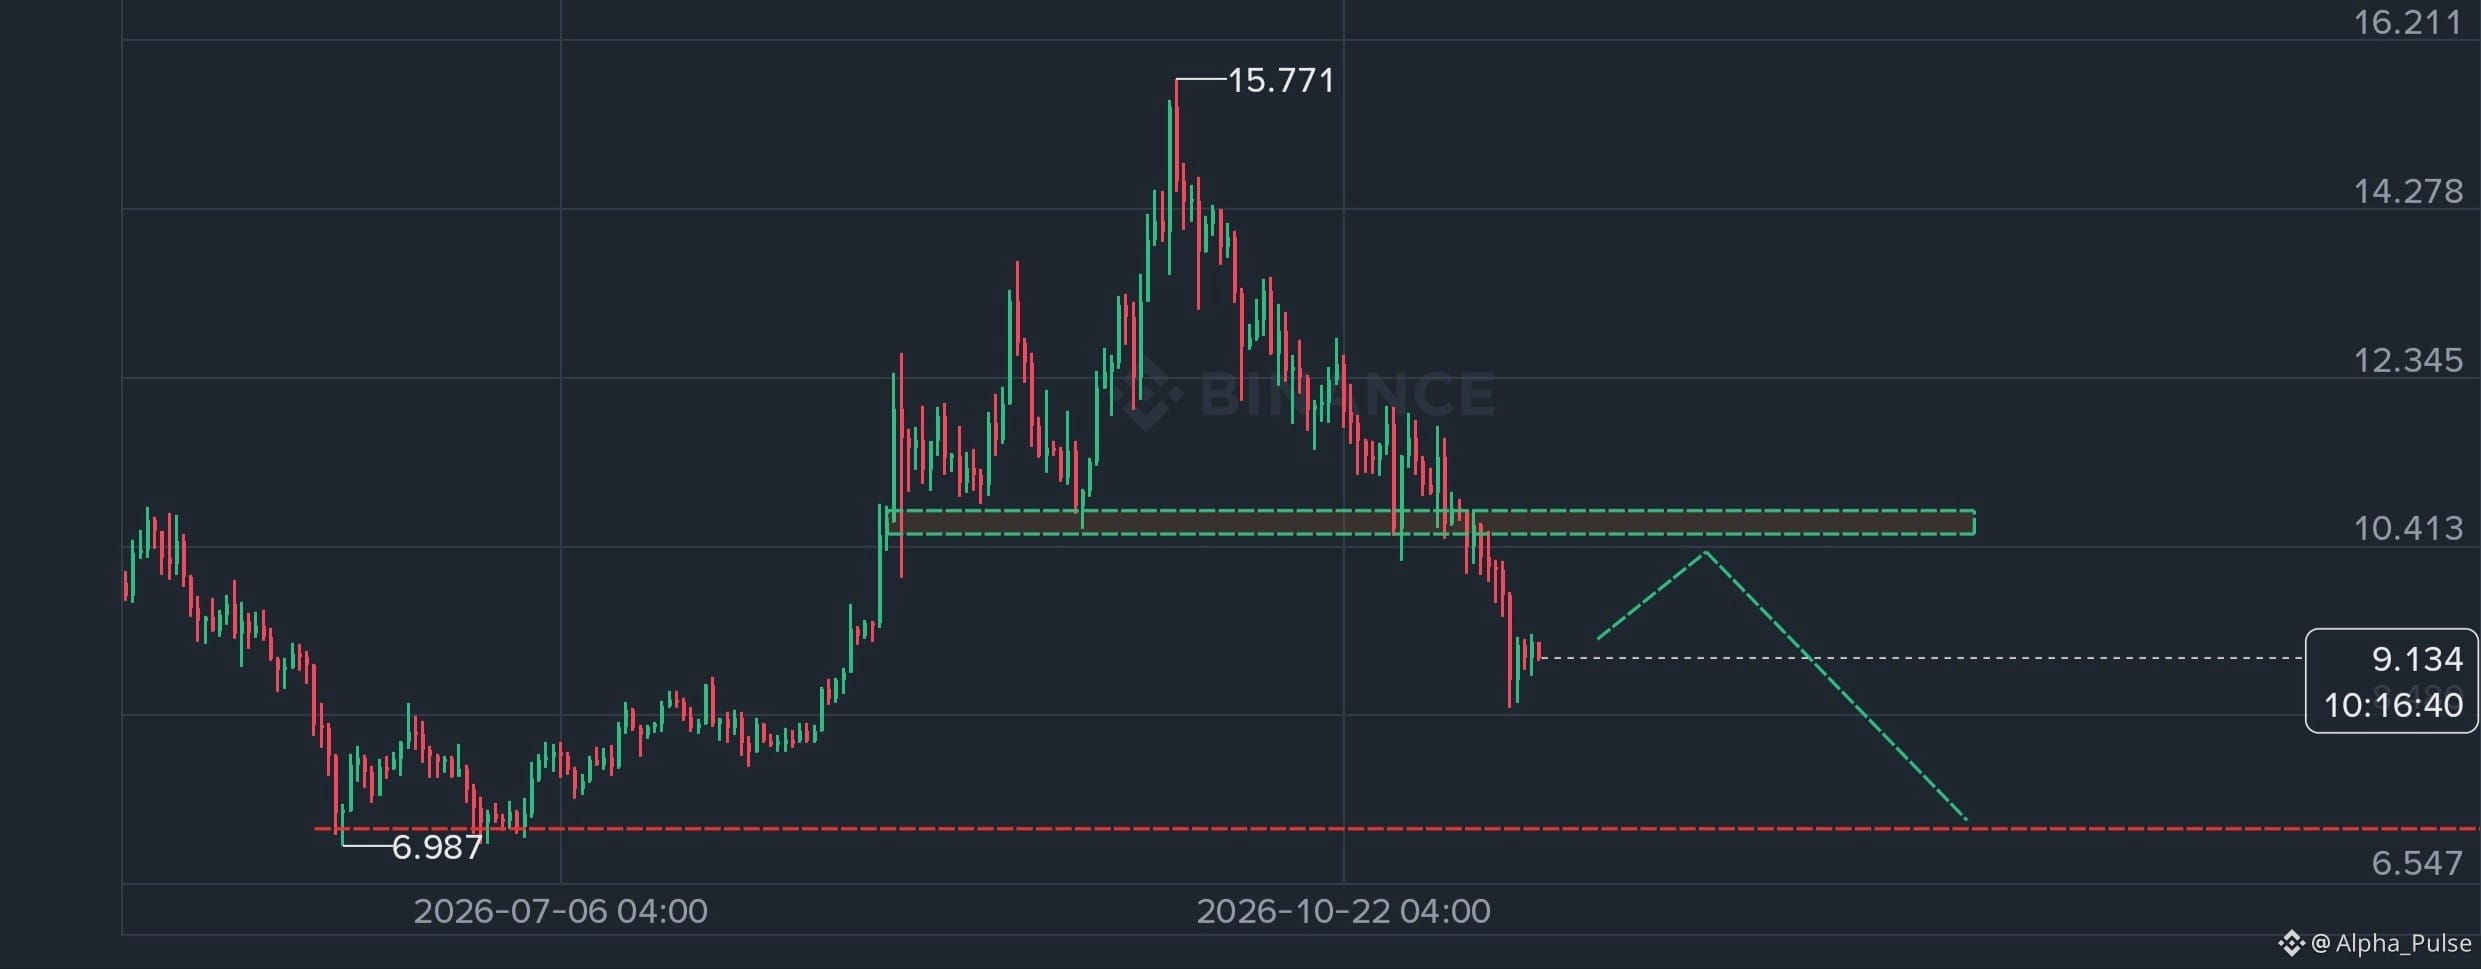
🚨 ** Breakdown Alert! Is 6.987 Next?** 🚨
The daily chart for $LINK just flashed a classic breakdown below the **10.413** support level after rejecting from **15.771**.
Right now, price is consolidating around **9.129**. If we get a dead-cat bounce to retest **10.413** and get rejected, we could see a smooth drop straight toward the **6.987** demand zone. 📉
What’s your move on $LINK right now?
👇 Drop your thoughts below!
🟢 Buying the dip here
🔴 Waiting to short the 10.413 retest
$LINK #Altcoins #ChartAnalysis #BinanceSquare
🚨 ** Breakdown Alert! Is 6.987 Next?** 🚨
The daily chart for $LINK just flashed a classic breakdown below the **10.413** support level after rejecting from **15.771**.
Right now, price is consolidating around **9.129**. If we get a dead-cat bounce to retest **10.413** and get rejected, we could see a smooth drop straight toward the **6.987** demand zone. 📉
What’s your move on $LINK right now?
👇 Drop your thoughts below!
🟢 Buying the dip here
🔴 Waiting to short the 10.413 retest
$LINK #Altcoins #ChartAnalysis #BinanceSquare
The daily chart for $LINK just flashed a classic breakdown below the **10.413** support level after rejecting from **15.771**.
Right now, price is consolidating around **9.129**. If we get a dead-cat bounce to retest **10.413** and get rejected, we could see a smooth drop straight toward the **6.987** demand zone. 📉
What’s your move on $LINK right now?
👇 Drop your thoughts below!
🟢 Buying the dip here
🔴 Waiting to short the 10.413 retest
$LINK #Altcoins #ChartAnalysis #BinanceSquare
83

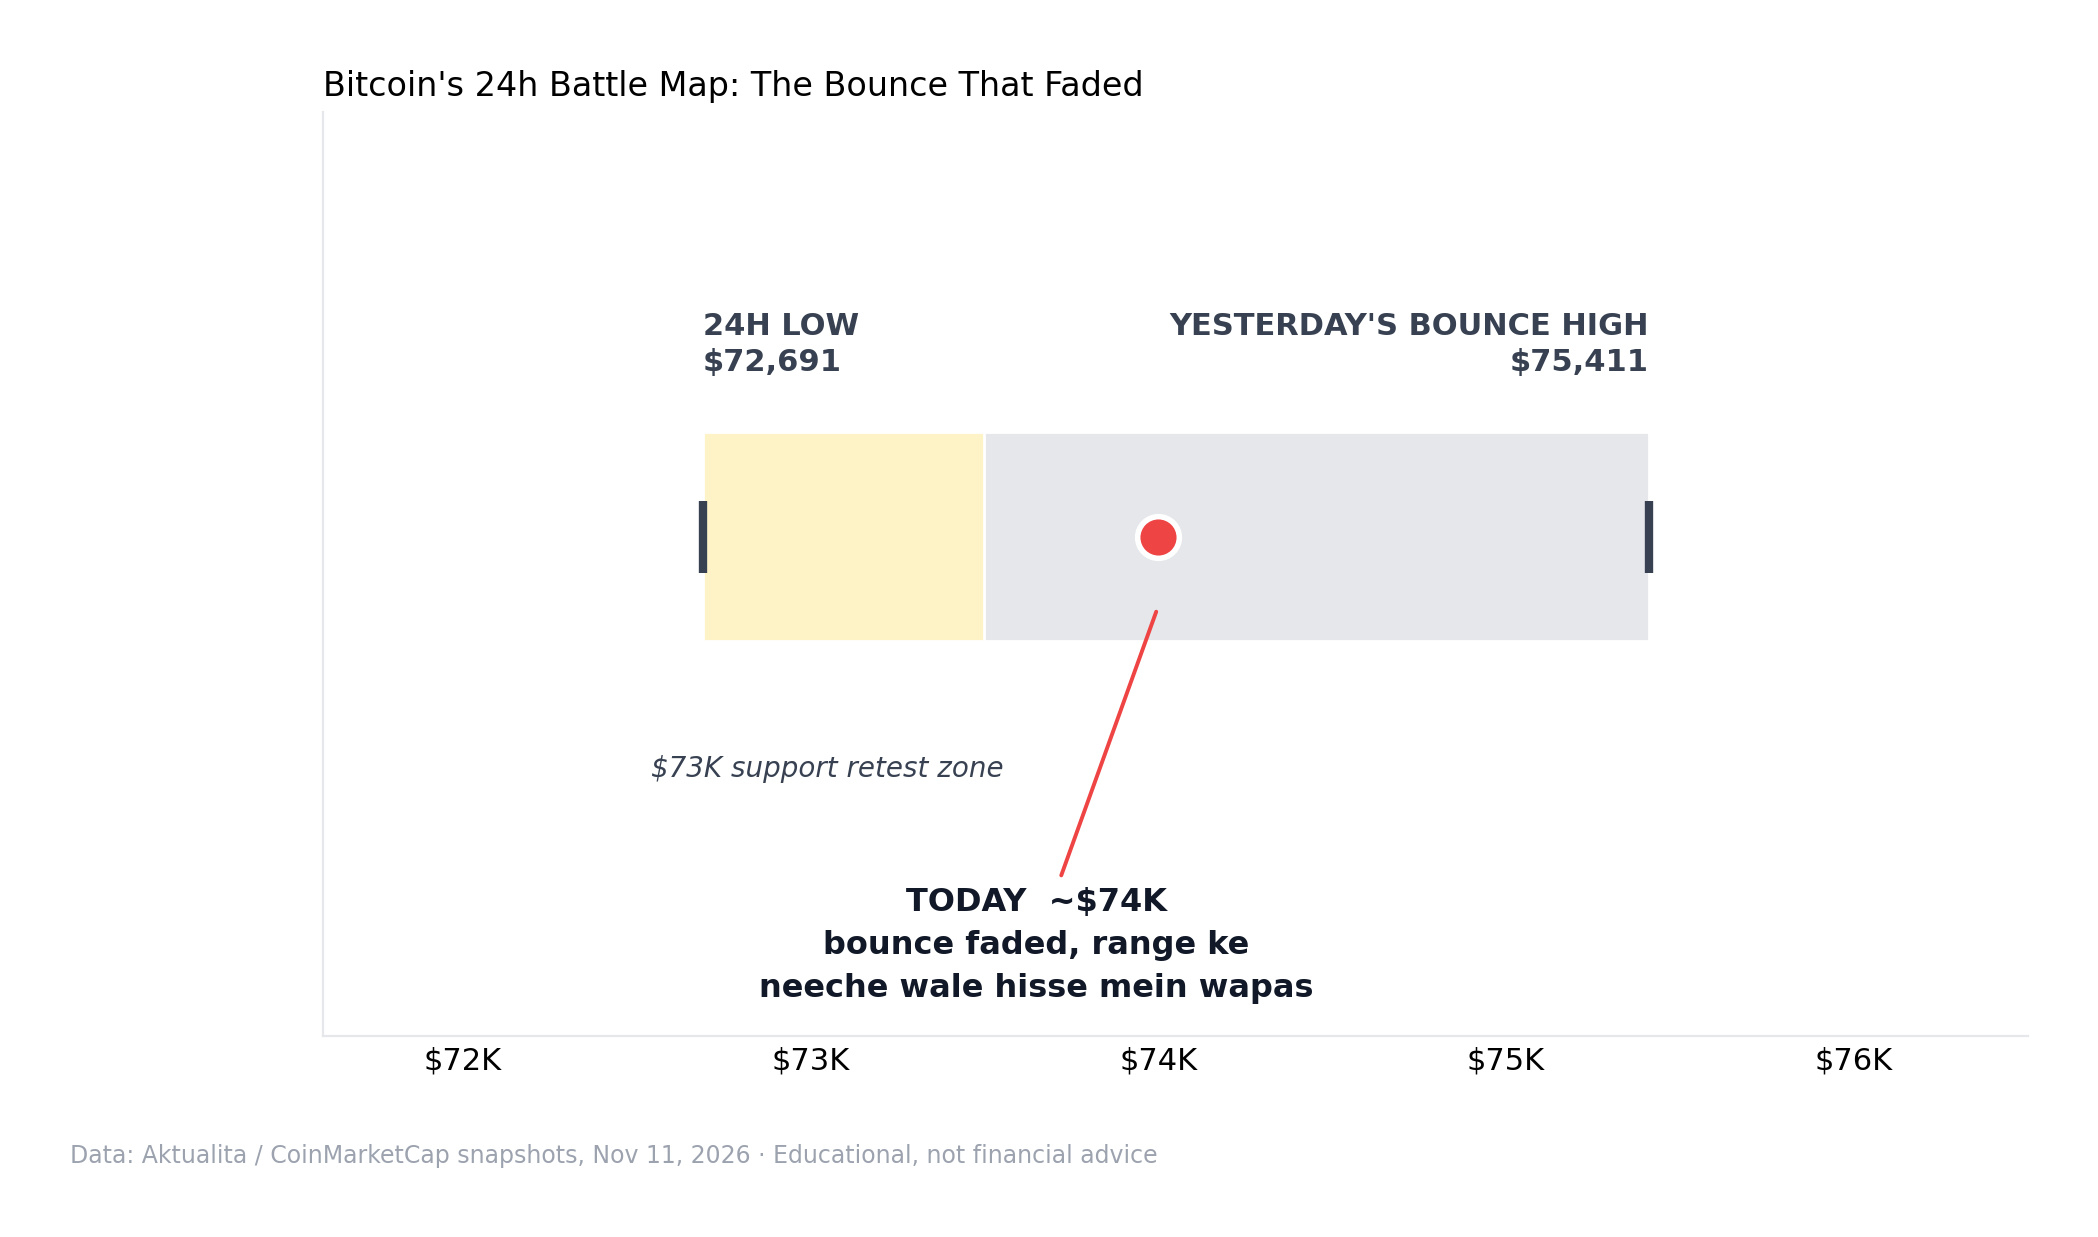
📍 BTC’s 24h battle map — where the bounce happened and where it faded.
On the chart:
1️⃣ 24h range: $72,691 (low) → $75,411 (high)
2️⃣ Yesterday’s bounce reached $75.4K, then dropped back down
3️⃣ Price is currently ~$74K — in the lower part of the range
4️⃣ The $73K zone has become a "retest area" again
The range map is a context tool: it shows where price moved from and to, and where it stands now. It doesn’t give a signal — but without context, every move looks like a "breakout" or a "breakdown."
Context first, reaction later. 🗺️
$BTC
#Bitcoin #ChartAnalysis #CryptoMarket
📍 BTC’s 24h battle map — where the bounce happened and where it faded.
On the chart:
1️⃣ 24h range: $72,691 (low) → $75,411 (high)
2️⃣ Yesterday’s bounce reached $75.4K, then dropped back down
3️⃣ Price is currently ~$74K — in the lower part of the range
4️⃣ The $73K zone has become a "retest area" again
The range map is a context tool: it shows where price moved from and to, and where it stands now. It doesn’t give a signal — but without context, every move looks like a "breakout" or a "breakdown."
Context first, reaction later. 🗺️
$BTC
#Bitcoin #ChartAnalysis #CryptoMarket
On the chart:
1️⃣ 24h range: $72,691 (low) → $75,411 (high)
2️⃣ Yesterday’s bounce reached $75.4K, then dropped back down
3️⃣ Price is currently ~$74K — in the lower part of the range
4️⃣ The $73K zone has become a "retest area" again
The range map is a context tool: it shows where price moved from and to, and where it stands now. It doesn’t give a signal — but without context, every move looks like a "breakout" or a "breakdown."
Context first, reaction later. 🗺️
$BTC
#Bitcoin #ChartAnalysis #CryptoMarket
4

·
--
🚨 TRUMP COIN: WHAT DOES THIS CHART REALLY TELL US?
Forget the usual price predictions. Let's read the story behind the candles. 👀
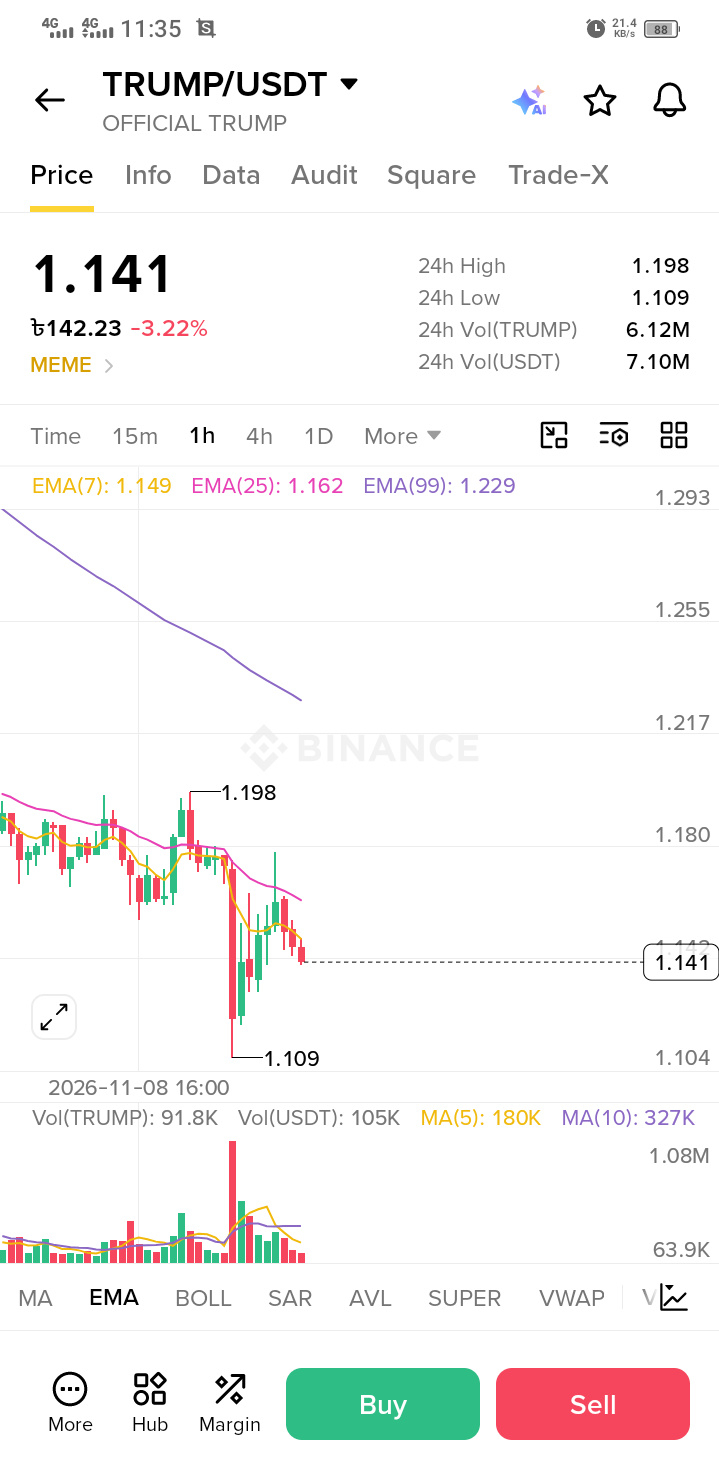
Look closely at the TRUMP/USDT 1H chart.
📉 THE CLUES:
🔴 Price: $1.141
🔻 24H Change: -3.22%
📍 24H High: $1.198
📍 24H Low: $1.109
But here's what makes this chart interesting:
1️⃣ A noticeable volume spike appeared during the sharp downward move.
2️⃣ Price attempted a recovery after reaching $1.109.
3️⃣ The recovery struggled to move above the EMA 25.
4️⃣ EMA 7 ($1.149), EMA 25 ($1.162), and EMA 99 ($1.229) are all above the current price.
🧠 THE BIG QUESTION
A sudden volume spike during a price decline can have different explanations.
It may reflect increased selling activity, liquidations, or other market activity. Volume alone cannot tell us exactly what happened.
🎯 COMMUNITY QUIZ
Which observation do you find most important?
A) The sudden volume spike
B) The failed recovery
C) Price staying below all three EMAs
D) The overall downward structure
👇 Drop your answer (A, B, C, or D) and explain WHY!
Let's learn to read charts instead of blindly following predictions.
— BLOCK ZENITH
#TRUMP #CryptoEducation #ChartAnalysis #MemeCoins #BlockZenith
$BTC $TRUMP
🚨 TRUMP COIN: WHAT DOES THIS CHART REALLY TELL US?
Forget the usual price predictions. Let's read the story behind the candles. 👀
Look closely at the TRUMP/USDT 1H chart.
📉 THE CLUES:
🔴 Price: $1.141
🔻 24H Change: -3.22%
📍 24H High: $1.198
📍 24H Low: $1.109
But here's what makes this chart interesting:
1️⃣ A noticeable volume spike appeared during the sharp downward move.
2️⃣ Price attempted a recovery after reaching $1.109.
3️⃣ The recovery struggled to move above the EMA 25.
4️⃣ EMA 7 ($1.149), EMA 25 ($1.162), and EMA 99 ($1.229) are all above the current price.
🧠 THE BIG QUESTION
A sudden volume spike during a price decline can have different explanations.
It may reflect increased selling activity, liquidations, or other market activity. Volume alone cannot tell us exactly what happened.
🎯 COMMUNITY QUIZ
Which observation do you find most important?
A) The sudden volume spike
B) The failed recovery
C) Price staying below all three EMAs
D) The overall downward structure
👇 Drop your answer (A, B, C, or D) and explain WHY!
Let's learn to read charts instead of blindly following predictions.
— BLOCK ZENITH
#TRUMP #CryptoEducation #ChartAnalysis #MemeCoins #BlockZenith
$BTC $TRUMP
Forget the usual price predictions. Let's read the story behind the candles. 👀
Look closely at the TRUMP/USDT 1H chart.
📉 THE CLUES:
🔴 Price: $1.141
🔻 24H Change: -3.22%
📍 24H High: $1.198
📍 24H Low: $1.109
But here's what makes this chart interesting:
1️⃣ A noticeable volume spike appeared during the sharp downward move.
2️⃣ Price attempted a recovery after reaching $1.109.
3️⃣ The recovery struggled to move above the EMA 25.
4️⃣ EMA 7 ($1.149), EMA 25 ($1.162), and EMA 99 ($1.229) are all above the current price.
🧠 THE BIG QUESTION
A sudden volume spike during a price decline can have different explanations.
It may reflect increased selling activity, liquidations, or other market activity. Volume alone cannot tell us exactly what happened.
🎯 COMMUNITY QUIZ
Which observation do you find most important?
A) The sudden volume spike
B) The failed recovery
C) Price staying below all three EMAs
D) The overall downward structure
👇 Drop your answer (A, B, C, or D) and explain WHY!
Let's learn to read charts instead of blindly following predictions.
— BLOCK ZENITH
#TRUMP #CryptoEducation #ChartAnalysis #MemeCoins #BlockZenith
$BTC $TRUMP
239

241M USDT Traded. $ARIA is Building a Major Launchpad. 🚀
{future}(ARIAUSDT)
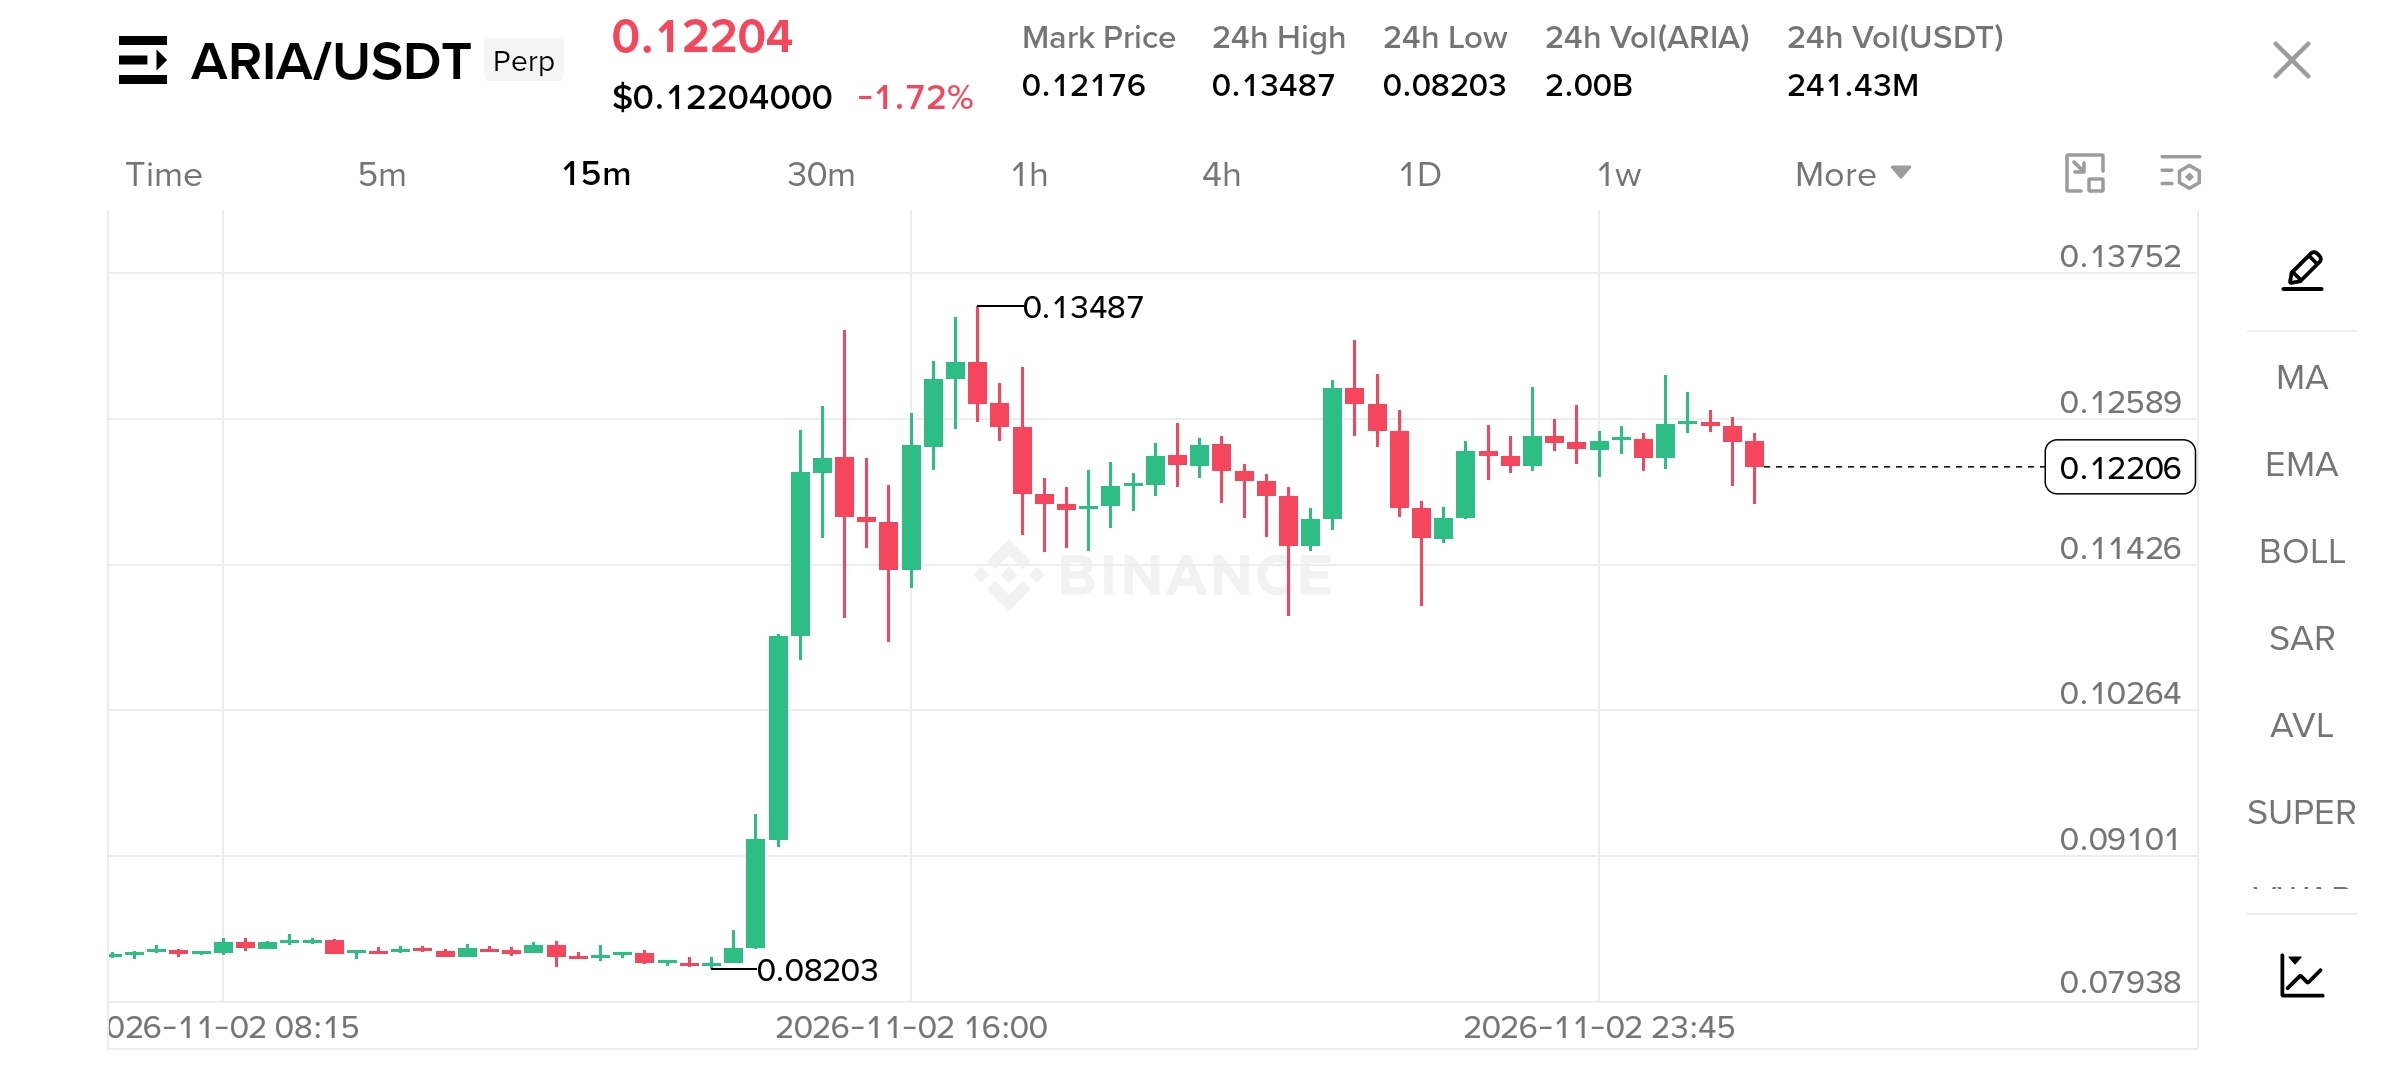
Look at the volume on this 15m chart. Over 2 Billion ARIA traded in 24 hours. When this kind of liquidity enters, it creates incredible opportunities for traders.
Here is the structural breakdown:
📈 The Blueprint:
• The Expansion: Price exploded from a tight base at 0.08203 straight to a 24h high of 0.13487. Massive momentum.
• The Reset: Instead of giving back the gains, ARIA is holding incredibly strong. It’s currently resting at 0.12204, consolidating perfectly above the psychological 0.12 level.
• The Setup: This tight range is building a launchpad. The market is digesting the big move, and the structure remains highly bullish.
🎯 Key Levels for the Next Move:
• The Trigger: A clean breakout and hold above 0.12589 (the recent local highs).
• The Support: Buyers are aggressively defending the 0.11426 zone. As long as this floor holds, the trend is healthy.
• The Target: Reclaiming the 0.126 level opens the path to revisit the 0.134 highs.
ARIA is showing textbook consolidation after a major expansion. The volume is here, the structure is clean, and the momentum is waiting.
Are you playing the breakout or the support bounce? 👇
$ARIA #cryptouniverseofficial #FuturesTradingPakistan #ChartAnalysis
241M USDT Traded. $ARIA is Building a Major Launchpad. 🚀
Look at the volume on this 15m chart. Over 2 Billion ARIA traded in 24 hours. When this kind of liquidity enters, it creates incredible opportunities for traders.
Here is the structural breakdown:
📈 The Blueprint:
• The Expansion: Price exploded from a tight base at 0.08203 straight to a 24h high of 0.13487. Massive momentum.
• The Reset: Instead of giving back the gains, ARIA is holding incredibly strong. It’s currently resting at 0.12204, consolidating perfectly above the psychological 0.12 level.
• The Setup: This tight range is building a launchpad. The market is digesting the big move, and the structure remains highly bullish.
🎯 Key Levels for the Next Move:
• The Trigger: A clean breakout and hold above 0.12589 (the recent local highs).
• The Support: Buyers are aggressively defending the 0.11426 zone. As long as this floor holds, the trend is healthy.
• The Target: Reclaiming the 0.126 level opens the path to revisit the 0.134 highs.
ARIA is showing textbook consolidation after a major expansion. The volume is here, the structure is clean, and the momentum is waiting.
Are you playing the breakout or the support bounce? 👇
$ARIA #cryptouniverseofficial #FuturesTradingPakistan #ChartAnalysis
Look at the volume on this 15m chart. Over 2 Billion ARIA traded in 24 hours. When this kind of liquidity enters, it creates incredible opportunities for traders.
Here is the structural breakdown:
📈 The Blueprint:
• The Expansion: Price exploded from a tight base at 0.08203 straight to a 24h high of 0.13487. Massive momentum.
• The Reset: Instead of giving back the gains, ARIA is holding incredibly strong. It’s currently resting at 0.12204, consolidating perfectly above the psychological 0.12 level.
• The Setup: This tight range is building a launchpad. The market is digesting the big move, and the structure remains highly bullish.
🎯 Key Levels for the Next Move:
• The Trigger: A clean breakout and hold above 0.12589 (the recent local highs).
• The Support: Buyers are aggressively defending the 0.11426 zone. As long as this floor holds, the trend is healthy.
• The Target: Reclaiming the 0.126 level opens the path to revisit the 0.134 highs.
ARIA is showing textbook consolidation after a major expansion. The volume is here, the structure is clean, and the momentum is waiting.
Are you playing the breakout or the support bounce? 👇
$ARIA #cryptouniverseofficial #FuturesTradingPakistan #ChartAnalysis
1
6
·
--
Bullish
{future}(LYNUSDT)
136M USDT in Volume. $LYN is Giving Traders a Masterclass in Liquidity. 📊
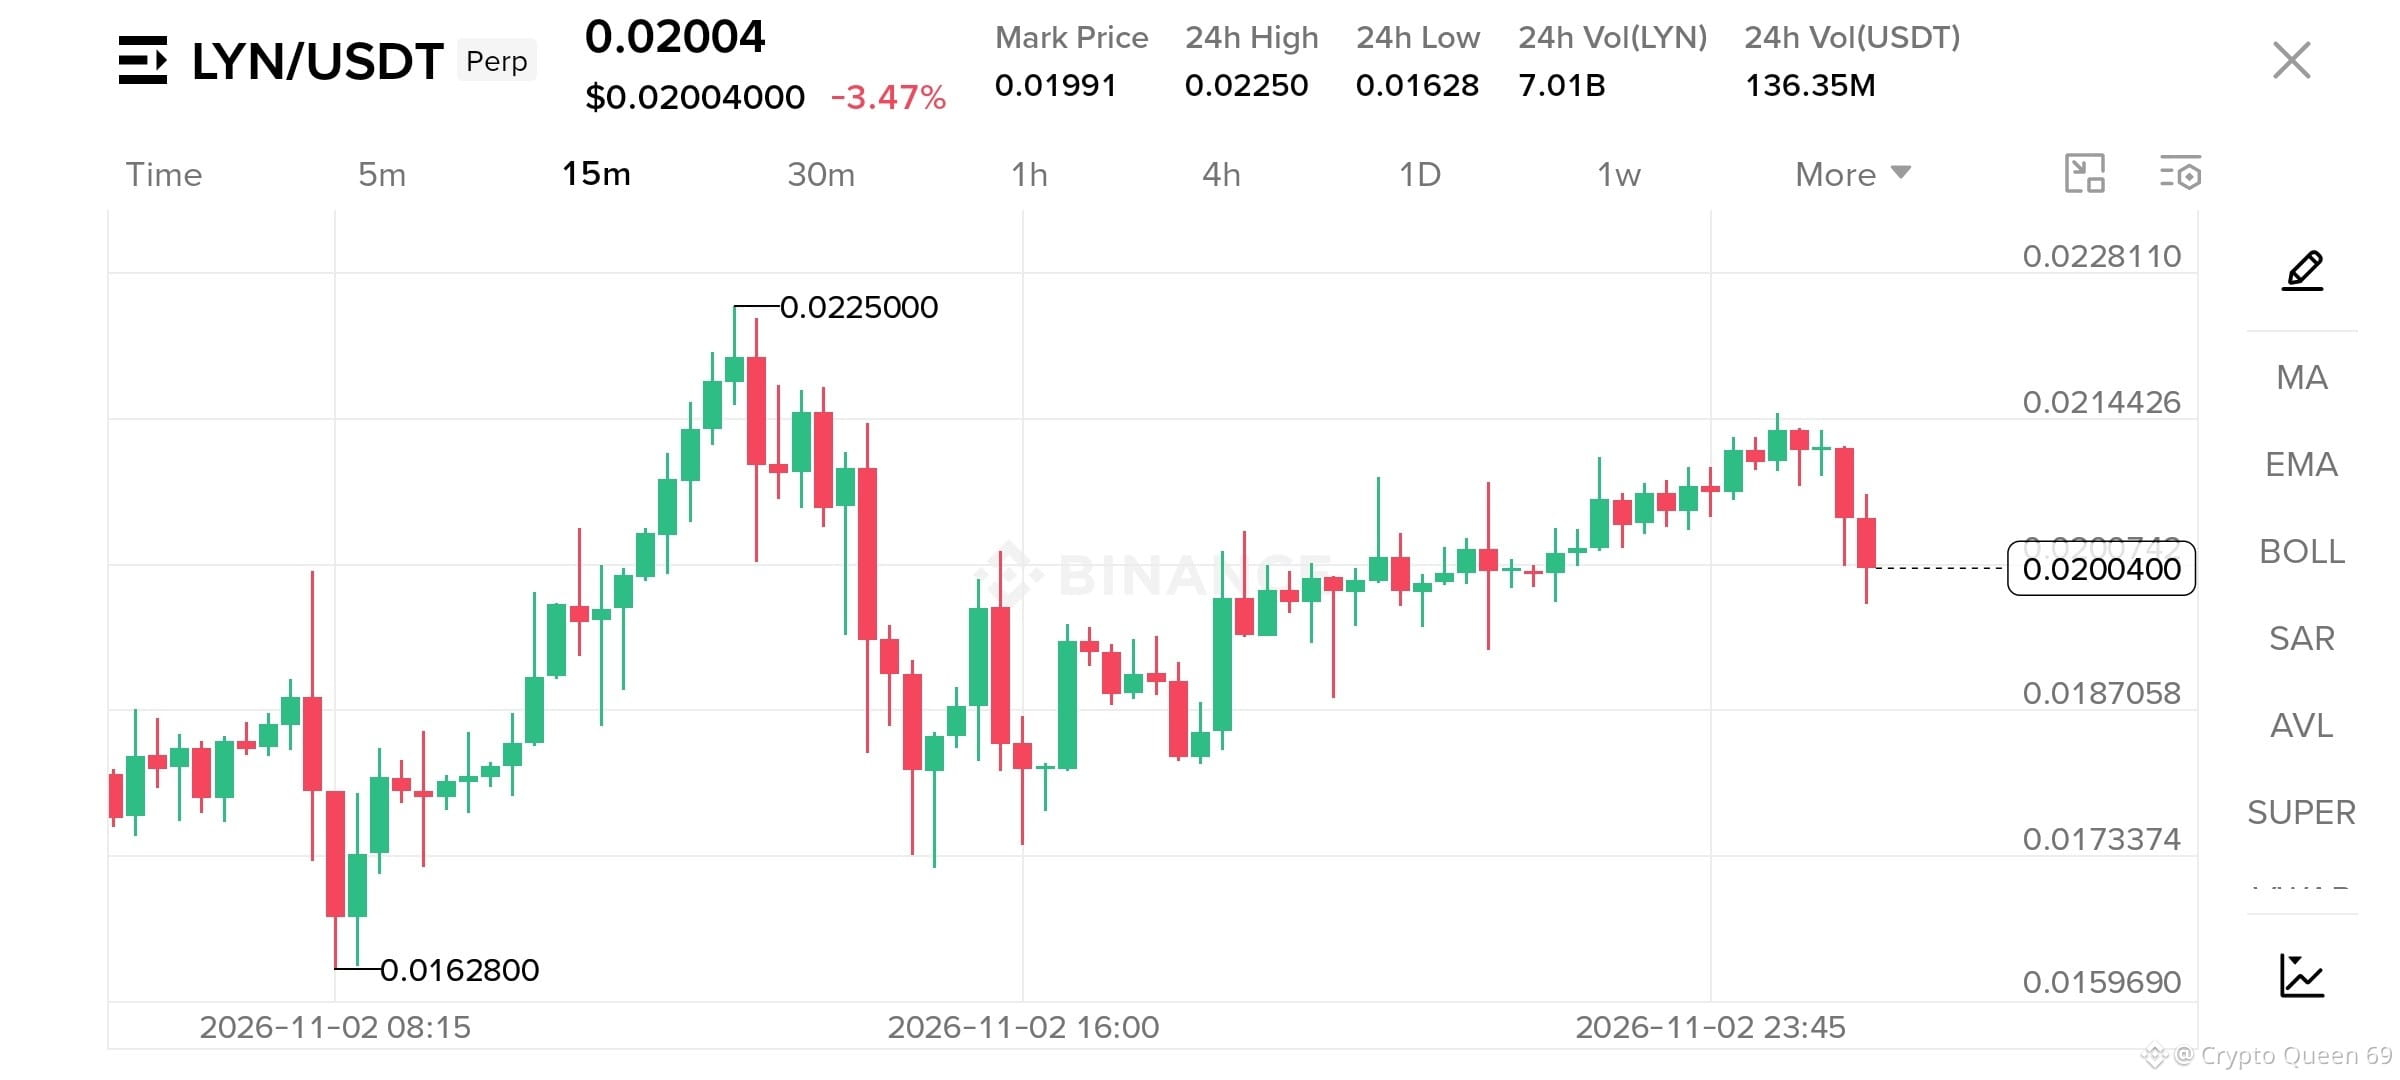
Look at the metrics on this 15m chart. Over 7 Billion LYN traded in the last 24 hours. This is exactly where active traders want to be.
Here is the structural breakdown:
📈 The Blueprint:
• The Range: Price formed a perfect base at 0.01628, expanded aggressively to a 24h high of 0.02250, and is now establishing clear market structure.
• The Recovery: Buyers stepped in beautifully on the reset, creating a strong higher low around 0.0173 and pushing back up to 0.0215.
• Current Action: Price is actively testing the psychological 0.0200 level.
🎯 Key Levels to Watch:
• Support Zone: 0.0187 – 0.0190. This is the critical higher-low area where b
uyers have consistently shown up to defend the trend.
• Resistance Zone: 0.0215 (recent swing high), followed by the 0.0225 peak.
With this level of volume and liquidity, the market is highly active. A clean bounce off this 0.0200 psychological zone opens the door to a fresh test of the recent highs.
How are you mapping out your trades on LYN today? 👇
$LYN #cryptouniverseofficial #FuturesTradingPakistan #ChartAnalysis
136M USDT in Volume. $LYN is Giving Traders a Masterclass in Liquidity. 📊
Look at the metrics on this 15m chart. Over 7 Billion LYN traded in the last 24 hours. This is exactly where active traders want to be.
Here is the structural breakdown:
📈 The Blueprint:
• The Range: Price formed a perfect base at 0.01628, expanded aggressively to a 24h high of 0.02250, and is now establishing clear market structure.
• The Recovery: Buyers stepped in beautifully on the reset, creating a strong higher low around 0.0173 and pushing back up to 0.0215.
• Current Action: Price is actively testing the psychological 0.0200 level.
🎯 Key Levels to Watch:
• Support Zone: 0.0187 – 0.0190. This is the critical higher-low area where b
uyers have consistently shown up to defend the trend.
• Resistance Zone: 0.0215 (recent swing high), followed by the 0.0225 peak.
With this level of volume and liquidity, the market is highly active. A clean bounce off this 0.0200 psychological zone opens the door to a fresh test of the recent highs.
How are you mapping out your trades on LYN today? 👇
$LYN #cryptouniverseofficial #FuturesTradingPakistan #ChartAnalysis
136M USDT in Volume. $LYN is Giving Traders a Masterclass in Liquidity. 📊
Look at the metrics on this 15m chart. Over 7 Billion LYN traded in the last 24 hours. This is exactly where active traders want to be.
Here is the structural breakdown:
📈 The Blueprint:
• The Range: Price formed a perfect base at 0.01628, expanded aggressively to a 24h high of 0.02250, and is now establishing clear market structure.
• The Recovery: Buyers stepped in beautifully on the reset, creating a strong higher low around 0.0173 and pushing back up to 0.0215.
• Current Action: Price is actively testing the psychological 0.0200 level.
🎯 Key Levels to Watch:
• Support Zone: 0.0187 – 0.0190. This is the critical higher-low area where b
uyers have consistently shown up to defend the trend.
• Resistance Zone: 0.0215 (recent swing high), followed by the 0.0225 peak.
With this level of volume and liquidity, the market is highly active. A clean bounce off this 0.0200 psychological zone opens the door to a fresh test of the recent highs.
How are you mapping out your trades on LYN today? 👇
$LYN #cryptouniverseofficial #FuturesTradingPakistan #ChartAnalysis
1
9
·
--
Bullish
$EVAA 🚀
Strong Trend + Perfect Reset = Prime Opportunity. 🚀
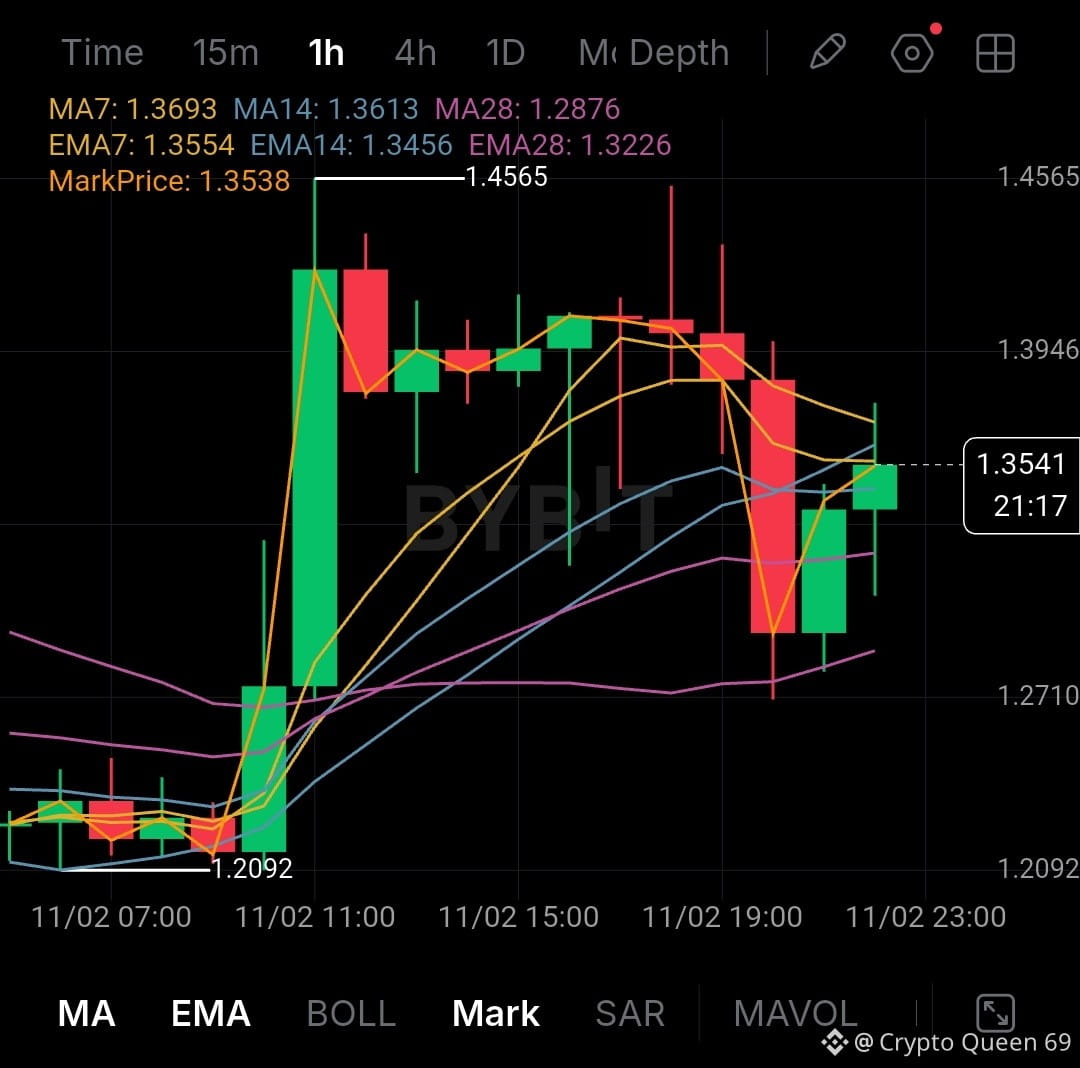
This 1H chart is showing a beautiful structural setup. Here is the blueprint for the next move:
📈 The Expansion: Price had a massive impulse wave, expanding perfectly from 1.2092 all the way to 1.4565.
🛡️ The Support: After that run, the market took a healthy breather, testing the MA28 at 1.2876 and finding instant buyers. This created a gorgeous higher low, confirming the trend remains strong.
⚔️ The Setup: Price is currently pushing forward at 1.3538, testing the short-term moving averages.
The Target Level:
Watch for a clean 1H close above the MA7 at 1.3693. Once bulls flip that level into fresh support, the path is wide open to revisit the 1.45 highs.
The structure is clean, buyers are present, and the upside is open.
Are you watching this breakout? 👇
#crypto #FuturesTrading #ChartAnalysis
$EVAA 🚀
Strong Trend + Perfect Reset = Prime Opportunity. 🚀
This 1H chart is showing a beautiful structural setup. Here is the blueprint for the next move:
📈 The Expansion: Price had a massive impulse wave, expanding perfectly from 1.2092 all the way to 1.4565.
🛡️ The Support: After that run, the market took a healthy breather, testing the MA28 at 1.2876 and finding instant buyers. This created a gorgeous higher low, confirming the trend remains strong.
⚔️ The Setup: Price is currently pushing forward at 1.3538, testing the short-term moving averages.
The Target Level:
Watch for a clean 1H close above the MA7 at 1.3693. Once bulls flip that level into fresh support, the path is wide open to revisit the 1.45 highs.
The structure is clean, buyers are present, and the upside is open.
Are you watching this breakout? 👇
#crypto #FuturesTrading #ChartAnalysis
Strong Trend + Perfect Reset = Prime Opportunity. 🚀
This 1H chart is showing a beautiful structural setup. Here is the blueprint for the next move:
📈 The Expansion: Price had a massive impulse wave, expanding perfectly from 1.2092 all the way to 1.4565.
🛡️ The Support: After that run, the market took a healthy breather, testing the MA28 at 1.2876 and finding instant buyers. This created a gorgeous higher low, confirming the trend remains strong.
⚔️ The Setup: Price is currently pushing forward at 1.3538, testing the short-term moving averages.
The Target Level:
Watch for a clean 1H close above the MA7 at 1.3693. Once bulls flip that level into fresh support, the path is wide open to revisit the 1.45 highs.
The structure is clean, buyers are present, and the upside is open.
Are you watching this breakout? 👇
#crypto #FuturesTrading #ChartAnalysis
1
19

Read a Chart Like a Pro
📊 Charts look confusing? Learn them in 5 simple steps!
• Start with the trend higher highs or lower lows?
• Mark support and resistance.
• Watch volume real moves always come with volume.
• Use 2–3 indicators maximum not twenty.
• Wait for confirmation never guess the next candle.
💾 Save this for your next trade. 🔔 Follow Ameliaa Crypto for daily chart lessons!
#CryptoTrading #ChartAnalysis #Bitcoin #TechnicalAnalysis #write2Earn
Read a Chart Like a Pro
📊 Charts look confusing? Learn them in 5 simple steps!
• Start with the trend higher highs or lower lows?
• Mark support and resistance.
• Watch volume real moves always come with volume.
• Use 2–3 indicators maximum not twenty.
• Wait for confirmation never guess the next candle.
💾 Save this for your next trade. 🔔 Follow Ameliaa Crypto for daily chart lessons!
#CryptoTrading #ChartAnalysis #Bitcoin #TechnicalAnalysis #write2Earn
📊 Charts look confusing? Learn them in 5 simple steps!
• Start with the trend higher highs or lower lows?
• Mark support and resistance.
• Watch volume real moves always come with volume.
• Use 2–3 indicators maximum not twenty.
• Wait for confirmation never guess the next candle.
💾 Save this for your next trade. 🔔 Follow Ameliaa Crypto for daily chart lessons!
#CryptoTrading #ChartAnalysis #Bitcoin #TechnicalAnalysis #write2Earn
76

$SHELL | Understanding Bollinger Bands
A technical estimate around October 27 placed the daily Bollinger Bands near $0.0207, $0.0224, and 0.0242 for the lower, middle, and upper bands respectively.
These levels describe volatility rather than guaranteed price boundaries. Breakouts still require context and confirmation.
#BollingerBands #Volatility #ChartAnalysis
$SHELL | Understanding Bollinger Bands
A technical estimate around October 27 placed the daily Bollinger Bands near $0.0207, $0.0224, and 0.0242 for the lower, middle, and upper bands respectively.
These levels describe volatility rather than guaranteed price boundaries. Breakouts still require context and confirmation.
#BollingerBands #Volatility #ChartAnalysis
A technical estimate around October 27 placed the daily Bollinger Bands near $0.0207, $0.0224, and 0.0242 for the lower, middle, and upper bands respectively.
These levels describe volatility rather than guaranteed price boundaries. Breakouts still require context and confirmation.
#BollingerBands #Volatility #ChartAnalysis

13

🚀 $NEAR SNEAKING THROUGH CHOP ZONE WITH LIQUIDITY SWEEP POTENTIAL 🦈
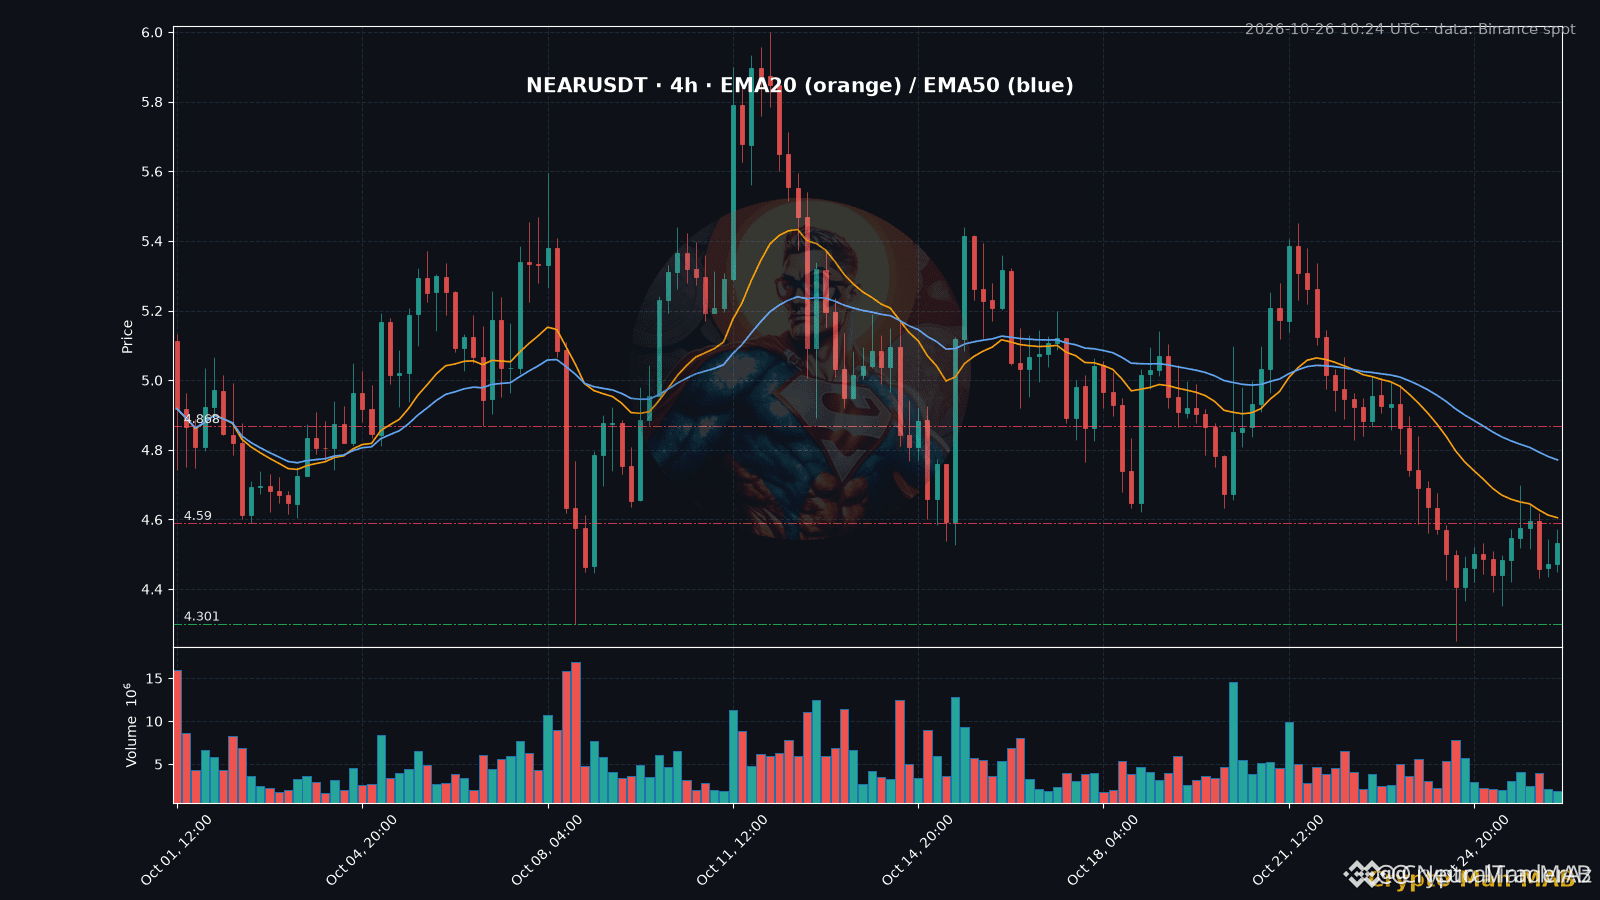
📊 After a 20% plunge from $5.45 to $4.25 in three days, $NEAR now oscillates between $4.43 – $4.70, still hugging the 4H EMAs. The 20‑EMA sits near $4.60, repeatedly capping each bounce and forcing the price to respect the $4.70 ceiling. 📌 A clean 4H close above that line would unlock the next order block around $4.87, while a break back through $4.43 could reignite a test of the $4.25 low.
💬 Are you holding $NEAR or waiting for the next liquidity sweep? 👇
⚠️ Not financial advice. Always manage your risk. 🛡️
🏷️ #NEAR #Altcoin #LiquiditySweep #ChartAnalysis
🦈 🚀
🚀 $NEAR SNEAKING THROUGH CHOP ZONE WITH LIQUIDITY SWEEP POTENTIAL 🦈
📊 After a 20% plunge from $5.45 to $4.25 in three days, $NEAR now oscillates between $4.43 – $4.70, still hugging the 4H EMAs. The 20‑EMA sits near $4.60, repeatedly capping each bounce and forcing the price to respect the $4.70 ceiling. 📌 A clean 4H close above that line would unlock the next order block around $4.87, while a break back through $4.43 could reignite a test of the $4.25 low.
💬 Are you holding $NEAR or waiting for the next liquidity sweep? 👇
⚠️ Not financial advice. Always manage your risk. 🛡️
🏷️ #NEAR #Altcoin #LiquiditySweep #ChartAnalysis
🦈 🚀
📊 After a 20% plunge from $5.45 to $4.25 in three days, $NEAR now oscillates between $4.43 – $4.70, still hugging the 4H EMAs. The 20‑EMA sits near $4.60, repeatedly capping each bounce and forcing the price to respect the $4.70 ceiling. 📌 A clean 4H close above that line would unlock the next order block around $4.87, while a break back through $4.43 could reignite a test of the $4.25 low.
💬 Are you holding $NEAR or waiting for the next liquidity sweep? 👇
⚠️ Not financial advice. Always manage your risk. 🛡️
🏷️ #NEAR #Altcoin #LiquiditySweep #ChartAnalysis
🦈 🚀
9

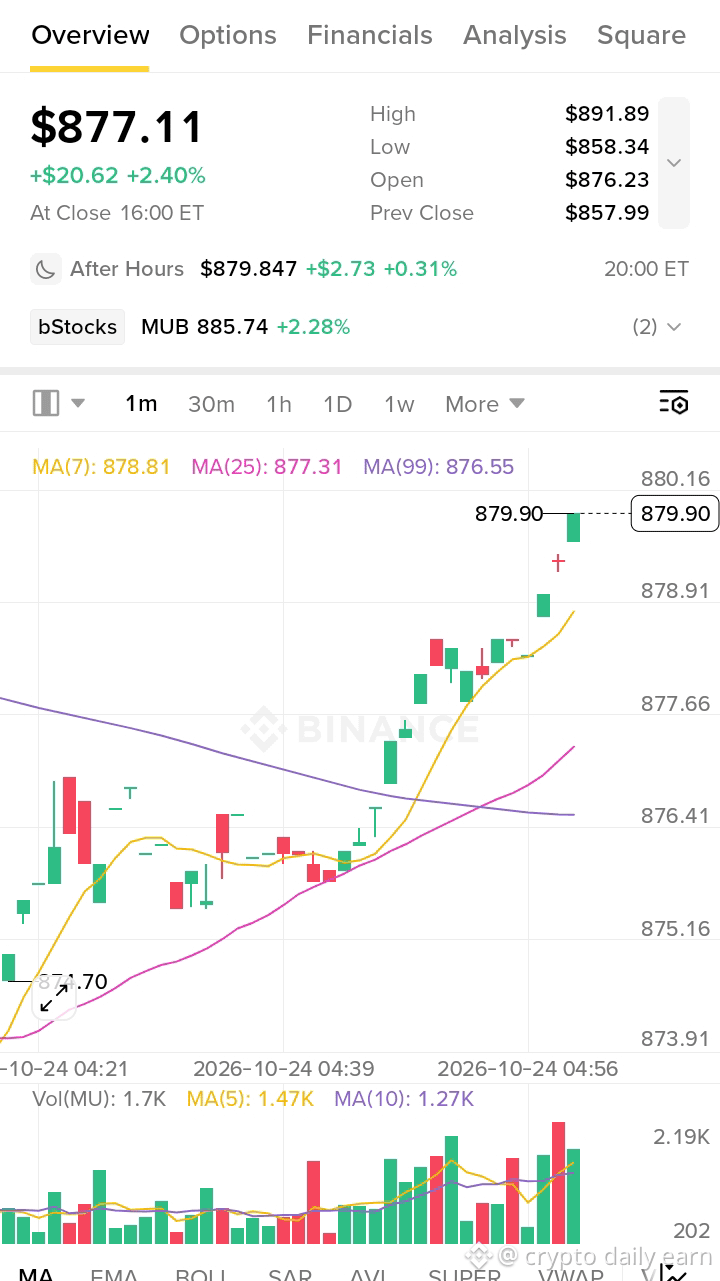
📊 $MU Chart Update | 1-Min Momentum Check
MA(7) | MA(25) | MA(99) - Price is riding above all MAs
Volume spike visible
This is for education only, not financial advice.
Tum kya soch rahe ho is move pe? 👇
#MU #Micron #Stocks #Trading #Binance #ChartAnalysis
📊 $MU Chart Update | 1-Min Momentum Check
MA(7) | MA(25) | MA(99) - Price is riding above all MAs
Volume spike visible
This is for education only, not financial advice.
Tum kya soch rahe ho is move pe? 👇
#MU #Micron #Stocks #Trading #Binance #ChartAnalysis
MA(7) | MA(25) | MA(99) - Price is riding above all MAs
Volume spike visible
This is for education only, not financial advice.
Tum kya soch rahe ho is move pe? 👇
#MU #Micron #Stocks #Trading #Binance #ChartAnalysis
1
1
200

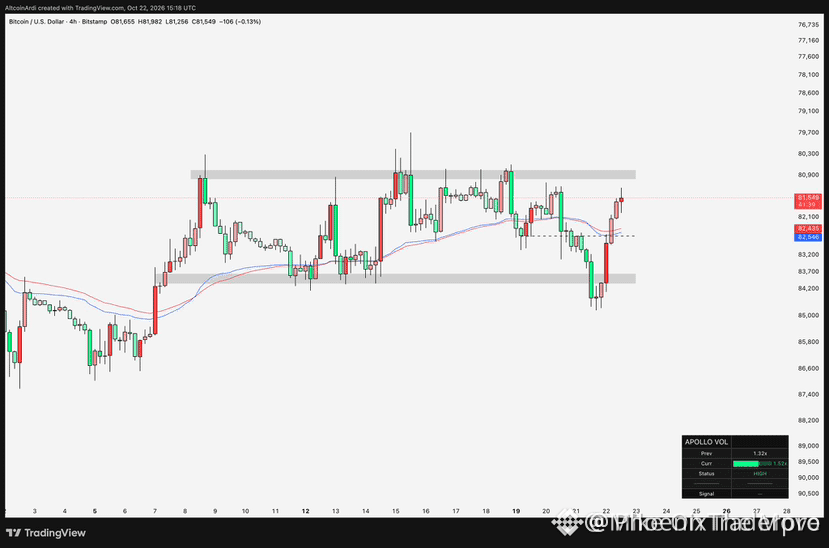
🚀 $BTC FLIPPED VIEW REVEALS HIDDEN BULLISH SURGE 🟢
📊 Turning the chart upside‑down strips away the noise, exposing a clean ascending wedge that’s been silently feeding liquidity to the longs. ⚡ The volume profile spikes right where the inverted trendline meets the 4‑hour swing low, a classic smart‑money grab that often precedes a breakout. 💡 With the order flow now pointing upward, buyers are reclaiming control faster than the bears can regroup.
💬 How are you positioning for the next leg now that the perspective has shifted? 👇
⚠️ Not financial advice. Always manage your risk. 🛡️
🏷️ #BTC #ChartAnalysis #Bullish #Crypto
🔥 💎
🚀 $BTC FLIPPED VIEW REVEALS HIDDEN BULLISH SURGE 🟢
📊 Turning the chart upside‑down strips away the noise, exposing a clean ascending wedge that’s been silently feeding liquidity to the longs. ⚡ The volume profile spikes right where the inverted trendline meets the 4‑hour swing low, a classic smart‑money grab that often precedes a breakout. 💡 With the order flow now pointing upward, buyers are reclaiming control faster than the bears can regroup.
💬 How are you positioning for the next leg now that the perspective has shifted? 👇
⚠️ Not financial advice. Always manage your risk. 🛡️
🏷️ #BTC #ChartAnalysis #Bullish #Crypto
🔥 💎
📊 Turning the chart upside‑down strips away the noise, exposing a clean ascending wedge that’s been silently feeding liquidity to the longs. ⚡ The volume profile spikes right where the inverted trendline meets the 4‑hour swing low, a classic smart‑money grab that often precedes a breakout. 💡 With the order flow now pointing upward, buyers are reclaiming control faster than the bears can regroup.
💬 How are you positioning for the next leg now that the perspective has shifted? 👇
⚠️ Not financial advice. Always manage your risk. 🛡️
🏷️ #BTC #ChartAnalysis #Bullish #Crypto
🔥 💎
13

·
--
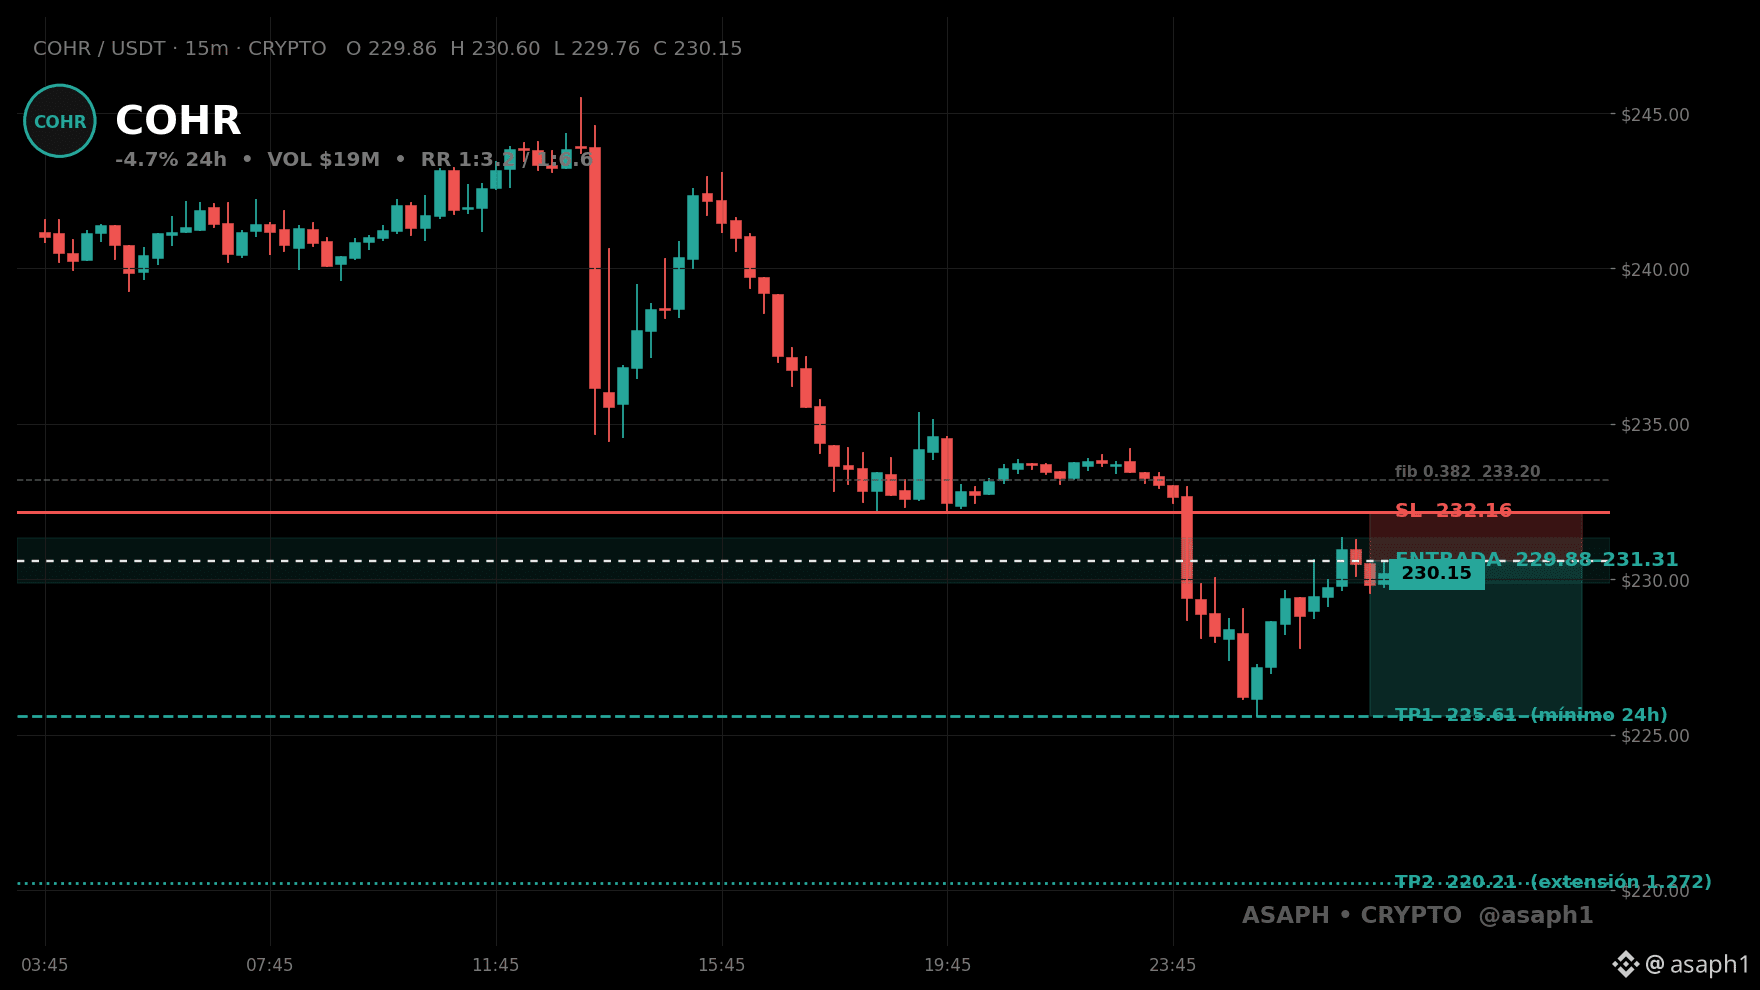
COHR is losing levels that used to be a breeze 🧨
Down 4.7% on $19M. $229.9–$231.3 gave way after 8 attempts to defend it, and the price never looked back. When levels fall without a fight, the structure is coming apart from the inside.
$225.6 below is the next area where the price could seek a new equilibrium. Every lost level tends to become resistance.
Reclaiming $232.2 and holding it would be heroic. Until then, the path points south.
What’s the next level COHR loses? $COHR
#Scalping #ChartAnalysis #Momentum
COHR is losing levels that used to be a breeze 🧨
Down 4.7% on $19M. $229.9–$231.3 gave way after 8 attempts to defend it, and the price never looked back. When levels fall without a fight, the structure is coming apart from the inside.
$225.6 below is the next area where the price could seek a new equilibrium. Every lost level tends to become resistance.
Reclaiming $232.2 and holding it would be heroic. Until then, the path points south.
What’s the next level COHR loses? $COHR
#Scalping #ChartAnalysis #Momentum
Down 4.7% on $19M. $229.9–$231.3 gave way after 8 attempts to defend it, and the price never looked back. When levels fall without a fight, the structure is coming apart from the inside.
$225.6 below is the next area where the price could seek a new equilibrium. Every lost level tends to become resistance.
Reclaiming $232.2 and holding it would be heroic. Until then, the path points south.
What’s the next level COHR loses? $COHR
#Scalping #ChartAnalysis #Momentum
128

·
--
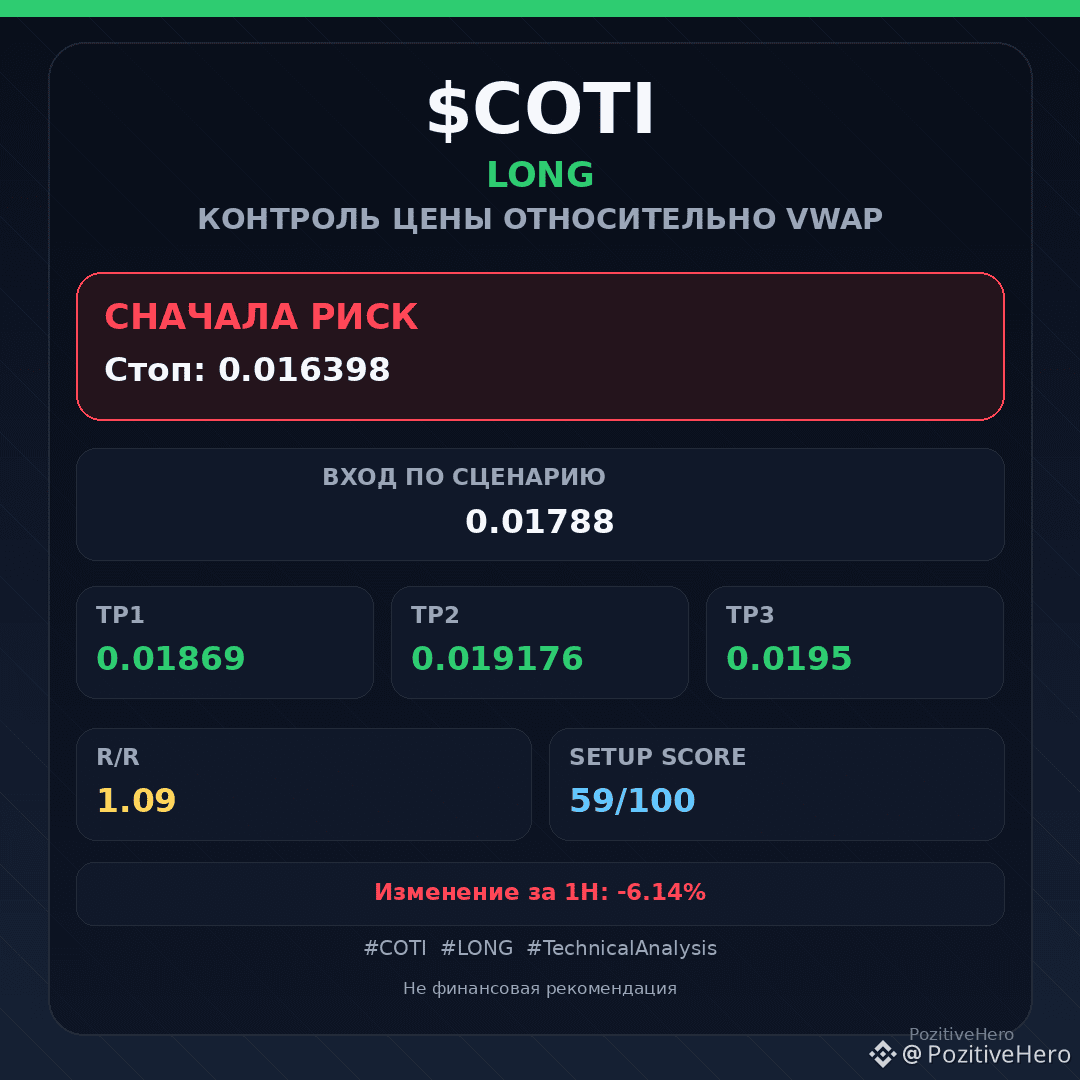
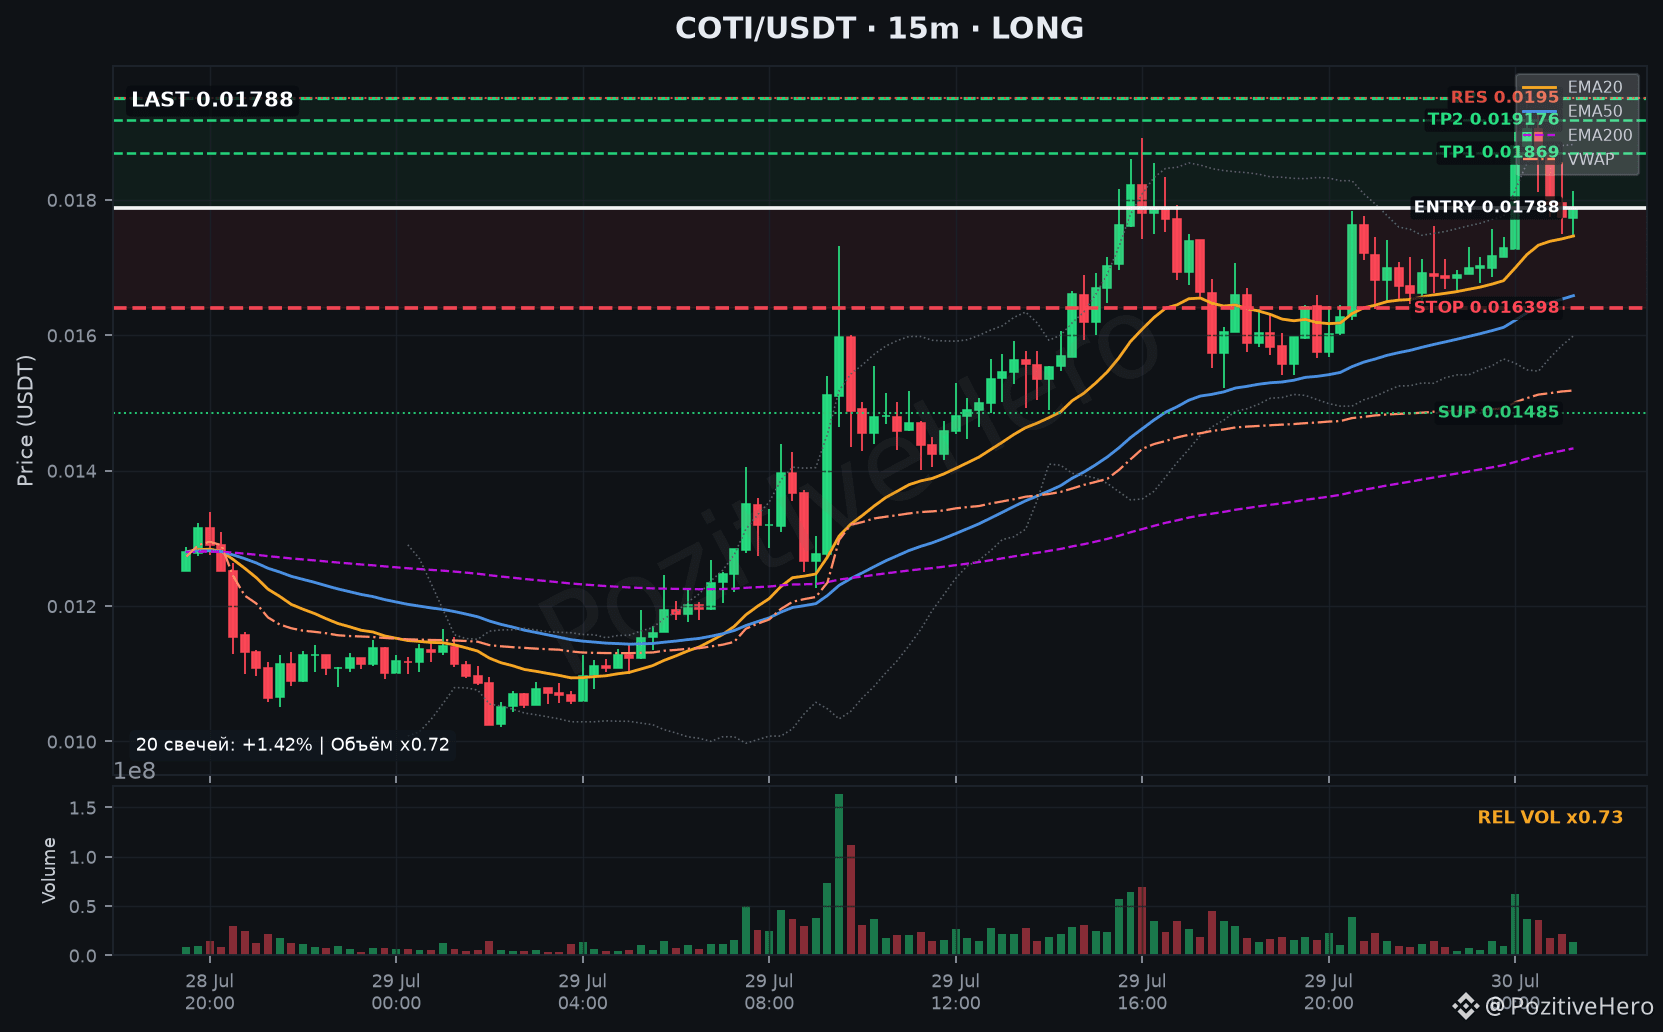
$COTI · LONG · Price control relative to VWAP
The essence is that the price is kept above VWAP by 0.017036. VWAP is currently a reference point for intraday control. As long as the price remains above it, the initiative aligns with the LONG direction.
Control — the best confirmation — is a reaction from VWAP with an update of the local extreme. Risk — a hold below VWAP will weaken the intraday structure.
Price plan
Entry 0.01788 USDT | Stop 0.016398 USDT | R/R 1.09
TP1 0.01869 · TP2 0.019176 · TP3 0.0195 USDT
On higher timeframes: 1H ✓ · 4H ✓ · 1D ×. Background: BTC: neutral, 1H -0.45%, 4H +0.28% — the backdrop supports the direction.
Risk is limited to the level of 0.016398. Within the range 0.01485–0.0195 we look for a reaction; beyond the stop we do not protect the idea with words. Position size is determined from the acceptable risk up to the entry.
Would you execute this entry with a limit order or only after a reaction?
#ChartAnalysis #TradeIdea #COTI #LONG
$COTI · LONG · Price control relative to VWAP
The essence is that the price is kept above VWAP by 0.017036. VWAP is currently a reference point for intraday control. As long as the price remains above it, the initiative aligns with the LONG direction.
Control — the best confirmation — is a reaction from VWAP with an update of the local extreme. Risk — a hold below VWAP will weaken the intraday structure.
Price plan
Entry 0.01788 USDT | Stop 0.016398 USDT | R/R 1.09
TP1 0.01869 · TP2 0.019176 · TP3 0.0195 USDT
On higher timeframes: 1H ✓ · 4H ✓ · 1D ×. Background: BTC: neutral, 1H -0.45%, 4H +0.28% — the backdrop supports the direction.
Risk is limited to the level of 0.016398. Within the range 0.01485–0.0195 we look for a reaction; beyond the stop we do not protect the idea with words. Position size is determined from the acceptable risk up to the entry.
Would you execute this entry with a limit order or only after a reaction?
#ChartAnalysis #TradeIdea #COTI #LONG
The essence is that the price is kept above VWAP by 0.017036. VWAP is currently a reference point for intraday control. As long as the price remains above it, the initiative aligns with the LONG direction.
Control — the best confirmation — is a reaction from VWAP with an update of the local extreme. Risk — a hold below VWAP will weaken the intraday structure.
Price plan
Entry 0.01788 USDT | Stop 0.016398 USDT | R/R 1.09
TP1 0.01869 · TP2 0.019176 · TP3 0.0195 USDT
On higher timeframes: 1H ✓ · 4H ✓ · 1D ×. Background: BTC: neutral, 1H -0.45%, 4H +0.28% — the backdrop supports the direction.
Risk is limited to the level of 0.016398. Within the range 0.01485–0.0195 we look for a reaction; beyond the stop we do not protect the idea with words. Position size is determined from the acceptable risk up to the entry.
Would you execute this entry with a limit order or only after a reaction?
#ChartAnalysis #TradeIdea #COTI #LONG
17
Log in to explore more content
Join global crypto users on Binance Square
⚡️ Get latest and useful information about crypto.
💬 Trusted by the world’s largest crypto exchange.
👍 Discover real insights from verified creators.
Email / Phone number
Trending Topics
1
#XRPDropsToTwoYearLowNear87Cents
200 views
37 Discussing
2
#BitcoinFallsBelow$57KToTwoYearLow
68 views
9 Discussing
3
#NvidiaLoses$2.7TrillionInMonthAndAHalf
82 views
25 Discussing
4
#CanBTCReboundAfterFallingBelow60K?
494,905 views
2,174 Discussing
5
#GlobalStocksFaceLongestLosingStreakSince2023
164,781 views
1,511 Discussing
6
#BlackRockIBITPostsRecord$541MSingleDayOutflow
8,606 views
48 Discussing
7
#AnthropicPlungesTowardIPOPriceonDay2
78,782 views
866 Discussing
8
#TwentyOneCapitalAdds172.25BTC
33,120 views
394 Discussing
9
#HKBillWouldExcludeTokenizedDepositsFromVirtualAssets
3,065 views
40 Discussing
10
#BNBDropsBelow540USDTWith8.46%DailyDecline
48,271 views
438 Discussing