
#tradingsetups
tradingsetups
146,898 views
1,031 Discussing
Hot
Latest

$SKYAI
📊 SKYAI/USDT 15m Chart Analysis & Update:
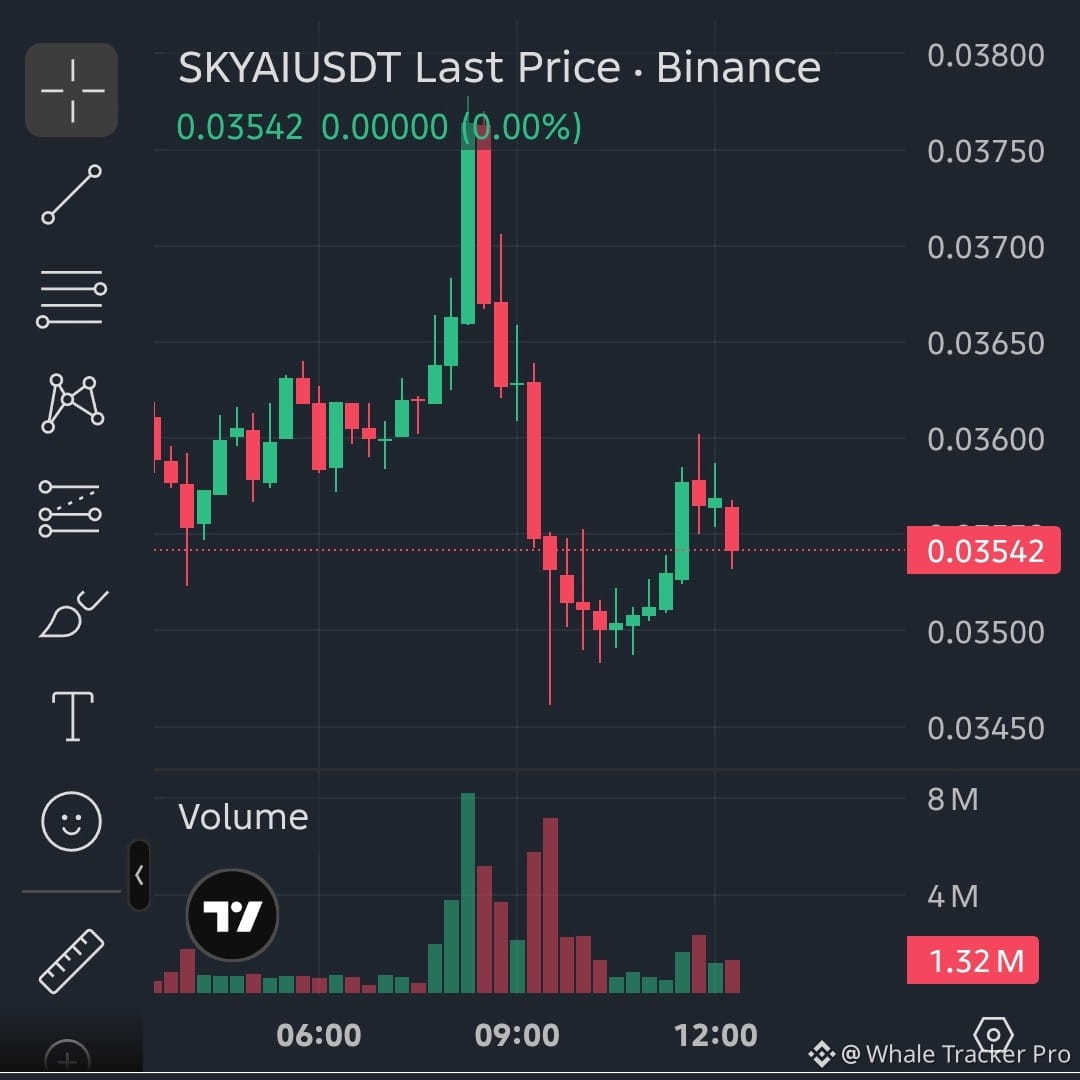
$SKYAI is currently trading at 0.03542, posting a small 24h gain of +3.63% with a 24h high of 0.03778 and a low of 0.03392. On the 15-minute chart, price recently swept liquidity toward the 0.03780 resistance zone, followed by a strong impulsive rejection and a corrective retracement phase down to current levels.
The order book currently shows increased selling pressure with 56.54% asks versus 43.46% bids, reflecting short-term bearish dominance as price pulls back from the highs. Chasing longs here without support confirmation is unadvisable.
⚠️ Status: WAIT / NO TRADE
🔍 What to watch for:
* Wait for a clear retest of local demand/support around 0.03400 - 0.03450, or a confirmed breakout above 0.03780 before taking a directional trade.
* Protect your capital and manage risk strictly. Do not force trades in uncertain ranges!
$SKYAI
{future}(SKYAIUSDT)
#BinanceSquare #CryptoAnalysis #SKYAI #TradingSetups
$SKYAI
📊 SKYAI/USDT 15m Chart Analysis & Update:
$SKYAI is currently trading at 0.03542, posting a small 24h gain of +3.63% with a 24h high of 0.03778 and a low of 0.03392. On the 15-minute chart, price recently swept liquidity toward the 0.03780 resistance zone, followed by a strong impulsive rejection and a corrective retracement phase down to current levels.
The order book currently shows increased selling pressure with 56.54% asks versus 43.46% bids, reflecting short-term bearish dominance as price pulls back from the highs. Chasing longs here without support confirmation is unadvisable.
⚠️ Status: WAIT / NO TRADE
🔍 What to watch for:
* Wait for a clear retest of local demand/support around 0.03400 - 0.03450, or a confirmed breakout above 0.03780 before taking a directional trade.
* Protect your capital and manage risk strictly. Do not force trades in uncertain ranges!
$SKYAI
#BinanceSquare #CryptoAnalysis #SKYAI #TradingSetups
📊 SKYAI/USDT 15m Chart Analysis & Update:
$SKYAI is currently trading at 0.03542, posting a small 24h gain of +3.63% with a 24h high of 0.03778 and a low of 0.03392. On the 15-minute chart, price recently swept liquidity toward the 0.03780 resistance zone, followed by a strong impulsive rejection and a corrective retracement phase down to current levels.
The order book currently shows increased selling pressure with 56.54% asks versus 43.46% bids, reflecting short-term bearish dominance as price pulls back from the highs. Chasing longs here without support confirmation is unadvisable.
⚠️ Status: WAIT / NO TRADE
🔍 What to watch for:
* Wait for a clear retest of local demand/support around 0.03400 - 0.03450, or a confirmed breakout above 0.03780 before taking a directional trade.
* Protect your capital and manage risk strictly. Do not force trades in uncertain ranges!
$SKYAI
#BinanceSquare #CryptoAnalysis #SKYAI #TradingSetups
89
$KITE
📊 KITE/USDT 15m Chart Analysis & Update:
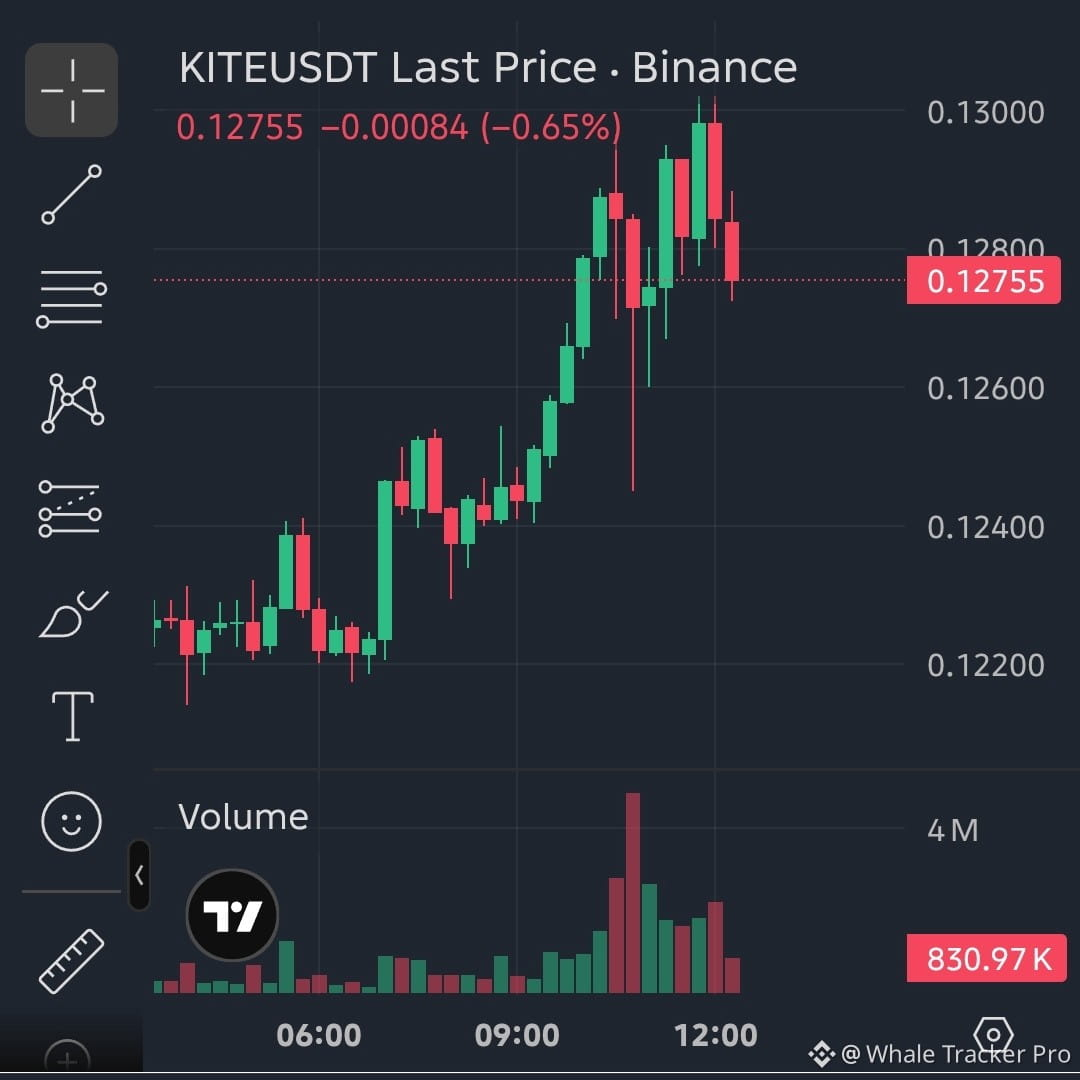
$KITE is currently trading at 0.12749, showing a modest 24h gain of +5.59% with a 24h high of 0.13021 and a low of 0.11964. On the 15-minute chart, price recently tested the upper resistance boundary near the 0.13000 liquidity pool, followed by an impulsive rejection down toward current levels.
The order book currently shows stronger selling pressure with 68.39% asks versus 31.61% bids, reflecting short-term bearish momentum as price pulls back from the highs. Chasing longs here without clear support confirmation is unadvisable.
⚠️ Status: WAIT / NO TRADE
🔍 What to watch for:
* Wait for a clear retest of local support demand around 0.12400 - 0.12500, or a confirmed breakout above 0.13000 before establishing a position.
* Protect your capital and manage risk strictly. Avoid forced trades in choppy consolidation!
$KITE
{future}(KITEUSDT)
#BinanceSquare #CryptoAnalysis #KITE #TradingSetups
$KITE
📊 KITE/USDT 15m Chart Analysis & Update:
$KITE is currently trading at 0.12749, showing a modest 24h gain of +5.59% with a 24h high of 0.13021 and a low of 0.11964. On the 15-minute chart, price recently tested the upper resistance boundary near the 0.13000 liquidity pool, followed by an impulsive rejection down toward current levels.
The order book currently shows stronger selling pressure with 68.39% asks versus 31.61% bids, reflecting short-term bearish momentum as price pulls back from the highs. Chasing longs here without clear support confirmation is unadvisable.
⚠️ Status: WAIT / NO TRADE
🔍 What to watch for:
* Wait for a clear retest of local support demand around 0.12400 - 0.12500, or a confirmed breakout above 0.13000 before establishing a position.
* Protect your capital and manage risk strictly. Avoid forced trades in choppy consolidation!
$KITE
#BinanceSquare #CryptoAnalysis #KITE #TradingSetups
📊 KITE/USDT 15m Chart Analysis & Update:
$KITE is currently trading at 0.12749, showing a modest 24h gain of +5.59% with a 24h high of 0.13021 and a low of 0.11964. On the 15-minute chart, price recently tested the upper resistance boundary near the 0.13000 liquidity pool, followed by an impulsive rejection down toward current levels.
The order book currently shows stronger selling pressure with 68.39% asks versus 31.61% bids, reflecting short-term bearish momentum as price pulls back from the highs. Chasing longs here without clear support confirmation is unadvisable.
⚠️ Status: WAIT / NO TRADE
🔍 What to watch for:
* Wait for a clear retest of local support demand around 0.12400 - 0.12500, or a confirmed breakout above 0.13000 before establishing a position.
* Protect your capital and manage risk strictly. Avoid forced trades in choppy consolidation!
$KITE
#BinanceSquare #CryptoAnalysis #KITE #TradingSetups
21
$BLUAI
📊 BLUAI/USDT 15m Chart Analysis & Update:
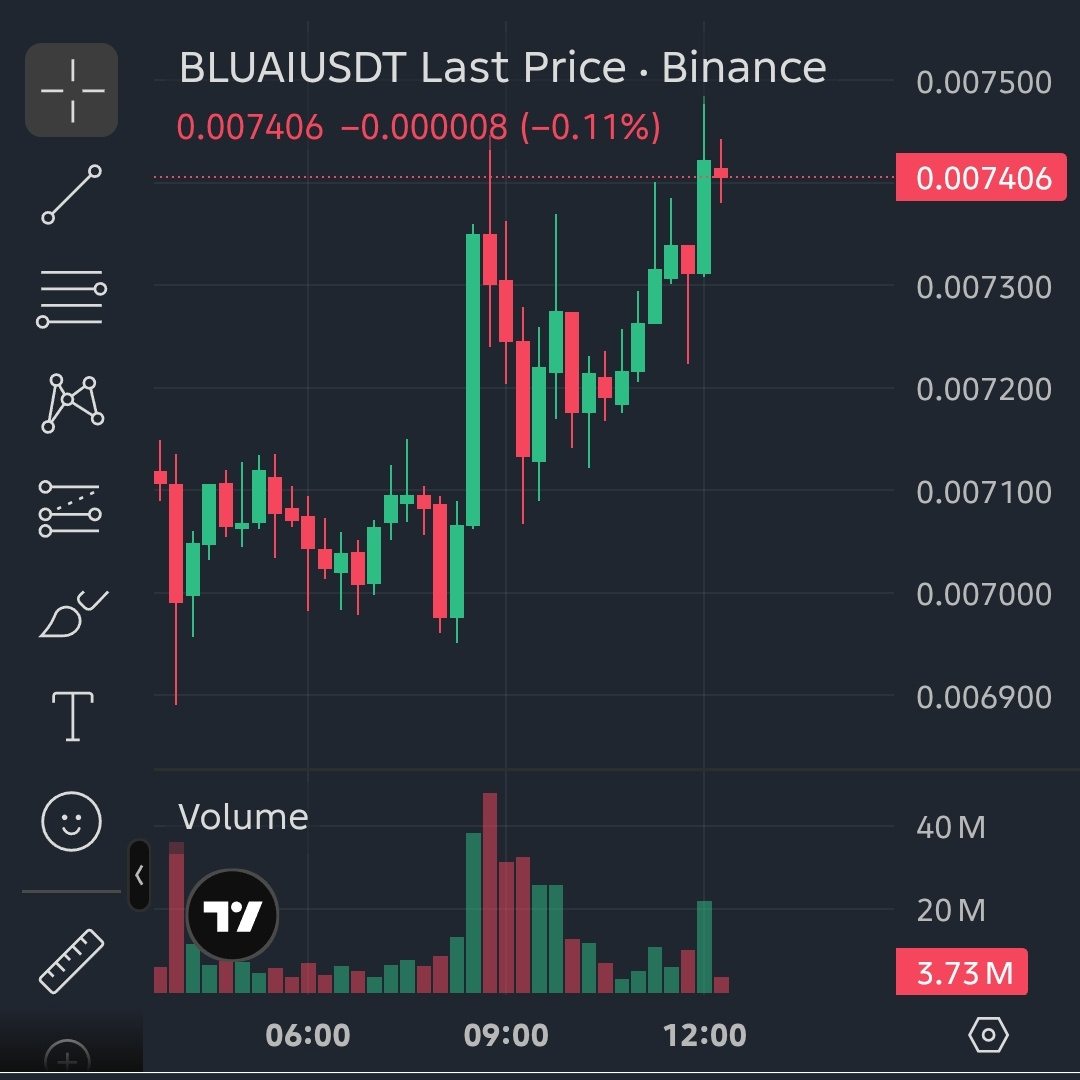
$BLUAI is currently trading at 0.07405, showing a mild 24h gain of +6.52% with a 24h high of 0.07600 and a low of 0.006829. On the 15-minute timeframe, price is testing the upper boundary near the 0.07600 resistance / local liquidity pool after a steady recovery from recent lows.
The order book currently shows slightly higher selling pressure with 51.35% asks versus 48.65% bids, pointing to cautious hesitation right below resistance. Without a verified breakout and acceptance above the 0.07600 zone, chasing this level carries unnecessary risk.
⚠️ Status: WAIT / NO TRADE
🔍 What to watch for:
* Wait for a clean breakout and candle close confirmation above 0.07600, or a pullback retest toward support around 0.07200 before considering any directional position.
* Prioritize capital preservation over chasing uncertain breakouts!
$BLUAI
{future}(BLUAIUSDT)
#BinanceSquare #CryptoAnalysis #BLUAI #TradingSetups
$BLUAI
📊 BLUAI/USDT 15m Chart Analysis & Update:
$BLUAI is currently trading at 0.07405, showing a mild 24h gain of +6.52% with a 24h high of 0.07600 and a low of 0.006829. On the 15-minute timeframe, price is testing the upper boundary near the 0.07600 resistance / local liquidity pool after a steady recovery from recent lows.
The order book currently shows slightly higher selling pressure with 51.35% asks versus 48.65% bids, pointing to cautious hesitation right below resistance. Without a verified breakout and acceptance above the 0.07600 zone, chasing this level carries unnecessary risk.
⚠️ Status: WAIT / NO TRADE
🔍 What to watch for:
* Wait for a clean breakout and candle close confirmation above 0.07600, or a pullback retest toward support around 0.07200 before considering any directional position.
* Prioritize capital preservation over chasing uncertain breakouts!
$BLUAI
#BinanceSquare #CryptoAnalysis #BLUAI #TradingSetups
📊 BLUAI/USDT 15m Chart Analysis & Update:
$BLUAI is currently trading at 0.07405, showing a mild 24h gain of +6.52% with a 24h high of 0.07600 and a low of 0.006829. On the 15-minute timeframe, price is testing the upper boundary near the 0.07600 resistance / local liquidity pool after a steady recovery from recent lows.
The order book currently shows slightly higher selling pressure with 51.35% asks versus 48.65% bids, pointing to cautious hesitation right below resistance. Without a verified breakout and acceptance above the 0.07600 zone, chasing this level carries unnecessary risk.
⚠️ Status: WAIT / NO TRADE
🔍 What to watch for:
* Wait for a clean breakout and candle close confirmation above 0.07600, or a pullback retest toward support around 0.07200 before considering any directional position.
* Prioritize capital preservation over chasing uncertain breakouts!
$BLUAI
#BinanceSquare #CryptoAnalysis #BLUAI #TradingSetups
71
$MAGMA
📊 MAGMA/USDT 15m Chart Analysis & Update:
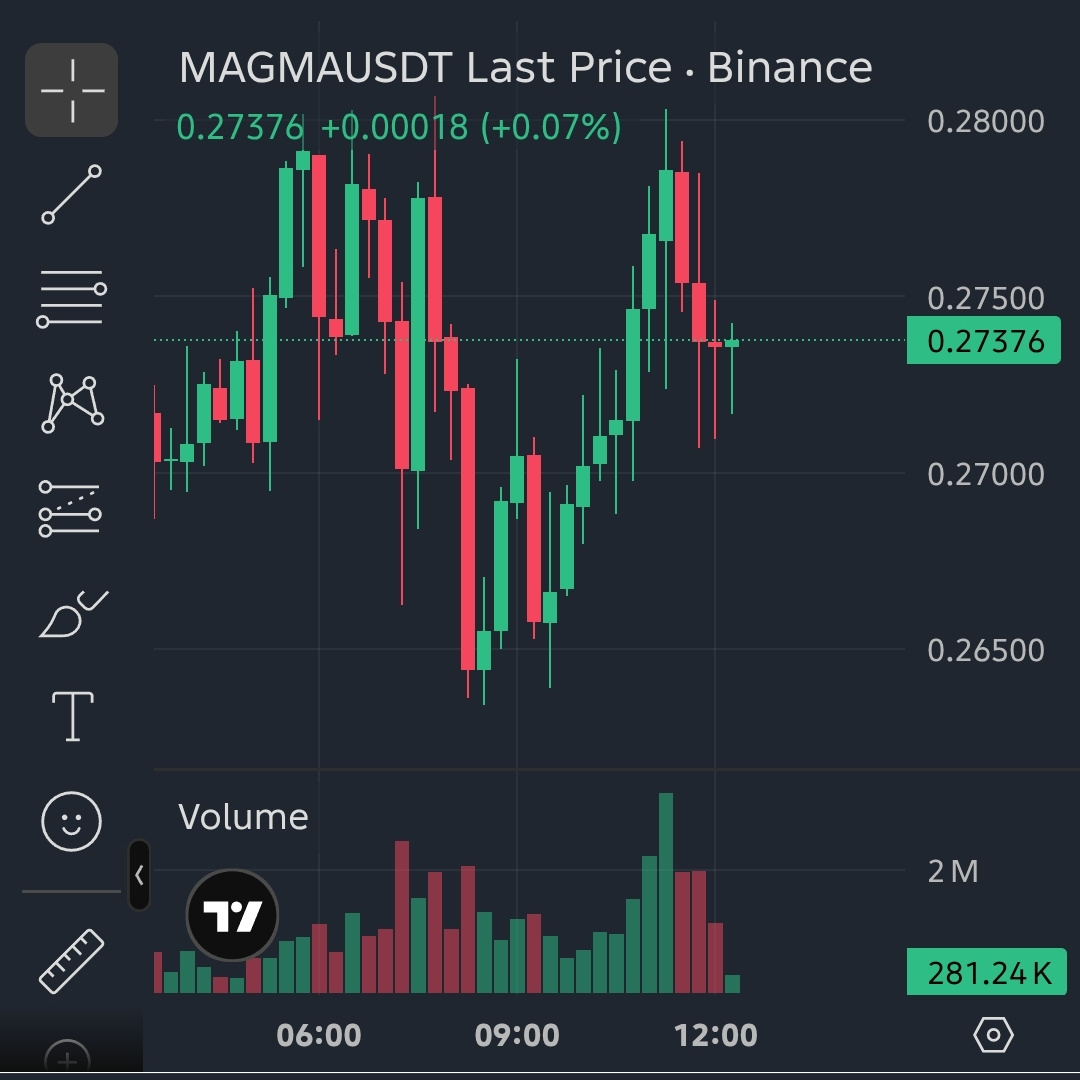
$MAGMA is currently trading at 0.27377, showing a modest 24h gain of +9.90% with a 24h high of 0.28068 and a low of 0.24600. On the 15-minute chart, price recently printed a double-top structure near the 0.28000 resistance zone, followed by an impulsive rejection down to current levels.
The order book currently shows stronger selling pressure with 62.71% asks versus 37.29% bids, reflecting short-term bearish dominance as price pulls back from resistance. Chasing longs here without support confirmation is unfavorable.
⚠️ Status: WAIT / NO TRADE
🔍 What to watch for:
* Wait for a clear retest of local support zones around 0.26500 - 0.26800 or a confirmed breakout above resistance before taking a directional bias.
* Protect your capital and manage risk strictly. Do not force trades in a choppy range!
$MAGMA
{future}(MAGMAUSDT)
#BinanceSquare #CryptoAnalysis #MAGMA #TradingSetups
$MAGMA
📊 MAGMA/USDT 15m Chart Analysis & Update:
$MAGMA is currently trading at 0.27377, showing a modest 24h gain of +9.90% with a 24h high of 0.28068 and a low of 0.24600. On the 15-minute chart, price recently printed a double-top structure near the 0.28000 resistance zone, followed by an impulsive rejection down to current levels.
The order book currently shows stronger selling pressure with 62.71% asks versus 37.29% bids, reflecting short-term bearish dominance as price pulls back from resistance. Chasing longs here without support confirmation is unfavorable.
⚠️ Status: WAIT / NO TRADE
🔍 What to watch for:
* Wait for a clear retest of local support zones around 0.26500 - 0.26800 or a confirmed breakout above resistance before taking a directional bias.
* Protect your capital and manage risk strictly. Do not force trades in a choppy range!
$MAGMA
#BinanceSquare #CryptoAnalysis #MAGMA #TradingSetups
📊 MAGMA/USDT 15m Chart Analysis & Update:
$MAGMA is currently trading at 0.27377, showing a modest 24h gain of +9.90% with a 24h high of 0.28068 and a low of 0.24600. On the 15-minute chart, price recently printed a double-top structure near the 0.28000 resistance zone, followed by an impulsive rejection down to current levels.
The order book currently shows stronger selling pressure with 62.71% asks versus 37.29% bids, reflecting short-term bearish dominance as price pulls back from resistance. Chasing longs here without support confirmation is unfavorable.
⚠️ Status: WAIT / NO TRADE
🔍 What to watch for:
* Wait for a clear retest of local support zones around 0.26500 - 0.26800 or a confirmed breakout above resistance before taking a directional bias.
* Protect your capital and manage risk strictly. Do not force trades in a choppy range!
$MAGMA
#BinanceSquare #CryptoAnalysis #MAGMA #TradingSetups
45
$KGEN
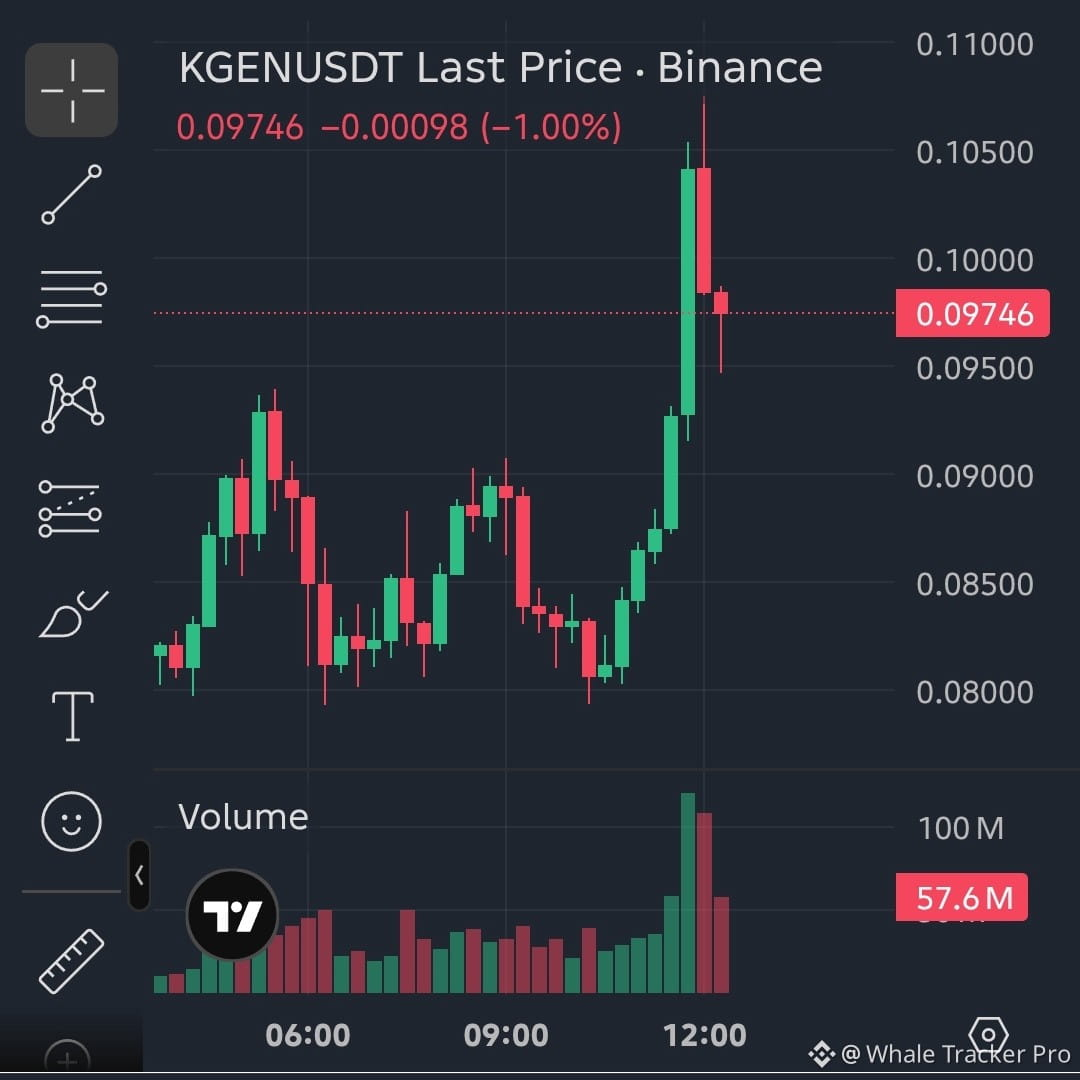
📊 KGEN/USDT 15m Chart Analysis & Update:
$KGEN is currently trading at 0.09742, posting a strong 24h gain of +45.73% with a 24h high of 0.10753 and a low of 0.06630. On the 15-minute chart, price recently printed an aggressive vertical expansion toward the 0.10750 liquidity zone, followed by an immediate impulsive pullback and a red rejection candle forming a local correction/consolidation phase.
The order book reflects a very balanced pressure distribution with 50.73% bids versus 49.27% asks, indicating intense indecision right after the massive impulsive run. Chasing this volatility without a confirmed retest or base is high-risk.
⚠️ Status: WAIT / NO TRADE
🔍 What to watch for:
* Wait for price to establish a clear support base or retrace toward deeper demand/FVG areas before looking for bullish continuation setups.
* Do not chase parabolic wicks blindly. Protect your capital with strict risk management!
$KGEN
{future}(KGENUSDT)
#BinanceSquare #CryptoAnalysis #KGEN #TradingSetups
$KGEN
📊 KGEN/USDT 15m Chart Analysis & Update:
$KGEN is currently trading at 0.09742, posting a strong 24h gain of +45.73% with a 24h high of 0.10753 and a low of 0.06630. On the 15-minute chart, price recently printed an aggressive vertical expansion toward the 0.10750 liquidity zone, followed by an immediate impulsive pullback and a red rejection candle forming a local correction/consolidation phase.
The order book reflects a very balanced pressure distribution with 50.73% bids versus 49.27% asks, indicating intense indecision right after the massive impulsive run. Chasing this volatility without a confirmed retest or base is high-risk.
⚠️ Status: WAIT / NO TRADE
🔍 What to watch for:
* Wait for price to establish a clear support base or retrace toward deeper demand/FVG areas before looking for bullish continuation setups.
* Do not chase parabolic wicks blindly. Protect your capital with strict risk management!
$KGEN
#BinanceSquare #CryptoAnalysis #KGEN #TradingSetups
📊 KGEN/USDT 15m Chart Analysis & Update:
$KGEN is currently trading at 0.09742, posting a strong 24h gain of +45.73% with a 24h high of 0.10753 and a low of 0.06630. On the 15-minute chart, price recently printed an aggressive vertical expansion toward the 0.10750 liquidity zone, followed by an immediate impulsive pullback and a red rejection candle forming a local correction/consolidation phase.
The order book reflects a very balanced pressure distribution with 50.73% bids versus 49.27% asks, indicating intense indecision right after the massive impulsive run. Chasing this volatility without a confirmed retest or base is high-risk.
⚠️ Status: WAIT / NO TRADE
🔍 What to watch for:
* Wait for price to establish a clear support base or retrace toward deeper demand/FVG areas before looking for bullish continuation setups.
* Do not chase parabolic wicks blindly. Protect your capital with strict risk management!
$KGEN
#BinanceSquare #CryptoAnalysis #KGEN #TradingSetups
160
$AGT
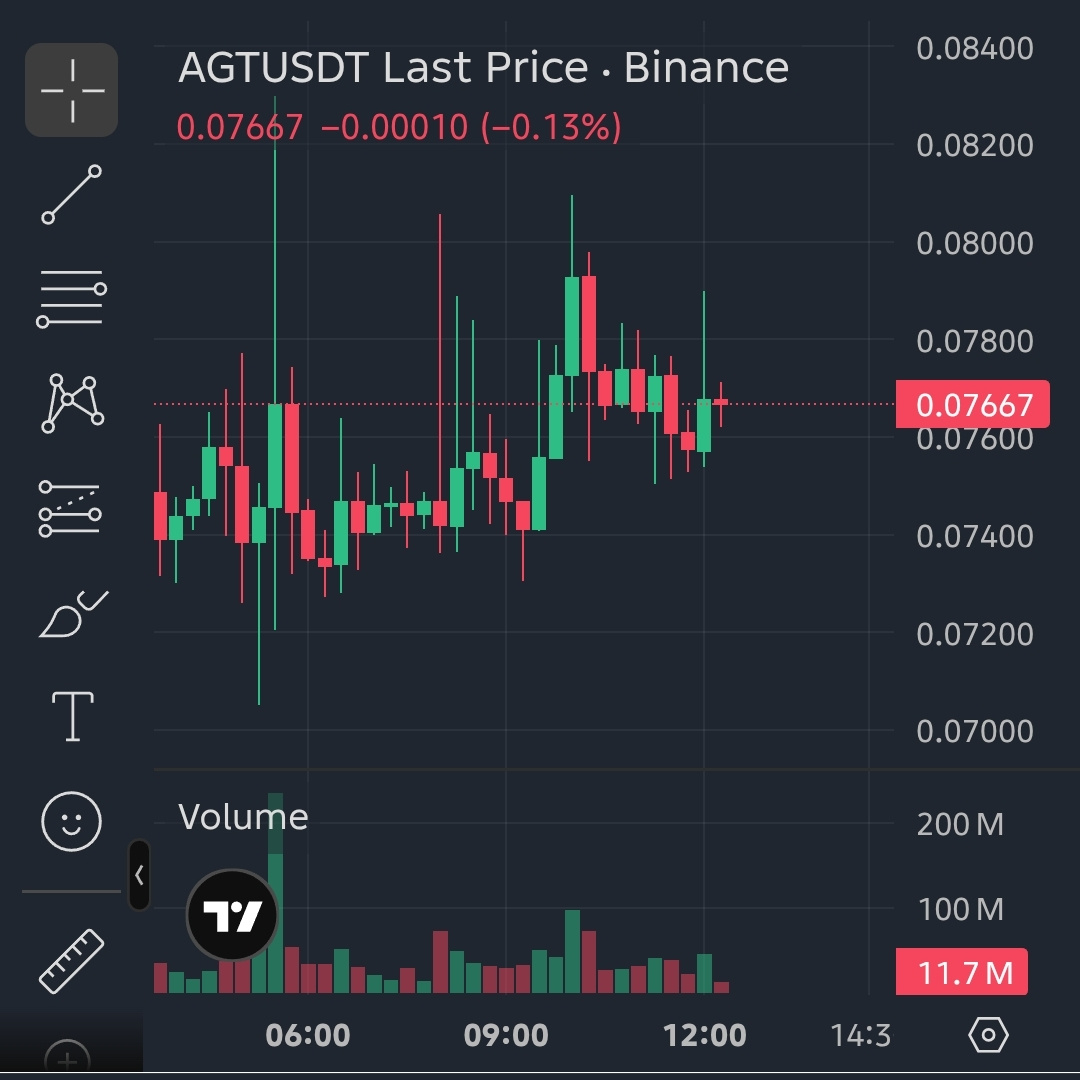
📊 AGT/USDT 15m Chart Analysis & Update:
$AGT is currently trading at 0.07666, showing massive 24h momentum (+203.12%) with a high of 0.08299 and heavy volume. On the 15-minute timeframe, price has experienced a strong impulsive expansion followed by consolidation near the 0.07600 - 0.07800 range, forming local range-bound behavior after sweeping liquidity toward the upper extremes.
The order book currently shows buyer dominance at 59.04% versus 40.96% seller pressure, indicating potential continuation if support holds. However, given the extreme volatility and parabolic run, chasing momentum blindly carries high risk.
⚠️ Status: WAIT / NO TRADE
🔍 What to watch for:
* Wait for a clear range breakout with volume confirmation or a retest of lower support demand zones around 0.07200 - 0.07400 before entering.
* Protect your capital and manage your risk strictly. Avoid forced setups in high-volatility conditions!
$AGT
{future}(AGTUSDT)
#BinanceSquare #CryptoAnalysis #AGT #TradingSetups
$AGT
📊 AGT/USDT 15m Chart Analysis & Update:
$AGT is currently trading at 0.07666, showing massive 24h momentum (+203.12%) with a high of 0.08299 and heavy volume. On the 15-minute timeframe, price has experienced a strong impulsive expansion followed by consolidation near the 0.07600 - 0.07800 range, forming local range-bound behavior after sweeping liquidity toward the upper extremes.
The order book currently shows buyer dominance at 59.04% versus 40.96% seller pressure, indicating potential continuation if support holds. However, given the extreme volatility and parabolic run, chasing momentum blindly carries high risk.
⚠️ Status: WAIT / NO TRADE
🔍 What to watch for:
* Wait for a clear range breakout with volume confirmation or a retest of lower support demand zones around 0.07200 - 0.07400 before entering.
* Protect your capital and manage your risk strictly. Avoid forced setups in high-volatility conditions!
$AGT
#BinanceSquare #CryptoAnalysis #AGT #TradingSetups
📊 AGT/USDT 15m Chart Analysis & Update:
$AGT is currently trading at 0.07666, showing massive 24h momentum (+203.12%) with a high of 0.08299 and heavy volume. On the 15-minute timeframe, price has experienced a strong impulsive expansion followed by consolidation near the 0.07600 - 0.07800 range, forming local range-bound behavior after sweeping liquidity toward the upper extremes.
The order book currently shows buyer dominance at 59.04% versus 40.96% seller pressure, indicating potential continuation if support holds. However, given the extreme volatility and parabolic run, chasing momentum blindly carries high risk.
⚠️ Status: WAIT / NO TRADE
🔍 What to watch for:
* Wait for a clear range breakout with volume confirmation or a retest of lower support demand zones around 0.07200 - 0.07400 before entering.
* Protect your capital and manage your risk strictly. Avoid forced setups in high-volatility conditions!
$AGT
#BinanceSquare #CryptoAnalysis #AGT #TradingSetups
230
$AGT
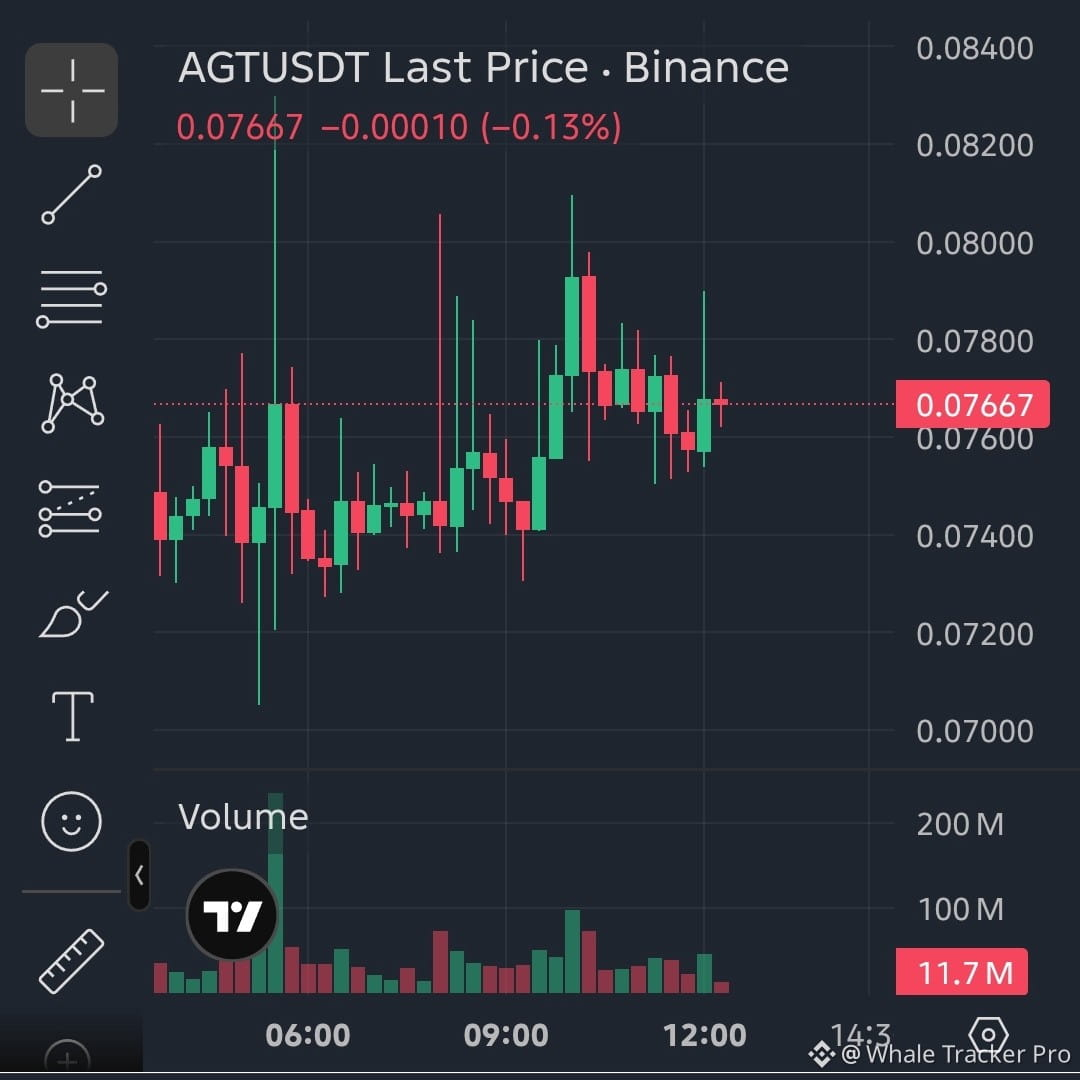
📊 $AGT /USDT chart analysis and update for the 15-minute timeframe:
$AGT is currently trading at 0.07666, showing strong 24-hour momentum of (+203.12%), with a high of 0.08299 and elevated trading volume. On the 15-minute timeframe, the price surged strongly upward, followed by stabilization and consolidation around the 0.07600–0.07800 range, moving sideways after a liquidity sweep toward higher levels.
The order book currently shows buyer dominance at 59.04%, compared with 40.96% selling pressure, suggesting the trend may continue if support holds. However, given the extreme volatility and sharp rise, chasing momentum indiscriminately carries high risk.
⚠️ Status: Wait / No trade (WAIT / NO TRADE)
🔍 What to watch:
* Wait for a clear breakout from the range with volume confirmation, or a retest of the lower support demand zones around 0.07200–0.07400 before entering.
* Protect your capital and manage risk strictly. Avoid entering an additional unconfirmed trade amid high volatility!
{future}(AGTUSDT)
#BinanceSquare #CryptoAnalysis #AGT #TradingSetups
$AGT
📊 $AGT /USDT chart analysis and update for the 15-minute timeframe:
$AGT is currently trading at 0.07666, showing strong 24-hour momentum of (+203.12%), with a high of 0.08299 and elevated trading volume. On the 15-minute timeframe, the price surged strongly upward, followed by stabilization and consolidation around the 0.07600–0.07800 range, moving sideways after a liquidity sweep toward higher levels.
The order book currently shows buyer dominance at 59.04%, compared with 40.96% selling pressure, suggesting the trend may continue if support holds. However, given the extreme volatility and sharp rise, chasing momentum indiscriminately carries high risk.
⚠️ Status: Wait / No trade (WAIT / NO TRADE)
🔍 What to watch:
* Wait for a clear breakout from the range with volume confirmation, or a retest of the lower support demand zones around 0.07200–0.07400 before entering.
* Protect your capital and manage risk strictly. Avoid entering an additional unconfirmed trade amid high volatility!
#BinanceSquare #CryptoAnalysis #AGT #TradingSetups
📊 $AGT /USDT chart analysis and update for the 15-minute timeframe:
$AGT is currently trading at 0.07666, showing strong 24-hour momentum of (+203.12%), with a high of 0.08299 and elevated trading volume. On the 15-minute timeframe, the price surged strongly upward, followed by stabilization and consolidation around the 0.07600–0.07800 range, moving sideways after a liquidity sweep toward higher levels.
The order book currently shows buyer dominance at 59.04%, compared with 40.96% selling pressure, suggesting the trend may continue if support holds. However, given the extreme volatility and sharp rise, chasing momentum indiscriminately carries high risk.
⚠️ Status: Wait / No trade (WAIT / NO TRADE)
🔍 What to watch:
* Wait for a clear breakout from the range with volume confirmation, or a retest of the lower support demand zones around 0.07200–0.07400 before entering.
* Protect your capital and manage risk strictly. Avoid entering an additional unconfirmed trade amid high volatility!
#BinanceSquare #CryptoAnalysis #AGT #TradingSetups
127
$KITE
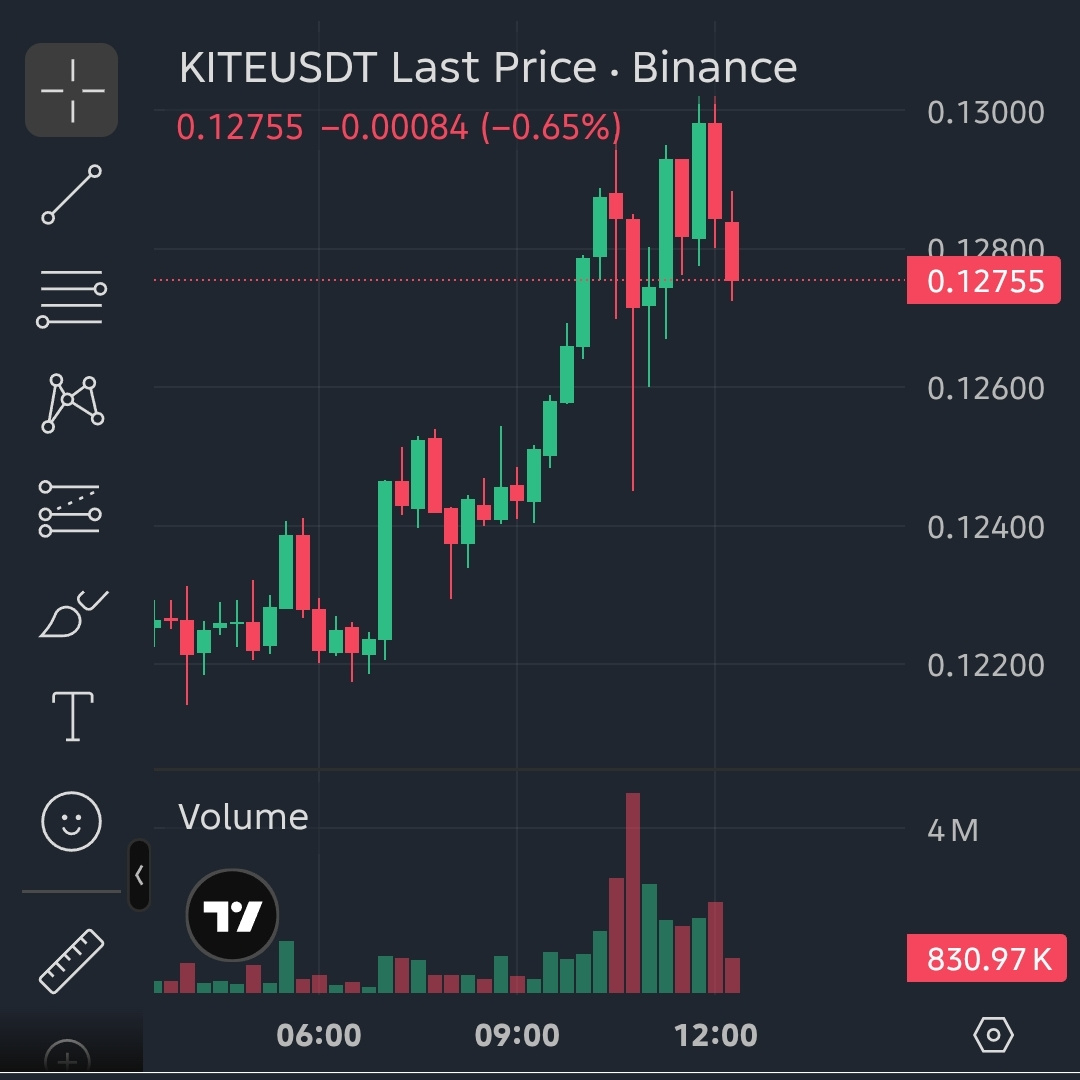
📊 $KITE/USDT chart analysis and update for the 15-minute timeframe:
$KITE is currently trading at 0.12749, posting moderate 24-hour gains of +5.59%, with a high of 0.13021 and a low of 0.11964. On the 15-minute timeframe, the price recently tested the upper resistance near the 0.13000 liquidity zone, followed by a sharp bearish rejection toward current levels.
The order book currently shows stronger selling pressure, with sellers at 68.39% versus buyers at 31.61%, reflecting short-term bearish momentum as the price retreats from its highs. Chasing long positions here without clear support confirmation is not recommended.
⚠️ Status: Wait / No Trade (WAIT / NO TRADE)
🔍 What to watch:
* Wait for a clear retest of local demand and support zones around 0.12400–0.12500, or a confirmed breakout above 0.13000 before opening any position.
* Protect your capital and manage risk strictly. Avoid forcing trades amid volatile consolidation!
$KITE
{future}(KITEUSDT)
#BinanceSquare #CryptoAnalysis #KITE #TradingSetups
$KITE
📊 $KITE /USDT chart analysis and update for the 15-minute timeframe:
$KITE is currently trading at 0.12749, posting moderate 24-hour gains of +5.59%, with a high of 0.13021 and a low of 0.11964. On the 15-minute timeframe, the price recently tested the upper resistance near the 0.13000 liquidity zone, followed by a sharp bearish rejection toward current levels.
The order book currently shows stronger selling pressure, with sellers at 68.39% versus buyers at 31.61%, reflecting short-term bearish momentum as the price retreats from its highs. Chasing long positions here without clear support confirmation is not recommended.
⚠️ Status: Wait / No Trade (WAIT / NO TRADE)
🔍 What to watch:
* Wait for a clear retest of local demand and support zones around 0.12400–0.12500, or a confirmed breakout above 0.13000 before opening any position.
* Protect your capital and manage risk strictly. Avoid forcing trades amid volatile consolidation!
$KITE
#BinanceSquare #CryptoAnalysis #KITE #TradingSetups
📊 $KITE /USDT chart analysis and update for the 15-minute timeframe:
$KITE is currently trading at 0.12749, posting moderate 24-hour gains of +5.59%, with a high of 0.13021 and a low of 0.11964. On the 15-minute timeframe, the price recently tested the upper resistance near the 0.13000 liquidity zone, followed by a sharp bearish rejection toward current levels.
The order book currently shows stronger selling pressure, with sellers at 68.39% versus buyers at 31.61%, reflecting short-term bearish momentum as the price retreats from its highs. Chasing long positions here without clear support confirmation is not recommended.
⚠️ Status: Wait / No Trade (WAIT / NO TRADE)
🔍 What to watch:
* Wait for a clear retest of local demand and support zones around 0.12400–0.12500, or a confirmed breakout above 0.13000 before opening any position.
* Protect your capital and manage risk strictly. Avoid forcing trades amid volatile consolidation!
$KITE
#BinanceSquare #CryptoAnalysis #KITE #TradingSetups
40

Strong earnings momentum is keeping $APP active around 326.11 today, with heavy volume backing the move after a solid guidance raise.
From the perspective of 21,576 pro traders at CrowdWisdomTrading, this setup leans into continuation as buyers defend recent expansion.
Key levels on the chart:
• Resistance target: 332.5
• Secondary objective: 339.5
• Immediate support: 312.5
• Secondary invalidation level: 307.0
The thesis stays constructive while price holds above 312.5. A drop below the second stop at 307.0 completely invalidates the setup.
#AppLovin #TradingSetups
Educational research, not personal advice. You place the trade. Not a trading instruction. DYOR.
Strong earnings momentum is keeping $APP active around 326.11 today, with heavy volume backing the move after a solid guidance raise.
From the perspective of 21,576 pro traders at CrowdWisdomTrading, this setup leans into continuation as buyers defend recent expansion.
Key levels on the chart:
• Resistance target: 332.5
• Secondary objective: 339.5
• Immediate support: 312.5
• Secondary invalidation level: 307.0
The thesis stays constructive while price holds above 312.5. A drop below the second stop at 307.0 completely invalidates the setup.
#AppLovin #TradingSetups
Educational research, not personal advice. You place the trade. Not a trading instruction. DYOR.
From the perspective of 21,576 pro traders at CrowdWisdomTrading, this setup leans into continuation as buyers defend recent expansion.
Key levels on the chart:
• Resistance target: 332.5
• Secondary objective: 339.5
• Immediate support: 312.5
• Secondary invalidation level: 307.0
The thesis stays constructive while price holds above 312.5. A drop below the second stop at 307.0 completely invalidates the setup.
#AppLovin #TradingSetups
Educational research, not personal advice. You place the trade. Not a trading instruction. DYOR.
309

·
--
Bearish
🚨 THREE SHORT SETUPS. THREE KEY ZONES TO WATCH.
The market is giving us some interesting downside setups. Here's what's on my radar today:
Short $BMT
{future}(BMTUSDT)
Entry: 0.03028 – 0.03046
TP1: 0.02992
TP2: 0.02968
TP3: 0.02932
SL: 0.03064
💥
Short $EVAA
{future}(EVAAUSDT)
Entry: 1.50851 – 1.51753
TP1: 1.49048
TP2: 1.47846
TP3: 1.46043
SL: 1.52654
📉
Short $AAPL
{future}(AAPLUSDT)
Entry: 334.76372 – 336.7643
TP1: 330.76256
TP2: 328.09512
TP3: 324.09396
SL: 338.76488
💥
Each setup has a defined entry zone and stop loss.
No chasing. No blind entries. Let price confirm the setup.
👀 Which one looks most interesting to you?
#CryptoTrading #BinanceSquare #ShortTrading #MarketAnalysis #TradingSetups
🚨 THREE SHORT SETUPS. THREE KEY ZONES TO WATCH.
The market is giving us some interesting downside setups. Here's what's on my radar today:
Short $BMT
Entry: 0.03028 – 0.03046
TP1: 0.02992
TP2: 0.02968
TP3: 0.02932
SL: 0.03064
💥
Short $EVAA
Entry: 1.50851 – 1.51753
TP1: 1.49048
TP2: 1.47846
TP3: 1.46043
SL: 1.52654
📉
Short $AAPL
Entry: 334.76372 – 336.7643
TP1: 330.76256
TP2: 328.09512
TP3: 324.09396
SL: 338.76488
💥
Each setup has a defined entry zone and stop loss.
No chasing. No blind entries. Let price confirm the setup.
👀 Which one looks most interesting to you?
#CryptoTrading #BinanceSquare #ShortTrading #MarketAnalysis #TradingSetups
The market is giving us some interesting downside setups. Here's what's on my radar today:
Short $BMT
Entry: 0.03028 – 0.03046
TP1: 0.02992
TP2: 0.02968
TP3: 0.02932
SL: 0.03064
💥
Short $EVAA
Entry: 1.50851 – 1.51753
TP1: 1.49048
TP2: 1.47846
TP3: 1.46043
SL: 1.52654
📉
Short $AAPL
Entry: 334.76372 – 336.7643
TP1: 330.76256
TP2: 328.09512
TP3: 324.09396
SL: 338.76488
💥
Each setup has a defined entry zone and stop loss.
No chasing. No blind entries. Let price confirm the setup.
👀 Which one looks most interesting to you?
#CryptoTrading #BinanceSquare #ShortTrading #MarketAnalysis #TradingSetups

2
511
·
--
Bearish
Not every opportunity points in the same direction. 👀
Today's trading watchlist brings three different setups:
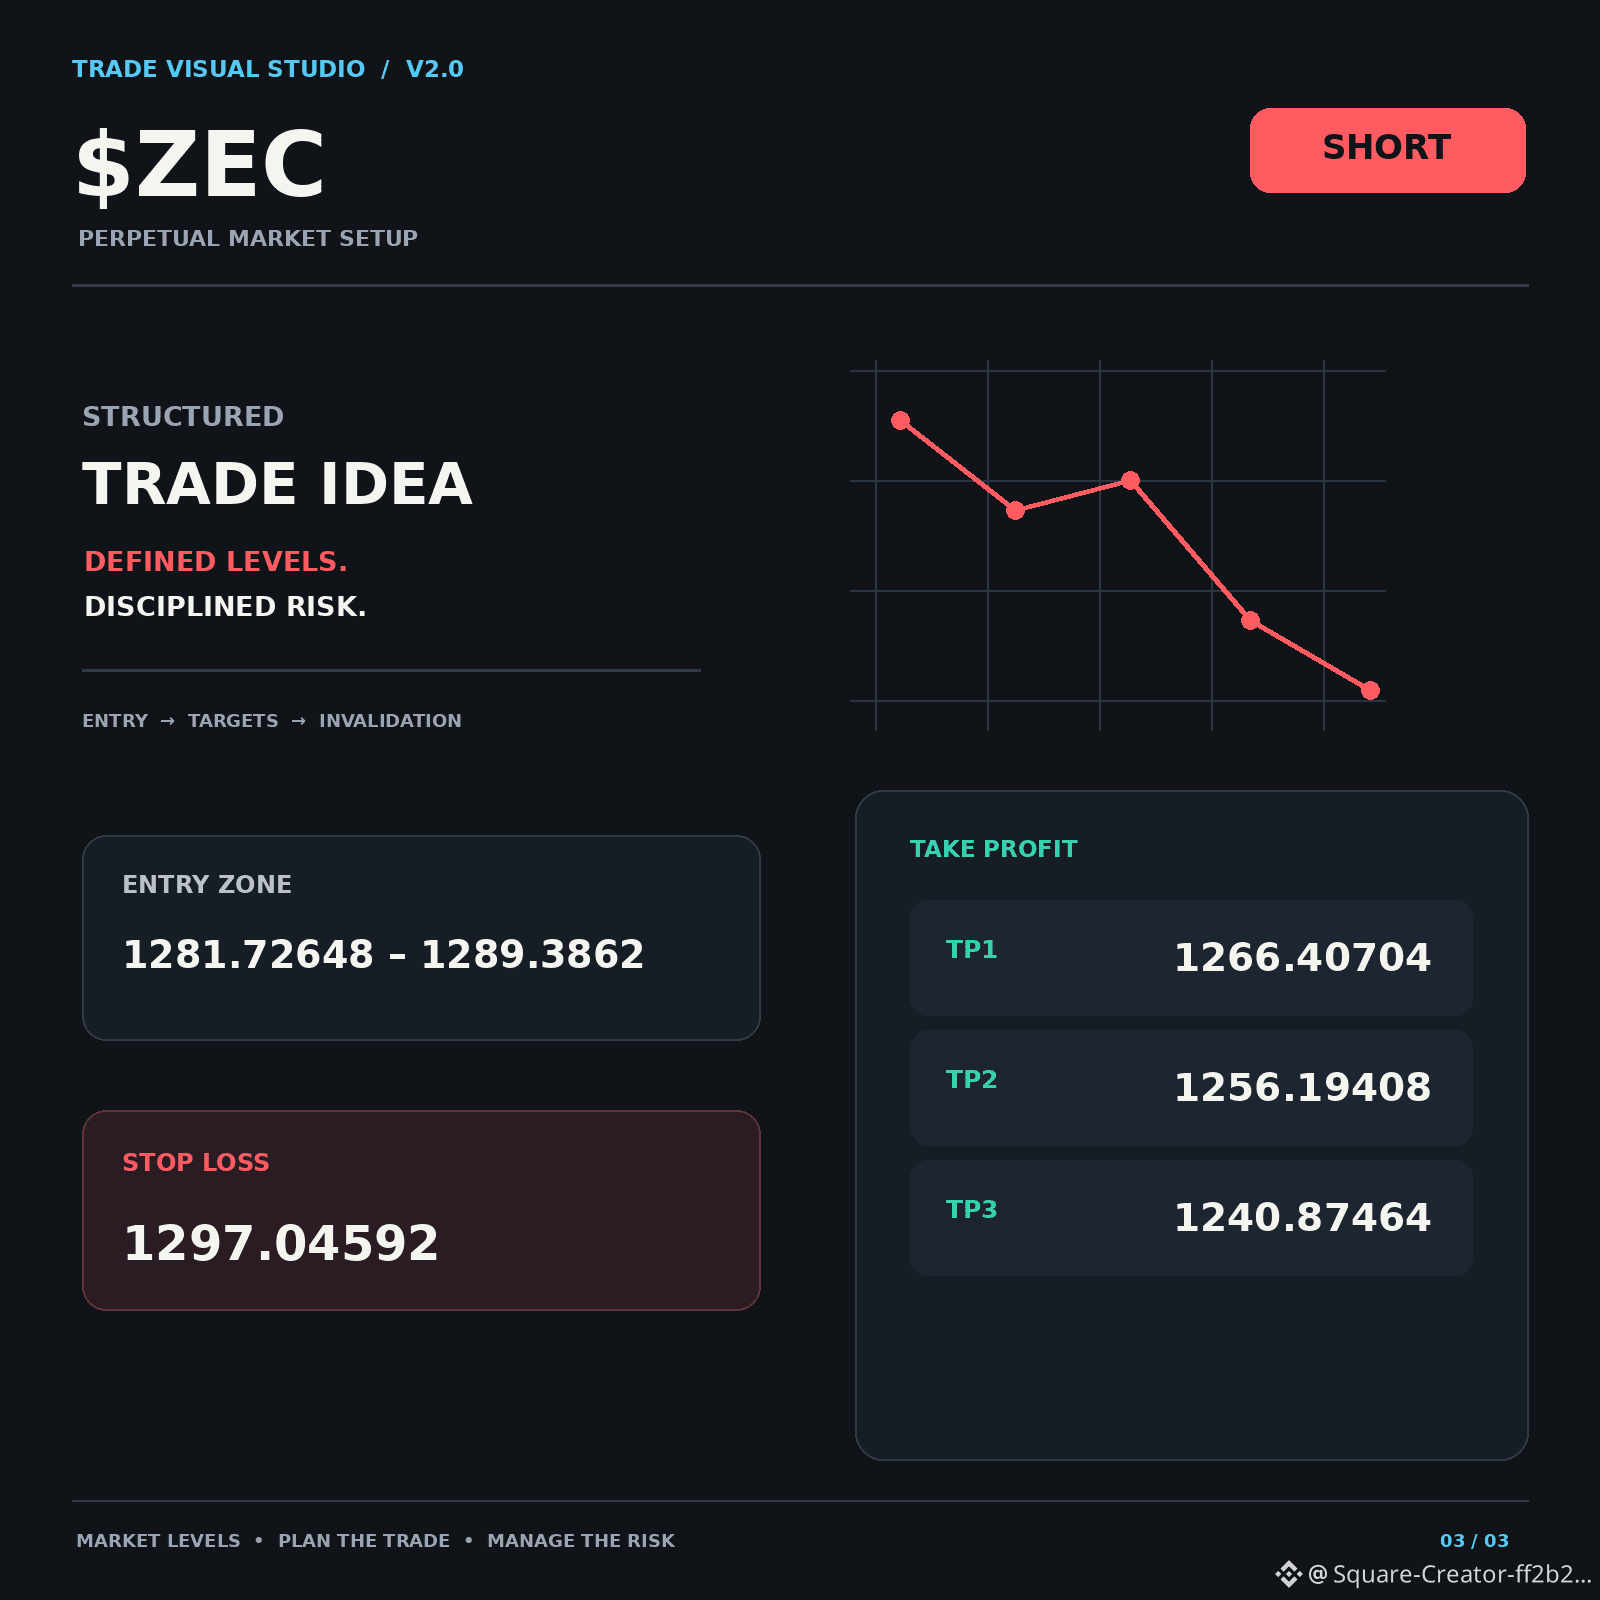
🔴 ZEC — SHORT
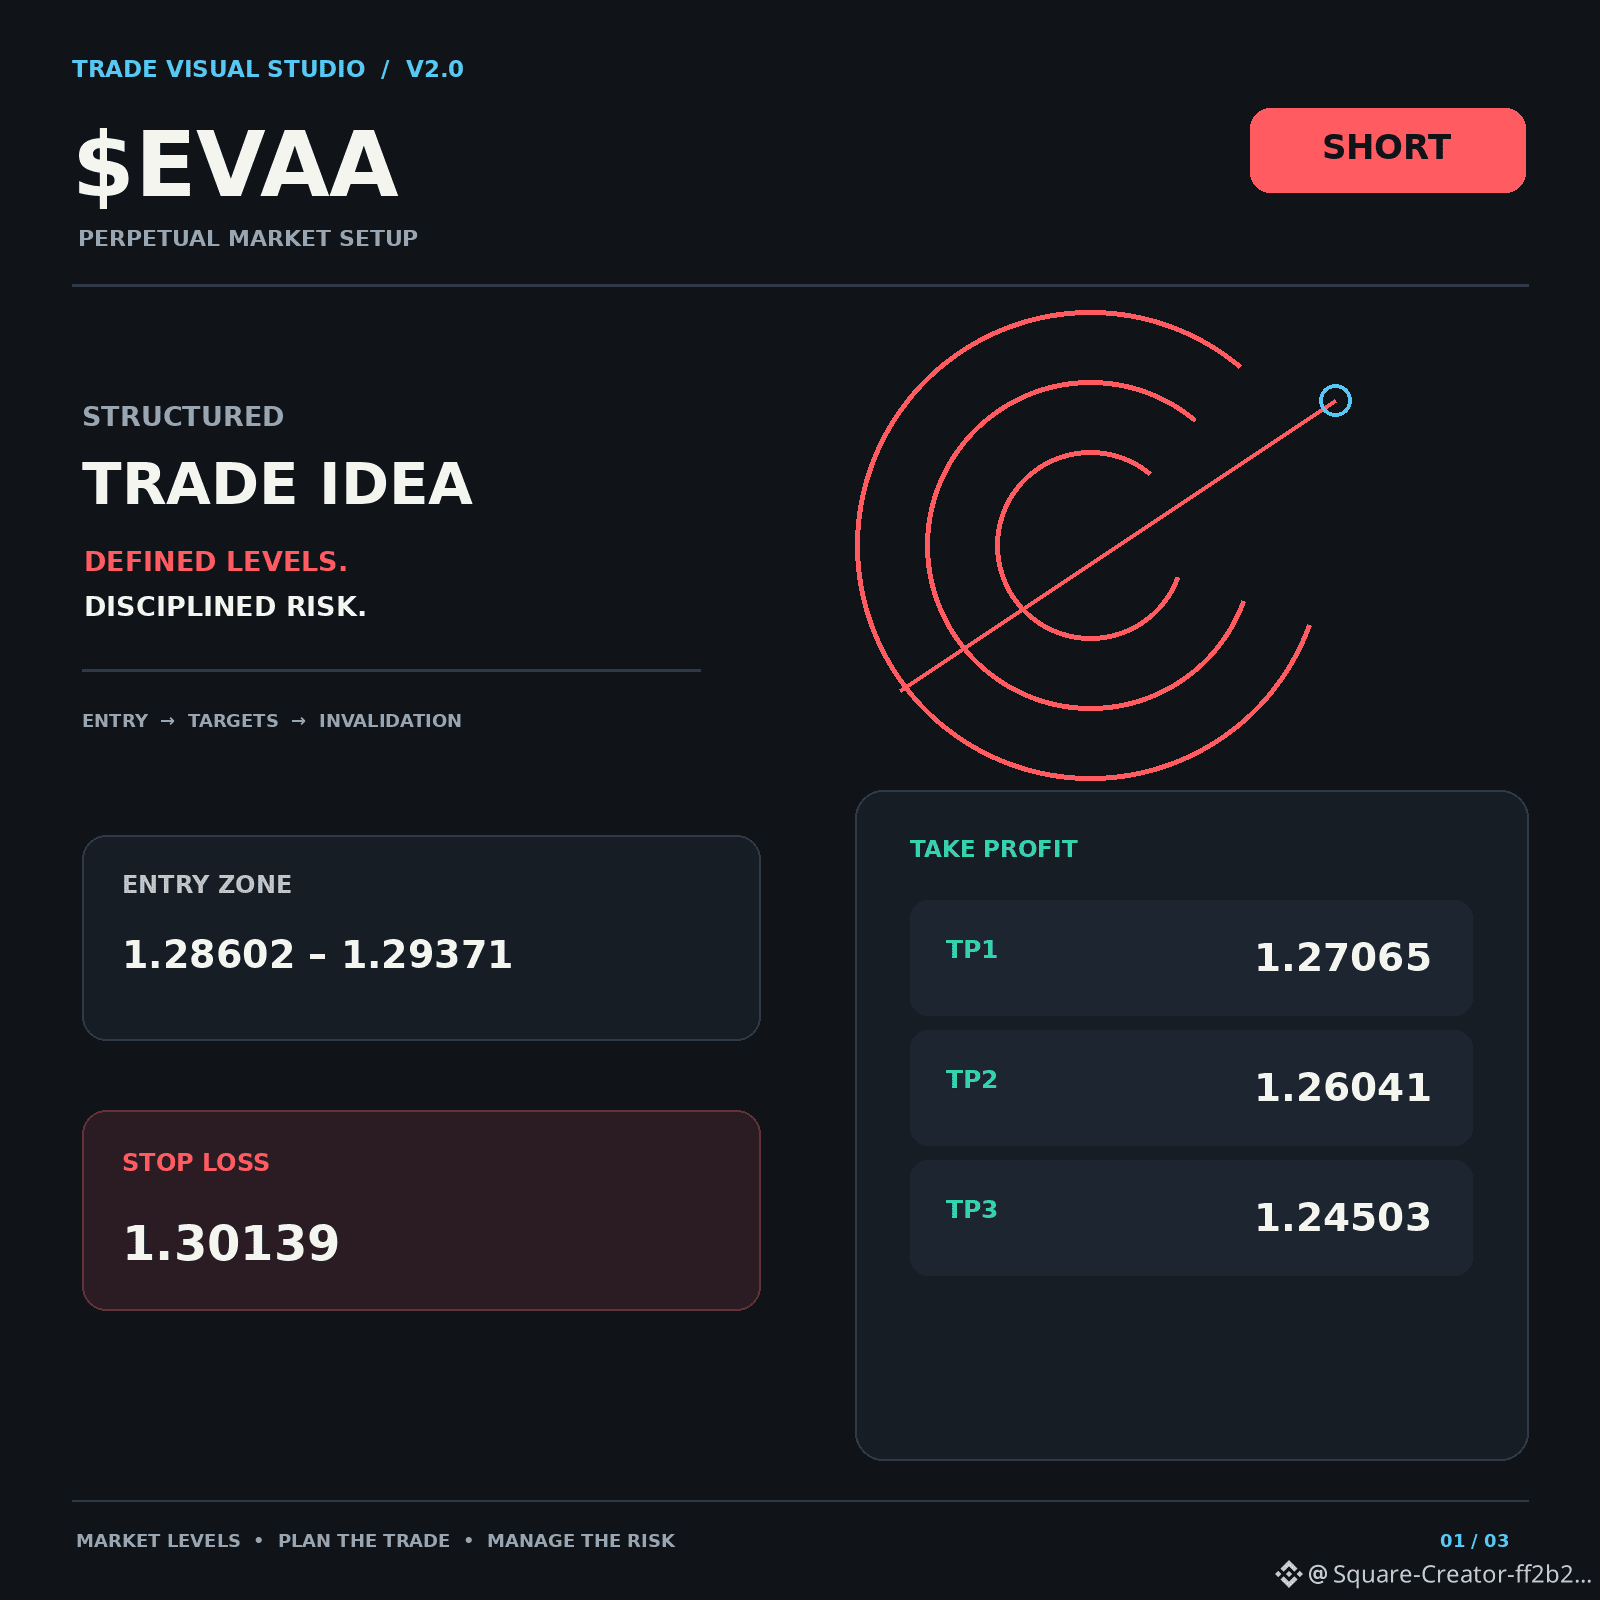
🟢 EVAA — LONG
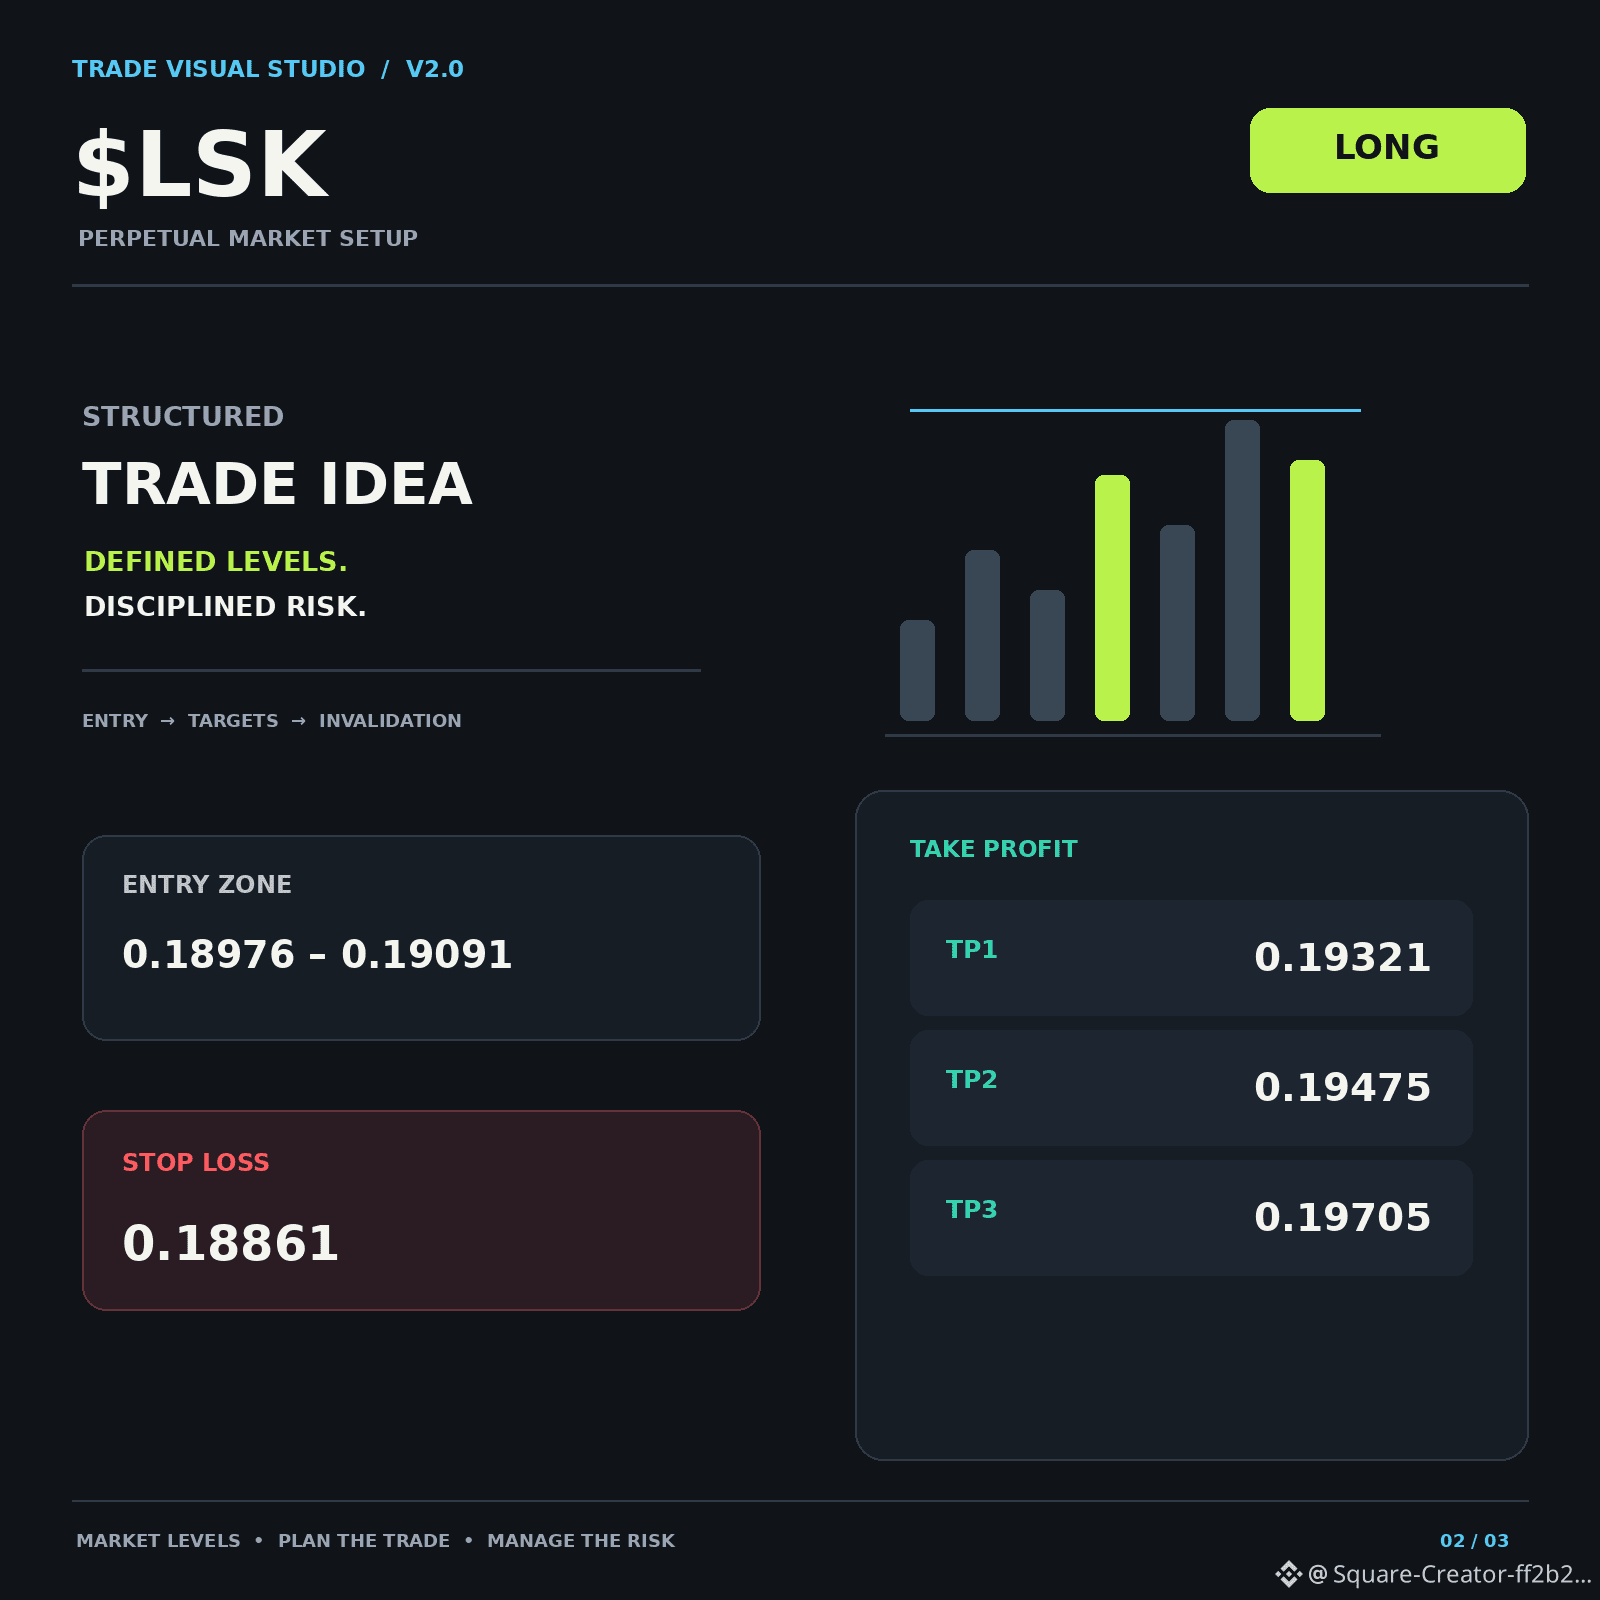
🔴 LSK — SHORT
Each setup includes:
▪️ Defined entry zone
▪️ Three take-profit targets
▪️ Clear stop-loss level
Different assets, different directions, one essential rule: manage your risk.
Short $ZEC
{future}(ZECUSDT)
Entry: 1281.72648 – 1289.3862
TP1: 1266.40704
TP2: 1256.19408
TP3: 1240.87464
SL: 1297.04592
Short $EVAA
{future}(EVAAUSDT)
Entry: 1.28602 – 1.29371
TP1: 1.27065
TP2: 1.26041
TP3: 1.24503
SL: 1.30139
Long $LSK
{future}(LSKUSDT)
Entry: 0.18976 – 0.19091
TP1: 0.19321
TP2: 0.19475
TP3: 0.19705
SL: 0.18861
Which one are you keeping on your radar?
#cryptotrading #BinanceSquareTurkey #TechnicalAnalysiss #TradingSetups #crypto
Not every opportunity points in the same direction. 👀
Today's trading watchlist brings three different setups:
🔴 ZEC — SHORT
🟢 EVAA — LONG
🔴 LSK — SHORT
Each setup includes:
▪️ Defined entry zone
▪️ Three take-profit targets
▪️ Clear stop-loss level
Different assets, different directions, one essential rule: manage your risk.
Short $ZEC
Entry: 1281.72648 – 1289.3862
TP1: 1266.40704
TP2: 1256.19408
TP3: 1240.87464
SL: 1297.04592
Short $EVAA
Entry: 1.28602 – 1.29371
TP1: 1.27065
TP2: 1.26041
TP3: 1.24503
SL: 1.30139
Long $LSK
Entry: 0.18976 – 0.19091
TP1: 0.19321
TP2: 0.19475
TP3: 0.19705
SL: 0.18861
Which one are you keeping on your radar?
#cryptotrading #BinanceSquareTurkey #TechnicalAnalysiss #TradingSetups #crypto
Today's trading watchlist brings three different setups:
🔴 ZEC — SHORT
🟢 EVAA — LONG
🔴 LSK — SHORT
Each setup includes:
▪️ Defined entry zone
▪️ Three take-profit targets
▪️ Clear stop-loss level
Different assets, different directions, one essential rule: manage your risk.
Short $ZEC
Entry: 1281.72648 – 1289.3862
TP1: 1266.40704
TP2: 1256.19408
TP3: 1240.87464
SL: 1297.04592
Short $EVAA
Entry: 1.28602 – 1.29371
TP1: 1.27065
TP2: 1.26041
TP3: 1.24503
SL: 1.30139
Long $LSK
Entry: 0.18976 – 0.19091
TP1: 0.19321
TP2: 0.19475
TP3: 0.19705
SL: 0.18861
Which one are you keeping on your radar?
#cryptotrading #BinanceSquareTurkey #TechnicalAnalysiss #TradingSetups #crypto
2
1.5k

·
--
Bullish
⚡ Market Breakdown: Top 3 Trending Setups (Short Analysis)
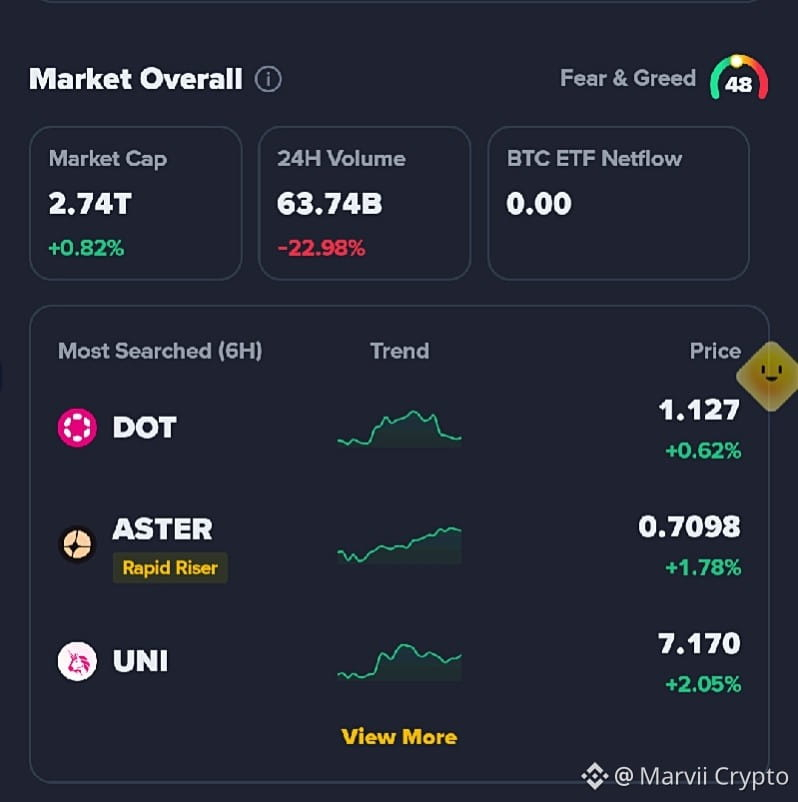
Market is Neutral (Fear & Greed: 48). Total Volume is down -22.98%, so trade carefully with tight Stop Losses!
🎯 1. Polkadot ($DOT) | Price: 1.127
• Entry Zone: 1.100 - 1.115 (On Support)
• Take Profit: 1.160 / 1.200
• Stop Loss: 1.080
🎯 2. Astar ($ASTER) | Price: 0.7098 (Rapid Riser)
• Entry Zone: 0.6800 - 0.6950 (Wait for Pullback)
• Take Profit: 0.7400 / 0.7600
• Stop Loss: 0.6600
🎯 3. Uniswap ($UNI) | Price: 7.170
• Entry Zone: 6.95 - 7.05 (MA Support)
• Take Profit: 7.45 / 7.60
• Stop Loss: 6.80
⚠️ Tip: Low volume means slow moves but high risk of sudden sweeps. Keep your risk managed!
#DOT
{spot}(DOTUSDT)
{spot}(ASTERUSDT)
{spot}(UNIUSDT)
#ASTER #UNI #TradingSetups #CryptoNews
⚡ Market Breakdown: Top 3 Trending Setups (Short Analysis)
Market is Neutral (Fear & Greed: 48). Total Volume is down -22.98%, so trade carefully with tight Stop Losses!
🎯 1. Polkadot ($DOT) | Price: 1.127
• Entry Zone: 1.100 - 1.115 (On Support)
• Take Profit: 1.160 / 1.200
• Stop Loss: 1.080
🎯 2. Astar ($ASTER) | Price: 0.7098 (Rapid Riser)
• Entry Zone: 0.6800 - 0.6950 (Wait for Pullback)
• Take Profit: 0.7400 / 0.7600
• Stop Loss: 0.6600
🎯 3. Uniswap ($UNI) | Price: 7.170
• Entry Zone: 6.95 - 7.05 (MA Support)
• Take Profit: 7.45 / 7.60
• Stop Loss: 6.80
⚠️ Tip: Low volume means slow moves but high risk of sudden sweeps. Keep your risk managed!
#DOT
#ASTER #UNI #TradingSetups #CryptoNews
Market is Neutral (Fear & Greed: 48). Total Volume is down -22.98%, so trade carefully with tight Stop Losses!
🎯 1. Polkadot ($DOT) | Price: 1.127
• Entry Zone: 1.100 - 1.115 (On Support)
• Take Profit: 1.160 / 1.200
• Stop Loss: 1.080
🎯 2. Astar ($ASTER) | Price: 0.7098 (Rapid Riser)
• Entry Zone: 0.6800 - 0.6950 (Wait for Pullback)
• Take Profit: 0.7400 / 0.7600
• Stop Loss: 0.6600
🎯 3. Uniswap ($UNI) | Price: 7.170
• Entry Zone: 6.95 - 7.05 (MA Support)
• Take Profit: 7.45 / 7.60
• Stop Loss: 6.80
⚠️ Tip: Low volume means slow moves but high risk of sudden sweeps. Keep your risk managed!
#DOT
#ASTER #UNI #TradingSetups #CryptoNews
6
47

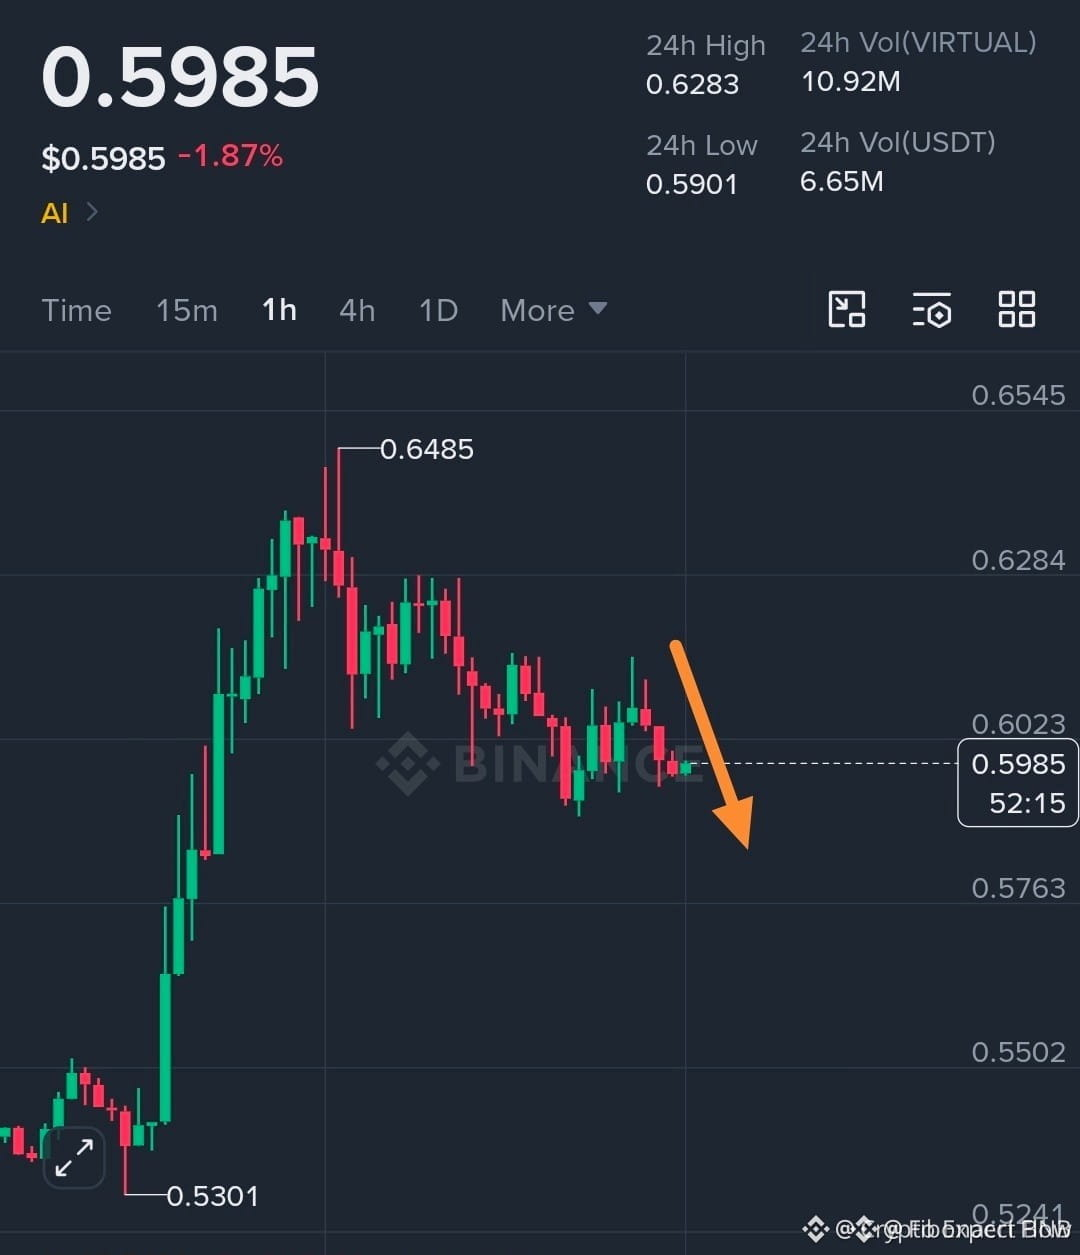
$VIRTUAL IS SETTING UP FOR A CLASSIC LIQUIDITY GRAB BEFORE THE DROP 🎯
This one feels like a trap setup. The market is clearly stacked with short positions and a quick squeeze to clear them makes sense before the real move lower. I've seen this pattern repeat itself too many times to ignore it.
Volume is thinning out on the daily and the bid support looks shaky. A push into overhead resistance would trigger the shorts and then leave buyers holding a bag.
Are you planning to take the long side into that squeeze or waiting for the rejection to short?
Not financial advice. Always manage your risk.
#VIRTUAL #ShortSetup #Crypto #TradingSetups
⚡
$VIRTUAL IS SETTING UP FOR A CLASSIC LIQUIDITY GRAB BEFORE THE DROP 🎯
This one feels like a trap setup. The market is clearly stacked with short positions and a quick squeeze to clear them makes sense before the real move lower. I've seen this pattern repeat itself too many times to ignore it.
Volume is thinning out on the daily and the bid support looks shaky. A push into overhead resistance would trigger the shorts and then leave buyers holding a bag.
Are you planning to take the long side into that squeeze or waiting for the rejection to short?
Not financial advice. Always manage your risk.
#VIRTUAL #ShortSetup #Crypto #TradingSetups
⚡
This one feels like a trap setup. The market is clearly stacked with short positions and a quick squeeze to clear them makes sense before the real move lower. I've seen this pattern repeat itself too many times to ignore it.
Volume is thinning out on the daily and the bid support looks shaky. A push into overhead resistance would trigger the shorts and then leave buyers holding a bag.
Are you planning to take the long side into that squeeze or waiting for the rejection to short?
Not financial advice. Always manage your risk.
#VIRTUAL #ShortSetup #Crypto #TradingSetups
⚡
36

🔥 Altcoin Quick Update: UP, AGT, and O Price Action
🔺 $UP
{alpha}(560x000008d2175f9aeaddb2430c26f8a6f73c5a0000)
Market structures are currently testing pivotal local inflection points. Keep a close eye on internal order blocks and trading volume changes to confirm if the immediate bias remains locked in consolidation or if a structural breakout is brewing.
📉 $AGT (Alaya Governance Token)
{future}(AGTUSDT)
Following a massive short-term surge that spiked over 100%, the asset has shifted into a heavy correction phase, down roughly 20% to 40% over the last week. Price is currently hovering around 0.0143 USDT to 0.0160 USDT. Momentum remains leaning toward a sell-side bias as the market cools off from recent highs, making a solid retest of lower demand zones critical before anticipating any structural trend reversal.
🔄 $O (o1.exchange)
{future}(OUSDT)
The token is showing signs of localized volatility, trading in the 0.53 USDT to 0.68 USDT range with active 24-hour trading volumes hitting over 11M USDT. While the asset has pulled back slightly on the daily chart, it holds a notable gain over the 7-day cumulative window. Watch the immediate 0.53 USDT to 0.60 USDT support shelf closely; maintaining structural integrity above this cluster leaves room for another test of local overhead resistance.
#CryptoTrading #Altcoins #TechnicalAnalysis #CryptoMarket #TradingSetups
🔥 Altcoin Quick Update: UP, AGT, and O Price Action
🔺 $UP
Market structures are currently testing pivotal local inflection points. Keep a close eye on internal order blocks and trading volume changes to confirm if the immediate bias remains locked in consolidation or if a structural breakout is brewing.
📉 $AGT (Alaya Governance Token)
Following a massive short-term surge that spiked over 100%, the asset has shifted into a heavy correction phase, down roughly 20% to 40% over the last week. Price is currently hovering around 0.0143 USDT to 0.0160 USDT. Momentum remains leaning toward a sell-side bias as the market cools off from recent highs, making a solid retest of lower demand zones critical before anticipating any structural trend reversal.
🔄 $O (o1.exchange)
The token is showing signs of localized volatility, trading in the 0.53 USDT to 0.68 USDT range with active 24-hour trading volumes hitting over 11M USDT. While the asset has pulled back slightly on the daily chart, it holds a notable gain over the 7-day cumulative window. Watch the immediate 0.53 USDT to 0.60 USDT support shelf closely; maintaining structural integrity above this cluster leaves room for another test of local overhead resistance.
#CryptoTrading #Altcoins #TechnicalAnalysis #CryptoMarket #TradingSetups
🔺 $UP
Market structures are currently testing pivotal local inflection points. Keep a close eye on internal order blocks and trading volume changes to confirm if the immediate bias remains locked in consolidation or if a structural breakout is brewing.
📉 $AGT (Alaya Governance Token)
Following a massive short-term surge that spiked over 100%, the asset has shifted into a heavy correction phase, down roughly 20% to 40% over the last week. Price is currently hovering around 0.0143 USDT to 0.0160 USDT. Momentum remains leaning toward a sell-side bias as the market cools off from recent highs, making a solid retest of lower demand zones critical before anticipating any structural trend reversal.
🔄 $O (o1.exchange)
The token is showing signs of localized volatility, trading in the 0.53 USDT to 0.68 USDT range with active 24-hour trading volumes hitting over 11M USDT. While the asset has pulled back slightly on the daily chart, it holds a notable gain over the 7-day cumulative window. Watch the immediate 0.53 USDT to 0.60 USDT support shelf closely; maintaining structural integrity above this cluster leaves room for another test of local overhead resistance.
#CryptoTrading #Altcoins #TechnicalAnalysis #CryptoMarket #TradingSetups
1
454

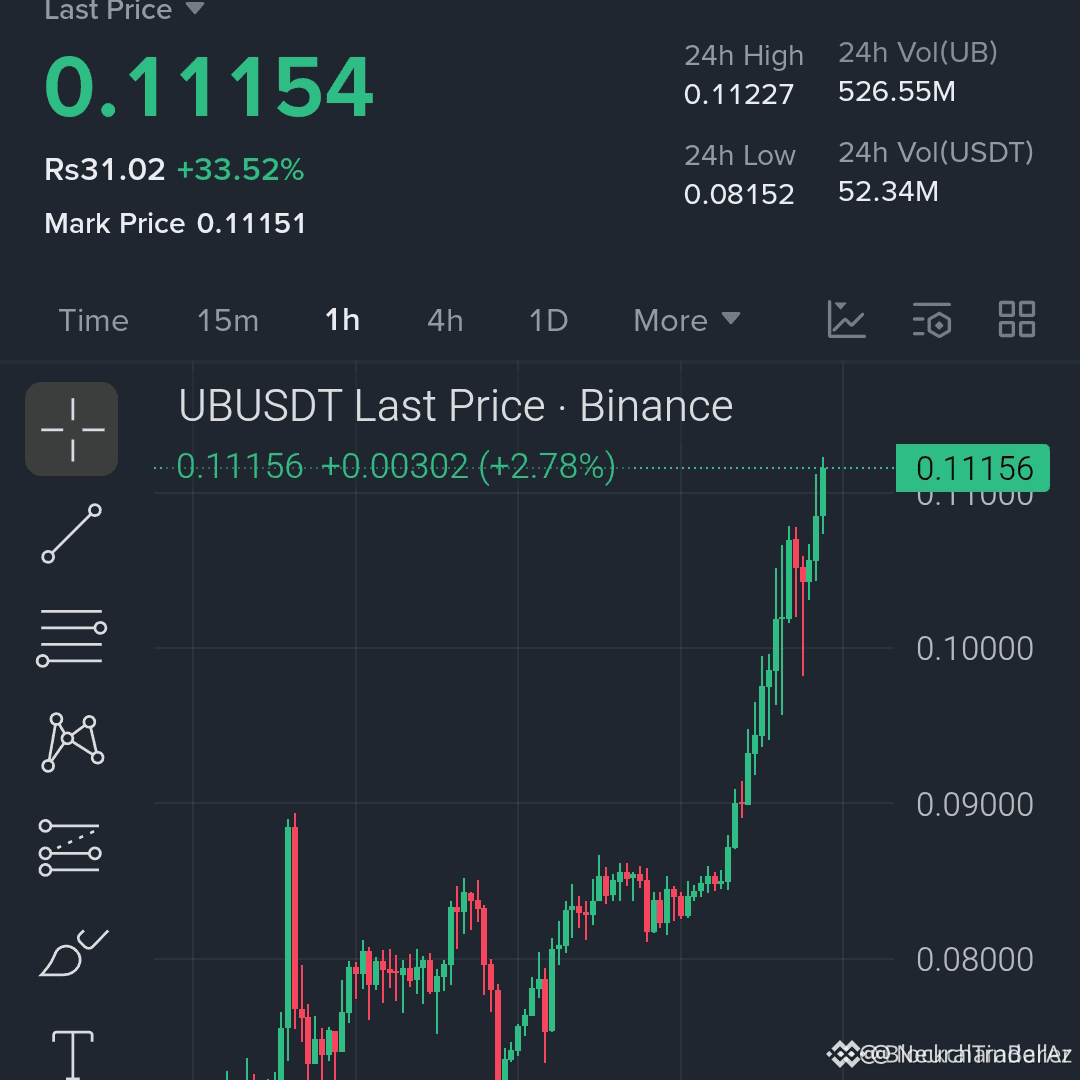
$UB LONG SETUP WITH THREE TARGETS AND CLEAR STOP LOSS 🔥
Entry: 0.1100 - 0.1120 🔥
Target: 0.1180 / 0.1250 / 0.1350 🚀
Stop Loss: 0.1030 ⚠️
This entry zone sits just above a confirmed order block on the 1H chart, where buyers have stepped in twice before. The stop at 0.1030 is placed below a recent liquidity sweep, giving the setup a clean invalidation. With three targets scaling out, the risk-reward ratio is shaped to protect profit while letting runners breathe.
Volume is picking up on the lower timeframes as price approaches the zone. Are you taking the full ladder or scaling in at the first target?
Not financial advice. Always manage your risk.
#UB #LongSetup #TradingSetups #CryptoAnalysis
🔥
$UB LONG SETUP WITH THREE TARGETS AND CLEAR STOP LOSS 🔥
Entry: 0.1100 - 0.1120 🔥
Target: 0.1180 / 0.1250 / 0.1350 🚀
Stop Loss: 0.1030 ⚠️
This entry zone sits just above a confirmed order block on the 1H chart, where buyers have stepped in twice before. The stop at 0.1030 is placed below a recent liquidity sweep, giving the setup a clean invalidation. With three targets scaling out, the risk-reward ratio is shaped to protect profit while letting runners breathe.
Volume is picking up on the lower timeframes as price approaches the zone. Are you taking the full ladder or scaling in at the first target?
Not financial advice. Always manage your risk.
#UB #LongSetup #TradingSetups #CryptoAnalysis
🔥
Entry: 0.1100 - 0.1120 🔥
Target: 0.1180 / 0.1250 / 0.1350 🚀
Stop Loss: 0.1030 ⚠️
This entry zone sits just above a confirmed order block on the 1H chart, where buyers have stepped in twice before. The stop at 0.1030 is placed below a recent liquidity sweep, giving the setup a clean invalidation. With three targets scaling out, the risk-reward ratio is shaped to protect profit while letting runners breathe.
Volume is picking up on the lower timeframes as price approaches the zone. Are you taking the full ladder or scaling in at the first target?
Not financial advice. Always manage your risk.
#UB #LongSetup #TradingSetups #CryptoAnalysis
🔥
56

Trading Signal: Jito Overbought Mean Reversion
Following an explosive intraday move of +19.21% hitting $0.825, $JTO
{spot}(JTOUSDT)
is printing a clear bearish shooting star candle on the hourly chart, signaling exhaustion.
Entry Zone: $0.820 - $0.840
Take Profit 1: $0.760
Take Profit 2: $0.710
Stop Loss: $0.875
🔗 Execute your bearish positions smoothly via the $JTO widget below. Support our channel with a Tip! 👇
#Jito #JTO #ShortSetup #BearishReversal #TradingSetups
Trading Signal: Jito Overbought Mean Reversion
Following an explosive intraday move of +19.21% hitting $0.825, $JTO
is printing a clear bearish shooting star candle on the hourly chart, signaling exhaustion.
Entry Zone: $0.820 - $0.840
Take Profit 1: $0.760
Take Profit 2: $0.710
Stop Loss: $0.875
🔗 Execute your bearish positions smoothly via the $JTO widget below. Support our channel with a Tip! 👇
#Jito #JTO #ShortSetup #BearishReversal #TradingSetups
Following an explosive intraday move of +19.21% hitting $0.825, $JTO
is printing a clear bearish shooting star candle on the hourly chart, signaling exhaustion.
Entry Zone: $0.820 - $0.840
Take Profit 1: $0.760
Take Profit 2: $0.710
Stop Loss: $0.875
🔗 Execute your bearish positions smoothly via the $JTO widget below. Support our channel with a Tip! 👇
#Jito #JTO #ShortSetup #BearishReversal #TradingSetups
1
77

·
--
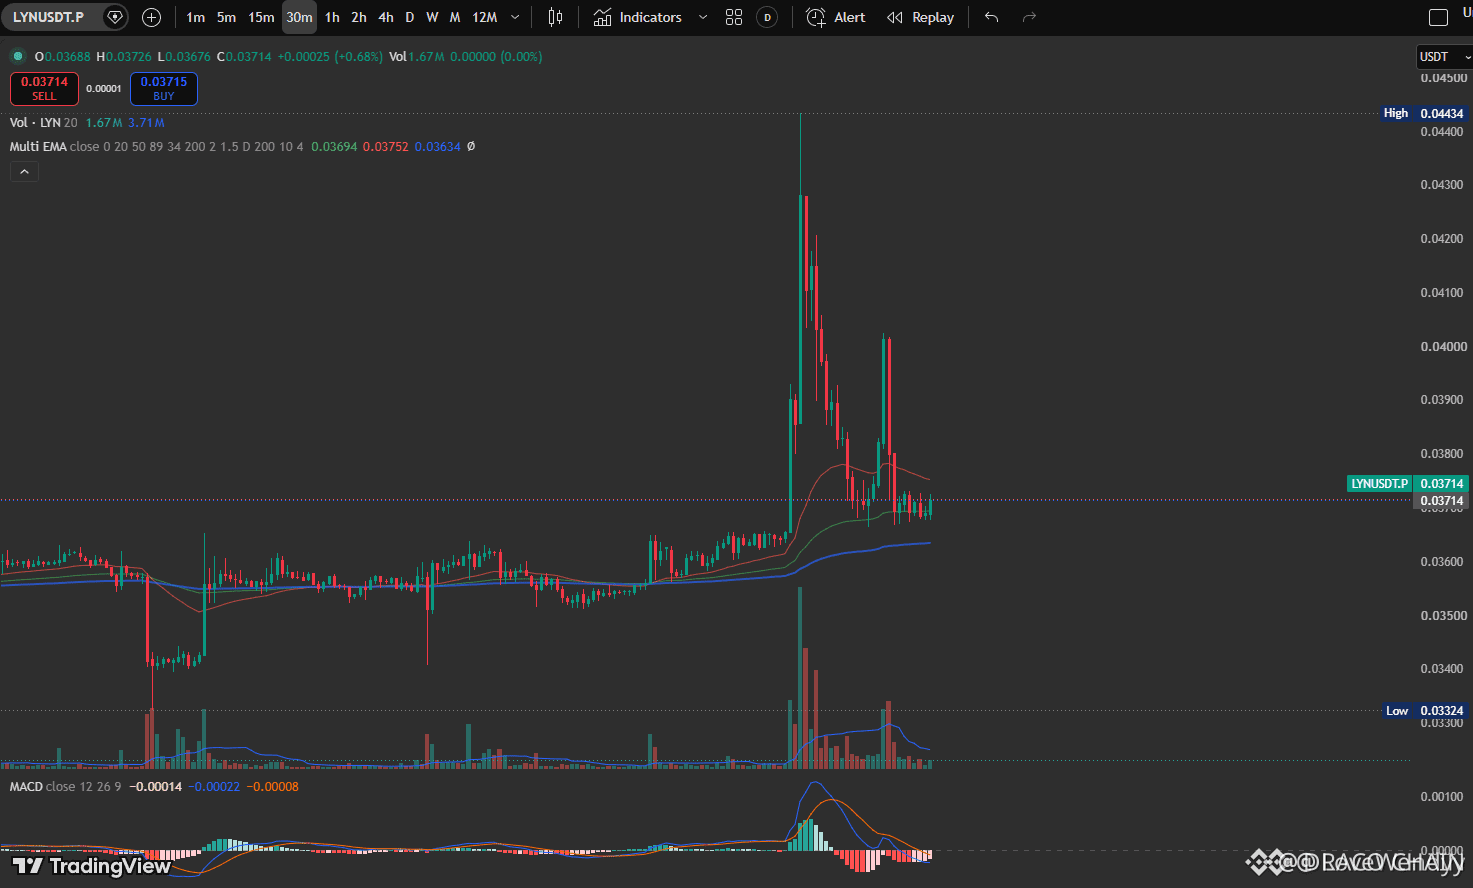
$LYN IS READY FOR A LONG SETUP - STRUCTURE CONFIRMS 🔥
LYN is showing the early structural readiness I look for before committing capital. The pattern aligns with previous accumulation phases that led to sustained moves higher. On the other hand, GWEI still lacks the same confirmation—price needs more time to build a clean setup before action.
Are you watching LYN for a potential long entry here?
Not financial advice. Always manage your risk.
#LYN #LongSetup #CryptoAnalysis #TradingSetups
🔥
$LYN IS READY FOR A LONG SETUP - STRUCTURE CONFIRMS 🔥
LYN is showing the early structural readiness I look for before committing capital. The pattern aligns with previous accumulation phases that led to sustained moves higher. On the other hand, GWEI still lacks the same confirmation—price needs more time to build a clean setup before action.
Are you watching LYN for a potential long entry here?
Not financial advice. Always manage your risk.
#LYN #LongSetup #CryptoAnalysis #TradingSetups
🔥
LYN is showing the early structural readiness I look for before committing capital. The pattern aligns with previous accumulation phases that led to sustained moves higher. On the other hand, GWEI still lacks the same confirmation—price needs more time to build a clean setup before action.
Are you watching LYN for a potential long entry here?
Not financial advice. Always manage your risk.
#LYN #LongSetup #CryptoAnalysis #TradingSetups
🔥
225

·
--
🔥 Top 3 High-Volume Movers: Breakdown & Liquidity Zones
While retail chases green wicks at vertical resistance, Smart Money waits for lower-timeframe liquidity retests. Here are three high-momentum assets currently driving trading volume across the exchange:
1. $ENA (Ethena) — Momentum Breakout
• Market Dynamic: Surging with a strong +40%+ volume expansion, testing key resistance zones.
• Execution Strategy: Avoid market-buying near local tops. Wait for a pullback to confirm support before evaluating long entries.
2. $PEOPLE (ConstitutionDAO) — High Volatility Inflow
• Market Dynamic: Printing sharp vertical candles on high speculative volume (+37% to +45%).
• Execution Strategy: Watch for stop-hunts above recent high wicks. Look for a clean sweep and retest of lower demand zones.
3. $NEIRO — Meme Runner Expansion
• Market Dynamic: Leading meme-sector turnover with over +44% intraday gains.
• Execution Strategy: High volatility assets require strict risk management. Define invalidation below structural support before entering.
How are you managing these volatile expansions today?
👇 Drop your trade plans below and click the ticker tags to trade directly!
#writetoearn #cryptotrading #priceaction #TradingSetups #BinanceSquare
{future}(ENAUSDT)
{future}(PEOPLEUSDT)
{future}(NEIROUSDT)
🔥 Top 3 High-Volume Movers: Breakdown & Liquidity Zones
While retail chases green wicks at vertical resistance, Smart Money waits for lower-timeframe liquidity retests. Here are three high-momentum assets currently driving trading volume across the exchange:
1. $ENA (Ethena) — Momentum Breakout
• Market Dynamic: Surging with a strong +40%+ volume expansion, testing key resistance zones.
• Execution Strategy: Avoid market-buying near local tops. Wait for a pullback to confirm support before evaluating long entries.
2. $PEOPLE (ConstitutionDAO) — High Volatility Inflow
• Market Dynamic: Printing sharp vertical candles on high speculative volume (+37% to +45%).
• Execution Strategy: Watch for stop-hunts above recent high wicks. Look for a clean sweep and retest of lower demand zones.
3. $NEIRO — Meme Runner Expansion
• Market Dynamic: Leading meme-sector turnover with over +44% intraday gains.
• Execution Strategy: High volatility assets require strict risk management. Define invalidation below structural support before entering.
How are you managing these volatile expansions today?
👇 Drop your trade plans below and click the ticker tags to trade directly!
#writetoearn #cryptotrading #priceaction #TradingSetups #BinanceSquare
While retail chases green wicks at vertical resistance, Smart Money waits for lower-timeframe liquidity retests. Here are three high-momentum assets currently driving trading volume across the exchange:
1. $ENA (Ethena) — Momentum Breakout
• Market Dynamic: Surging with a strong +40%+ volume expansion, testing key resistance zones.
• Execution Strategy: Avoid market-buying near local tops. Wait for a pullback to confirm support before evaluating long entries.
2. $PEOPLE (ConstitutionDAO) — High Volatility Inflow
• Market Dynamic: Printing sharp vertical candles on high speculative volume (+37% to +45%).
• Execution Strategy: Watch for stop-hunts above recent high wicks. Look for a clean sweep and retest of lower demand zones.
3. $NEIRO — Meme Runner Expansion
• Market Dynamic: Leading meme-sector turnover with over +44% intraday gains.
• Execution Strategy: High volatility assets require strict risk management. Define invalidation below structural support before entering.
How are you managing these volatile expansions today?
👇 Drop your trade plans below and click the ticker tags to trade directly!
#writetoearn #cryptotrading #priceaction #TradingSetups #BinanceSquare
🟢 Waiting for retests
64%
🔴 Chasing breakouts
36%
⚪ Sitting in stablecoins
0%
11 votes • Voting closed
3
2.9k

🚨 DIRECT MARKET ENTRY: Riding the $ETH Breakout Momentum 📊
Following the Nasdaq decoupling, macro capital flows are aggressively concentrating in crypto liquidity zones. I am deploying private capital into this continuation structure.
🔍 The Setup Trigger:
The 4-hour chart confirms an aggressive structural breakout above local consolidation resistance. Daily volume indicators are running 250% higher than the 7-day baseline.
🛠️ Live Execution Parameters:
🔹 Asset Tag: $ETH / USDT
🔹 Direction: LONG (Trend Continuation)
🔹 Entry Range: [Insert Your Entry Price, e.g., $2,400 - $2,420]
🔹 Take-Profit 1: [Insert Target 1, e.g., $2,550]
🔹 Take-Profit 2: [Insert Target 2, e.g., $2,680]
🔹 Take-Profit 3 (Macro Target): $4,000
🔹 Hard Stop-Loss (Invalidation Zone): [Insert Stop, e.g., Below $2,340]
⚠️ Capital Allocation Guardrail:
Keep position sizing conservative. Leverage parameters should remain restricted between 3X and 5X maximum. High leverage destroys accounts during decoupling volatility phases.
My real-time live trading ledger changes and copy-trading parameters are tracked directly via the link pinned in my profile bio. 👇
Are you cloning this directional breakout entry, or are you sitting in cash waiting for a deeper retest? Comment your play below! 👇
#CryptoSignals #EthereumPrice #TradingSetups $ETH
🚨 DIRECT MARKET ENTRY: Riding the $ETH Breakout Momentum 📊
Following the Nasdaq decoupling, macro capital flows are aggressively concentrating in crypto liquidity zones. I am deploying private capital into this continuation structure.
🔍 The Setup Trigger:
The 4-hour chart confirms an aggressive structural breakout above local consolidation resistance. Daily volume indicators are running 250% higher than the 7-day baseline.
🛠️ Live Execution Parameters:
🔹 Asset Tag: $ETH / USDT
🔹 Direction: LONG (Trend Continuation)
🔹 Entry Range: [Insert Your Entry Price, e.g., $2,400 - $2,420]
🔹 Take-Profit 1: [Insert Target 1, e.g., $2,550]
🔹 Take-Profit 2: [Insert Target 2, e.g., $2,680]
🔹 Take-Profit 3 (Macro Target): $4,000
🔹 Hard Stop-Loss (Invalidation Zone): [Insert Stop, e.g., Below $2,340]
⚠️ Capital Allocation Guardrail:
Keep position sizing conservative. Leverage parameters should remain restricted between 3X and 5X maximum. High leverage destroys accounts during decoupling volatility phases.
My real-time live trading ledger changes and copy-trading parameters are tracked directly via the link pinned in my profile bio. 👇
Are you cloning this directional breakout entry, or are you sitting in cash waiting for a deeper retest? Comment your play below! 👇
#CryptoSignals #EthereumPrice #TradingSetups $ETH
Following the Nasdaq decoupling, macro capital flows are aggressively concentrating in crypto liquidity zones. I am deploying private capital into this continuation structure.
🔍 The Setup Trigger:
The 4-hour chart confirms an aggressive structural breakout above local consolidation resistance. Daily volume indicators are running 250% higher than the 7-day baseline.
🛠️ Live Execution Parameters:
🔹 Asset Tag: $ETH / USDT
🔹 Direction: LONG (Trend Continuation)
🔹 Entry Range: [Insert Your Entry Price, e.g., $2,400 - $2,420]
🔹 Take-Profit 1: [Insert Target 1, e.g., $2,550]
🔹 Take-Profit 2: [Insert Target 2, e.g., $2,680]
🔹 Take-Profit 3 (Macro Target): $4,000
🔹 Hard Stop-Loss (Invalidation Zone): [Insert Stop, e.g., Below $2,340]
⚠️ Capital Allocation Guardrail:
Keep position sizing conservative. Leverage parameters should remain restricted between 3X and 5X maximum. High leverage destroys accounts during decoupling volatility phases.
My real-time live trading ledger changes and copy-trading parameters are tracked directly via the link pinned in my profile bio. 👇
Are you cloning this directional breakout entry, or are you sitting in cash waiting for a deeper retest? Comment your play below! 👇
#CryptoSignals #EthereumPrice #TradingSetups $ETH
30

·
--
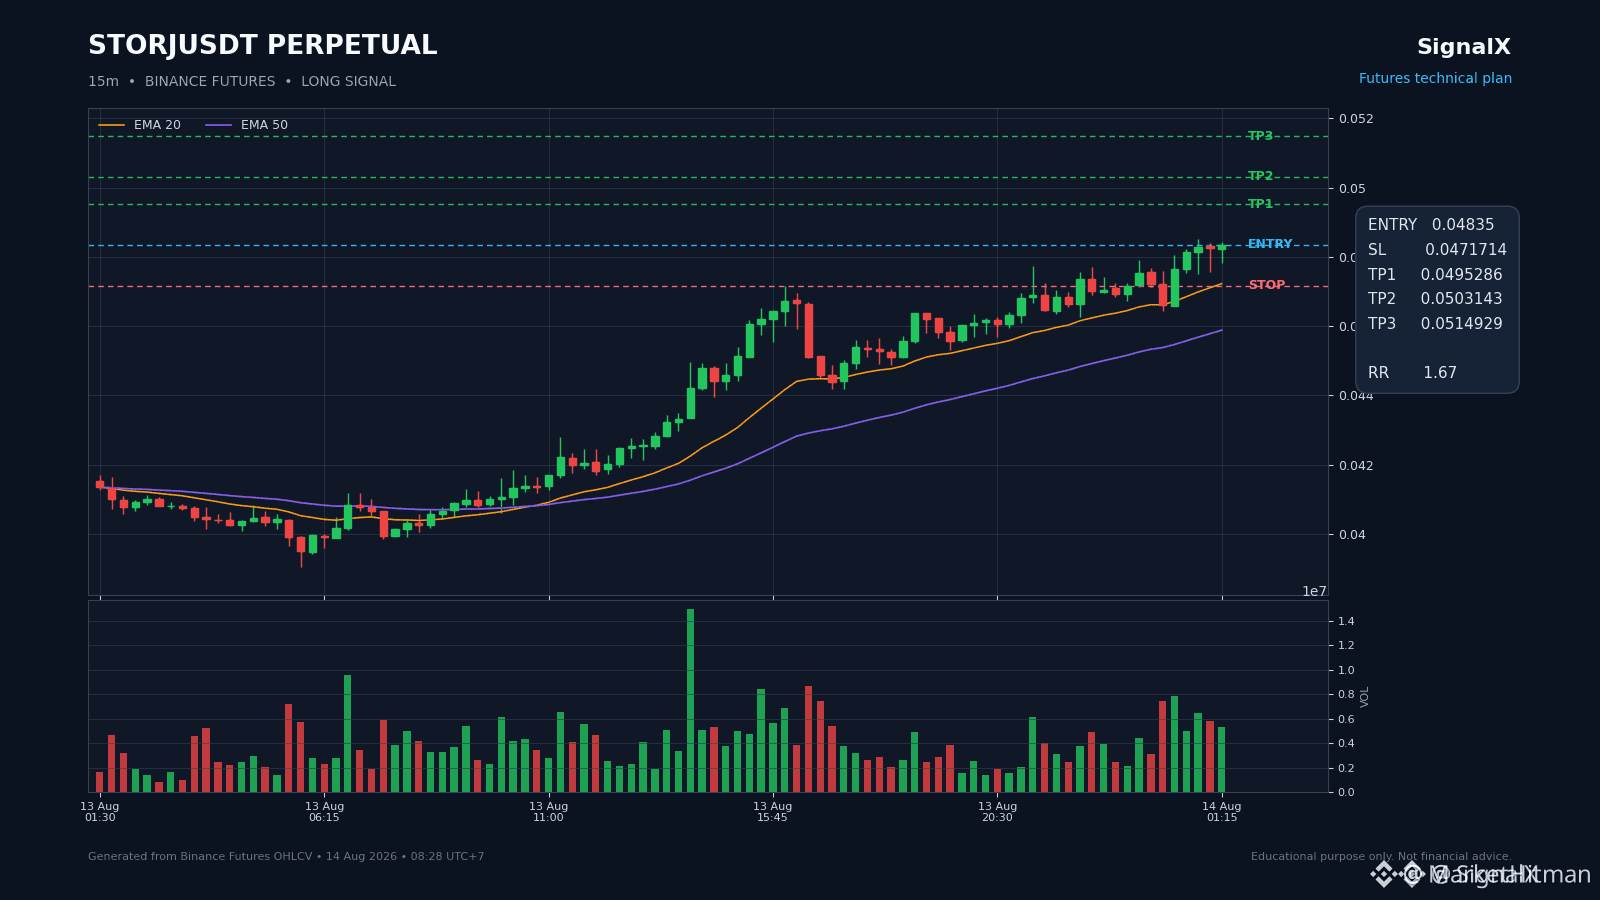
$STORJ LONG — QUIET MOMENTUM. LIQUIDITY AWAITS. 🔍📈
ENTRY: 0.04835 🟢
STOP LOSS: 0.0471714 🛑
TP1: 0.0495286 🎯
TP2: 0.0503143 🎯
TP3: 0.0514929 🎯
Quiet momentum is accumulating beneath the surface. 🧐 Buyers are defending the current range, and a recent rejection confirms institutional interest at these lows. Liquidity rests just above the nearby highs — and smart money often hunts exactly that pool before pushing further.
The structure favors patience over chasing. ⏳ Waiting for confirmation improves the risk-reward profile significantly, allowing the entry to align with displacement instead of guessing the turn. When price respects the range and builds momentum into liquidity, the path to the next zone becomes cleaner.
Can momentum carry through the next liquidity pocket? Drop your read below. 📊
⚠️ Not financial advice. Always manage your risk. 🛡️
🏷️ $STORJ #STORJ #LiquidityHunt #SmartMoney #TradingSetups
📈🔍
$STORJ LONG — QUIET MOMENTUM. LIQUIDITY AWAITS. 🔍📈
ENTRY: 0.04835 🟢
STOP LOSS: 0.0471714 🛑
TP1: 0.0495286 🎯
TP2: 0.0503143 🎯
TP3: 0.0514929 🎯
Quiet momentum is accumulating beneath the surface. 🧐 Buyers are defending the current range, and a recent rejection confirms institutional interest at these lows. Liquidity rests just above the nearby highs — and smart money often hunts exactly that pool before pushing further.
The structure favors patience over chasing. ⏳ Waiting for confirmation improves the risk-reward profile significantly, allowing the entry to align with displacement instead of guessing the turn. When price respects the range and builds momentum into liquidity, the path to the next zone becomes cleaner.
Can momentum carry through the next liquidity pocket? Drop your read below. 📊
⚠️ Not financial advice. Always manage your risk. 🛡️
🏷️ $STORJ #STORJ #LiquidityHunt #SmartMoney #TradingSetups
📈🔍
ENTRY: 0.04835 🟢
STOP LOSS: 0.0471714 🛑
TP1: 0.0495286 🎯
TP2: 0.0503143 🎯
TP3: 0.0514929 🎯
Quiet momentum is accumulating beneath the surface. 🧐 Buyers are defending the current range, and a recent rejection confirms institutional interest at these lows. Liquidity rests just above the nearby highs — and smart money often hunts exactly that pool before pushing further.
The structure favors patience over chasing. ⏳ Waiting for confirmation improves the risk-reward profile significantly, allowing the entry to align with displacement instead of guessing the turn. When price respects the range and builds momentum into liquidity, the path to the next zone becomes cleaner.
Can momentum carry through the next liquidity pocket? Drop your read below. 📊
⚠️ Not financial advice. Always manage your risk. 🛡️
🏷️ $STORJ #STORJ #LiquidityHunt #SmartMoney #TradingSetups
📈🔍
88
Log in to explore more content
Join global crypto users on Binance Square
⚡️ Get latest and useful information about crypto.
💬 Trusted by the world’s largest crypto exchange.
👍 Discover real insights from verified creators.
Email / Phone number
Trending Topics
1
#CanBTCReboundAfterFallingBelow60K?
369,886 views
1,555 Discussing
2
#GlobalStocksFaceLongestLosingStreakSince2023
122,357 views
1,094 Discussing
3
#BlackRockIBITPostsRecord$541MSingleDayOutflow
692 views
17 Discussing
4
#AnthropicPlungesTowardIPOPriceonDay2
59,580 views
598 Discussing
5
#TwentyOneCapitalAdds172.25BTC
11,483 views
162 Discussing
6
#HKBillWouldExcludeTokenizedDepositsFromVirtualAssets
972 views
14 Discussing
7
#BNBDropsBelow540USDTWith8.46%DailyDecline
32,808 views
278 Discussing
8
#HKBillProposesHK$100KFineForUnauthorizedCryptoTitles
1,056 views
14 Discussing
9
#BitMineFaces$10.1BUnrealizedETHLoss
2,007 views
18 Discussing
10
#StrategyReports$35BNetReserves
1,983 views
18 Discussing