
#btcusdt
btcusdt
14.1M views
28,964 Discussing
Hot
Latest

🚨 BTC BULLISH RECOVERY SETUP? 👀📈
I'm watching a potential LONG opportunity on $BTC.
🎯 Take Profit: $67,200
🛑 Stop Loss: $63,175
After the recent heavy sell-off, Bitcoin has been consolidating around the $64K–$65K range instead of continuing its downward move.
What's interesting is that buyers continue to defend lower levels, showing signs of buying interest.
Now BTC is approaching the upper end of its range.
A clean breakout above $65,500, followed by a strong hold, could open the door for further upside toward $67,200.
However, confirmation is important. If BTC fails to hold support, the bullish setup could weaken.
What's your outlook? Are we heading toward $67K or preparing for another correction? 👇$BTC
#BTC #Bitcoin #CryptoMarket #TradingAnalysis #BinanceSquare #BTCUSDT
Not financial advice. Always manage risk and do your own research.
🚨 BTC BULLISH RECOVERY SETUP? 👀📈
I'm watching a potential LONG opportunity on $BTC .
🎯 Take Profit: $67,200
🛑 Stop Loss: $63,175
After the recent heavy sell-off, Bitcoin has been consolidating around the $64K–$65K range instead of continuing its downward move.
What's interesting is that buyers continue to defend lower levels, showing signs of buying interest.
Now BTC is approaching the upper end of its range.
A clean breakout above $65,500, followed by a strong hold, could open the door for further upside toward $67,200.
However, confirmation is important. If BTC fails to hold support, the bullish setup could weaken.
What's your outlook? Are we heading toward $67K or preparing for another correction? 👇$BTC
#BTC #Bitcoin #CryptoMarket #TradingAnalysis #BinanceSquare #BTCUSDT
Not financial advice. Always manage risk and do your own research.
I'm watching a potential LONG opportunity on $BTC .
🎯 Take Profit: $67,200
🛑 Stop Loss: $63,175
After the recent heavy sell-off, Bitcoin has been consolidating around the $64K–$65K range instead of continuing its downward move.
What's interesting is that buyers continue to defend lower levels, showing signs of buying interest.
Now BTC is approaching the upper end of its range.
A clean breakout above $65,500, followed by a strong hold, could open the door for further upside toward $67,200.
However, confirmation is important. If BTC fails to hold support, the bullish setup could weaken.
What's your outlook? Are we heading toward $67K or preparing for another correction? 👇$BTC
#BTC #Bitcoin #CryptoMarket #TradingAnalysis #BinanceSquare #BTCUSDT
Not financial advice. Always manage risk and do your own research.
1
71

·
--
Bearish
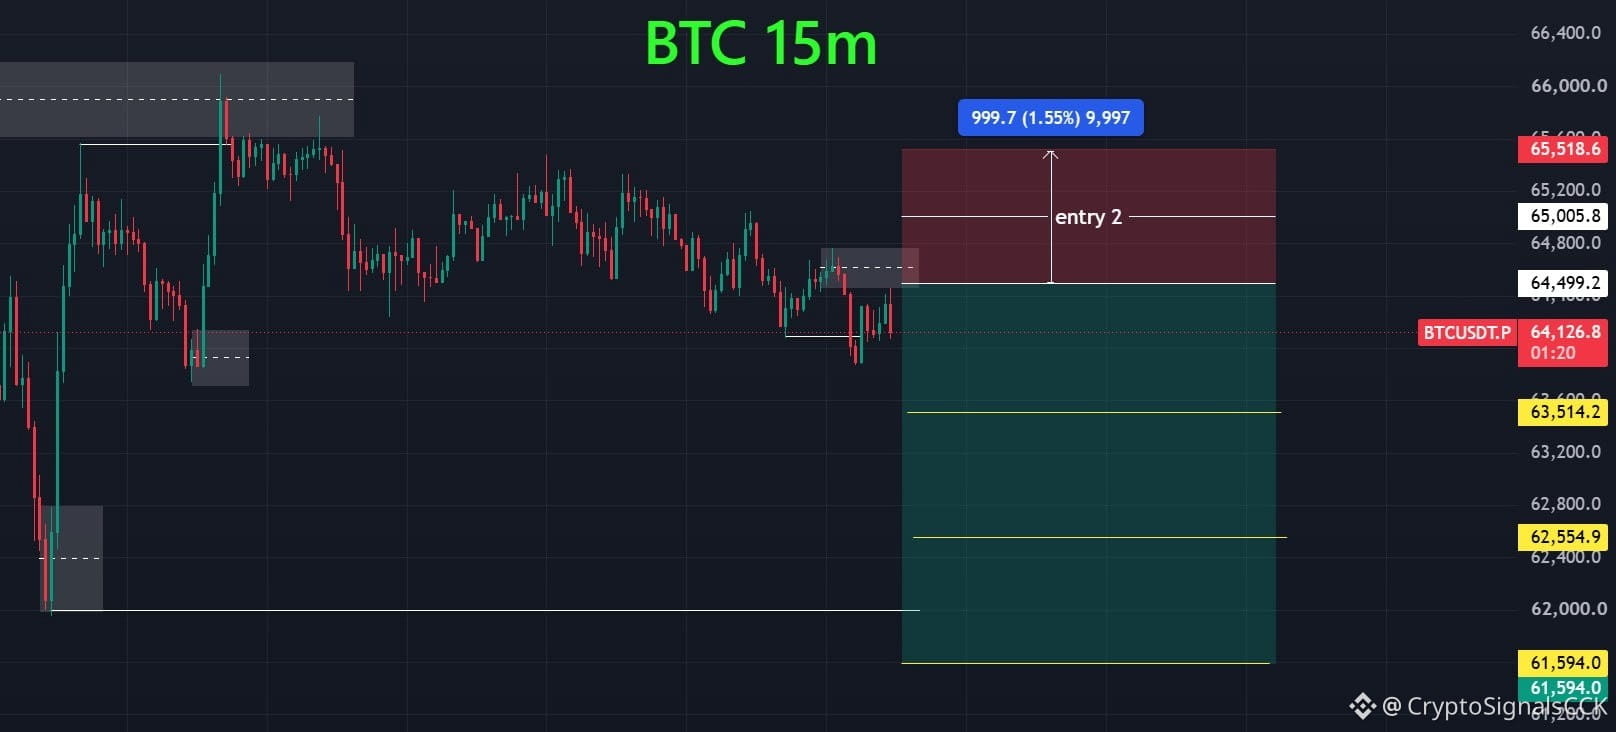
$BTC short from this 64K zone. 1:1 to 1:3R on the radar.
• TP1: 63514
• SL: 65518 (-1.5%)
Bitcoin couldn't break the 65.5K supply today and got rejected again.
Nearest BTCUSDT OB sits in the 63K–62K range, the main destination for this setup.
#btcshort #BTCUSDT #CryptoSignalsCCK
$BTC short from this 64K zone. 1:1 to 1:3R on the radar.
• TP1: 63514
• SL: 65518 (-1.5%)
Bitcoin couldn't break the 65.5K supply today and got rejected again.
Nearest BTCUSDT OB sits in the 63K–62K range, the main destination for this setup.
#btcshort #BTCUSDT #CryptoSignalsCCK
• TP1: 63514
• SL: 65518 (-1.5%)
Bitcoin couldn't break the 65.5K supply today and got rejected again.
Nearest BTCUSDT OB sits in the 63K–62K range, the main destination for this setup.
#btcshort #BTCUSDT #CryptoSignalsCCK
1
434

·
--
Bullish
🔴 $BTC
{future}(BTCUSDT)
/USDT — BEARS IN CONTROL? SHORT SETUP TO WATCH!
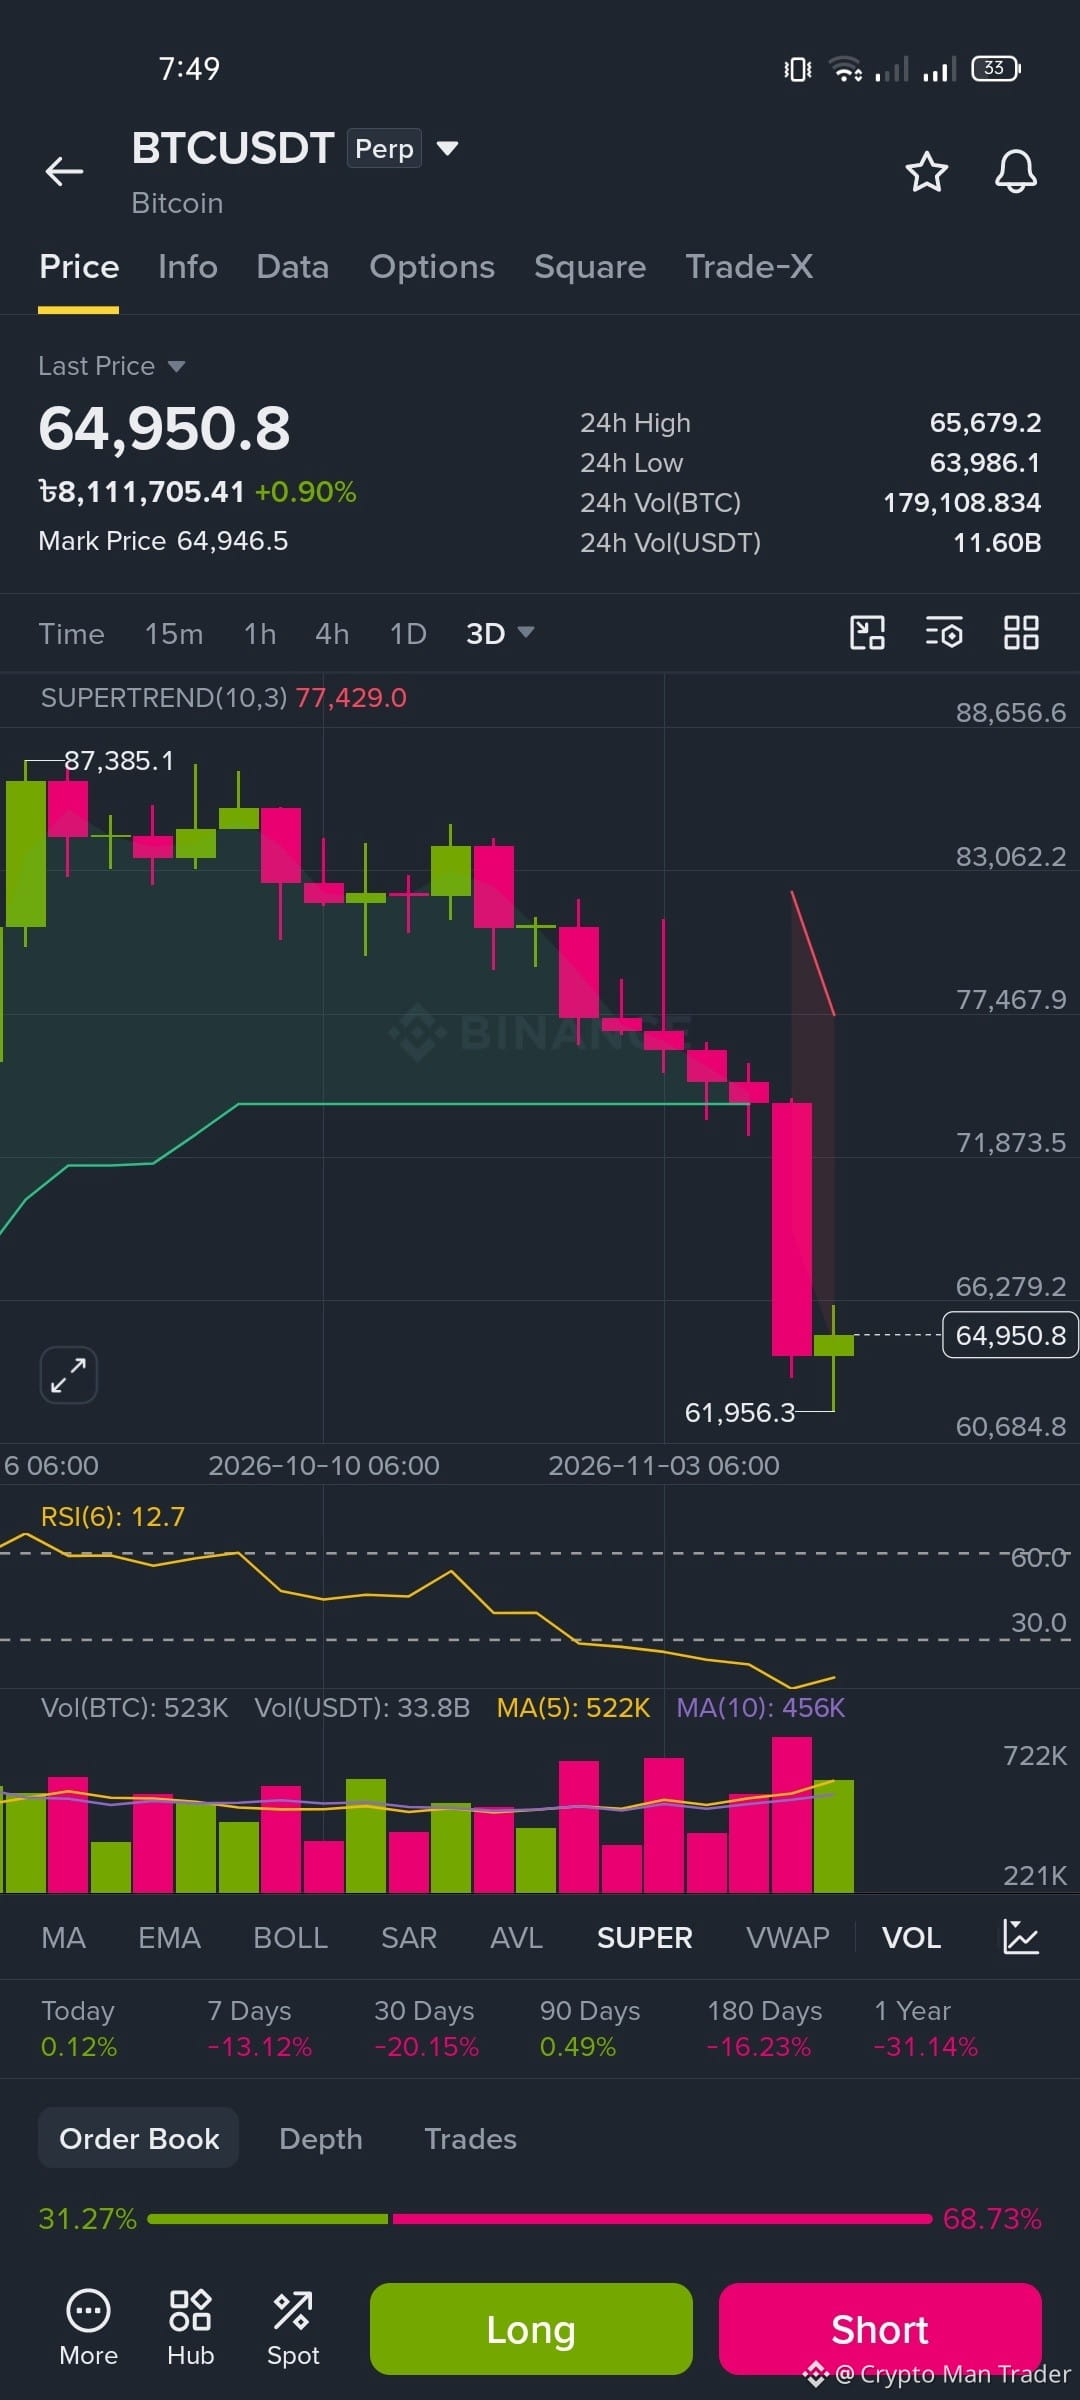
Bitcoin is trading below the bearish EMA50 and EMA200 stacks on both the 4H and 1H charts, suggesting continued downside pressure.
📉 BTC SHORT TRADE SETUP
Entry Zone: $64,891.66 – $64,998.14
🎯 TP1: $63,970.66 (-1.5%) 🎯 TP2: $63,321.16 (-2.5%) 🎯 TP3: $62,346.92 (-4.0%)
🛑 Stop Loss: $66,243.89 (+2.0%)
Market Analysis:
4H trend remains bearish.
Price is below EMA50 and EMA200.
15M ADX at 27.0 indicates active momentum, but buyers are also showing strength.
Moderate conviction only — avoid oversized positions.
Trade Management:
Close 50% at TP1.
Close 25% at TP2.
Close the remaining 25% at TP3.
After TP1, consider moving SL to breakeven.
⚠️ Watch for a bullish reversal before entering. Risk management is essential.
🔥 BIG QUESTION: Will BTC continue falling toward $62,346, or will bulls stage a comeback?
#BTC #Bitcoin #BTCUSDT #CryptoTrading #Binance #ShortSignal
🔴 $BTC
/USDT — BEARS IN CONTROL? SHORT SETUP TO WATCH!
Bitcoin is trading below the bearish EMA50 and EMA200 stacks on both the 4H and 1H charts, suggesting continued downside pressure.
📉 BTC SHORT TRADE SETUP
Entry Zone: $64,891.66 – $64,998.14
🎯 TP1: $63,970.66 (-1.5%) 🎯 TP2: $63,321.16 (-2.5%) 🎯 TP3: $62,346.92 (-4.0%)
🛑 Stop Loss: $66,243.89 (+2.0%)
Market Analysis:
4H trend remains bearish.
Price is below EMA50 and EMA200.
15M ADX at 27.0 indicates active momentum, but buyers are also showing strength.
Moderate conviction only — avoid oversized positions.
Trade Management:
Close 50% at TP1.
Close 25% at TP2.
Close the remaining 25% at TP3.
After TP1, consider moving SL to breakeven.
⚠️ Watch for a bullish reversal before entering. Risk management is essential.
🔥 BIG QUESTION: Will BTC continue falling toward $62,346, or will bulls stage a comeback?
#BTC #Bitcoin #BTCUSDT #CryptoTrading #Binance #ShortSignal
/USDT — BEARS IN CONTROL? SHORT SETUP TO WATCH!
Bitcoin is trading below the bearish EMA50 and EMA200 stacks on both the 4H and 1H charts, suggesting continued downside pressure.
📉 BTC SHORT TRADE SETUP
Entry Zone: $64,891.66 – $64,998.14
🎯 TP1: $63,970.66 (-1.5%) 🎯 TP2: $63,321.16 (-2.5%) 🎯 TP3: $62,346.92 (-4.0%)
🛑 Stop Loss: $66,243.89 (+2.0%)
Market Analysis:
4H trend remains bearish.
Price is below EMA50 and EMA200.
15M ADX at 27.0 indicates active momentum, but buyers are also showing strength.
Moderate conviction only — avoid oversized positions.
Trade Management:
Close 50% at TP1.
Close 25% at TP2.
Close the remaining 25% at TP3.
After TP1, consider moving SL to breakeven.
⚠️ Watch for a bullish reversal before entering. Risk management is essential.
🔥 BIG QUESTION: Will BTC continue falling toward $62,346, or will bulls stage a comeback?
#BTC #Bitcoin #BTCUSDT #CryptoTrading #Binance #ShortSignal
4

🚨 BITCOIN $BTC — BIG MOVE WATCH! 🚀
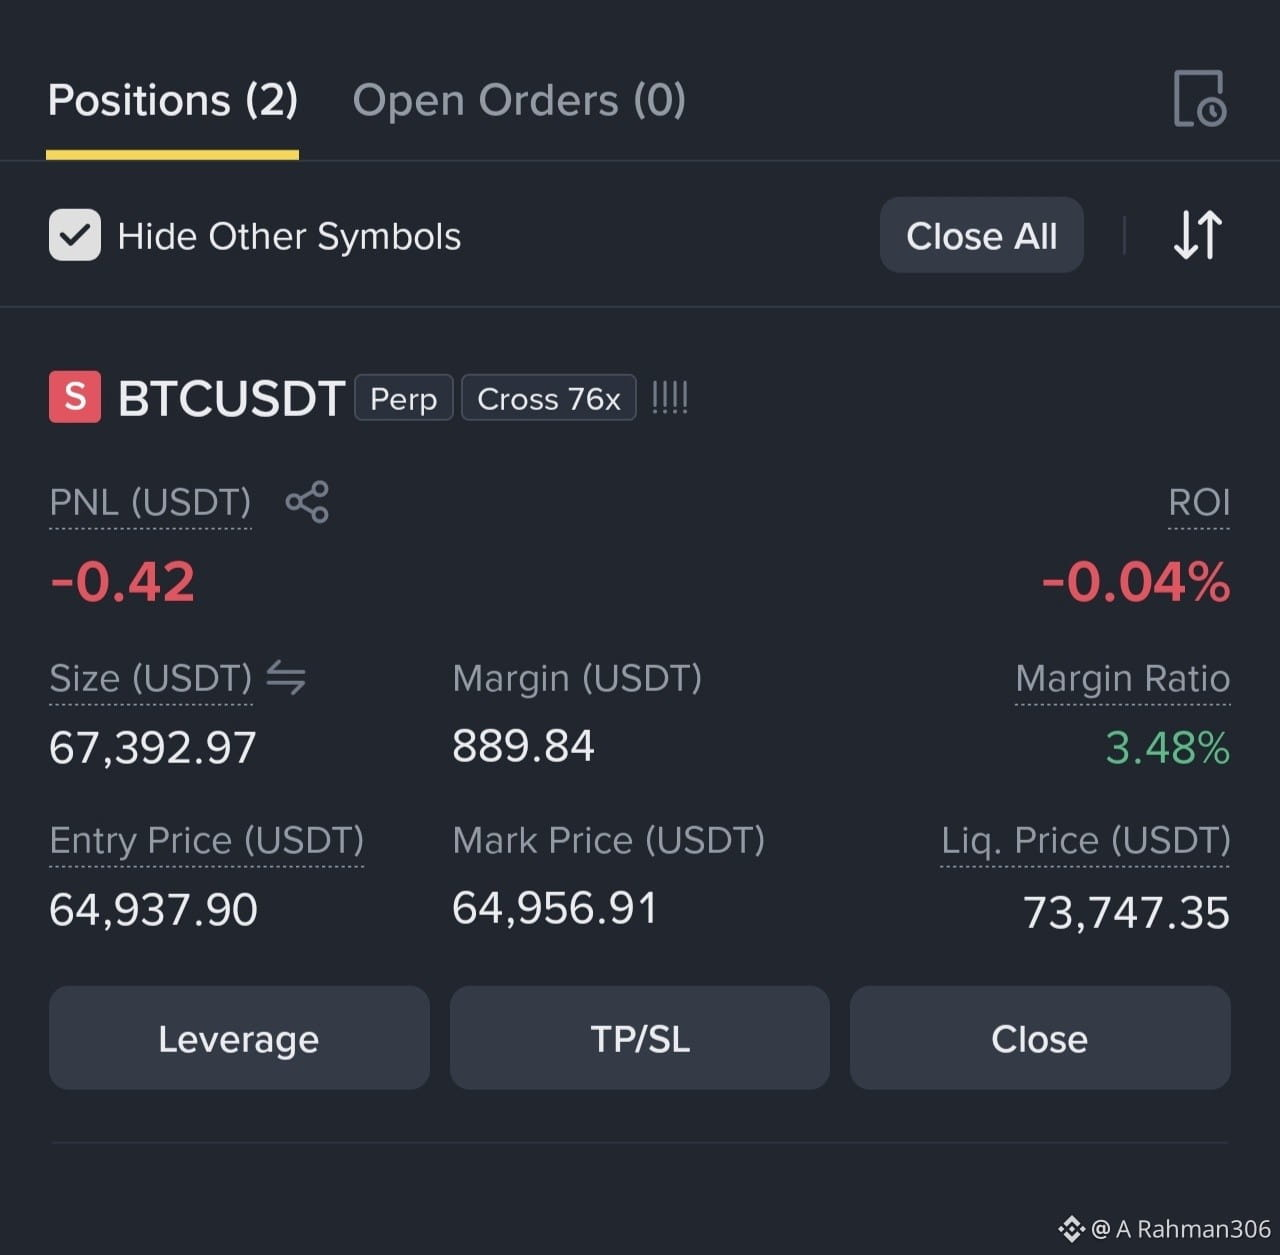
₿ BTC is trading near $64,890!
📊 24H Change: +0.76%
🔥 KEY LEVELS:
Resistance: $65,600
Support: $63,800
🎯 Strategy:
Bullish above $65,600 after confirmation.
Bearish below $63,800 after confirmation.
⚠️ Wait for breakout confirmation. Manage your risk!
Are you TEAM BTC BULLS or BEARS?
#bitcoin #BinanceSquare #cryptotrading #BTCUSDT
🚨 BITCOIN $BTC — BIG MOVE WATCH! 🚀
₿ BTC is trading near $64,890!
📊 24H Change: +0.76%
🔥 KEY LEVELS:
Resistance: $65,600
Support: $63,800
🎯 Strategy:
Bullish above $65,600 after confirmation.
Bearish below $63,800 after confirmation.
⚠️ Wait for breakout confirmation. Manage your risk!
Are you TEAM BTC BULLS or BEARS?
#bitcoin #BinanceSquare #cryptotrading #BTCUSDT
₿ BTC is trading near $64,890!
📊 24H Change: +0.76%
🔥 KEY LEVELS:
Resistance: $65,600
Support: $63,800
🎯 Strategy:
Bullish above $65,600 after confirmation.
Bearish below $63,800 after confirmation.
⚠️ Wait for breakout confirmation. Manage your risk!
Are you TEAM BTC BULLS or BEARS?
#bitcoin #BinanceSquare #cryptotrading #BTCUSDT
11


📉 Bitcoin Weekly Analysis – Patience Is Key!
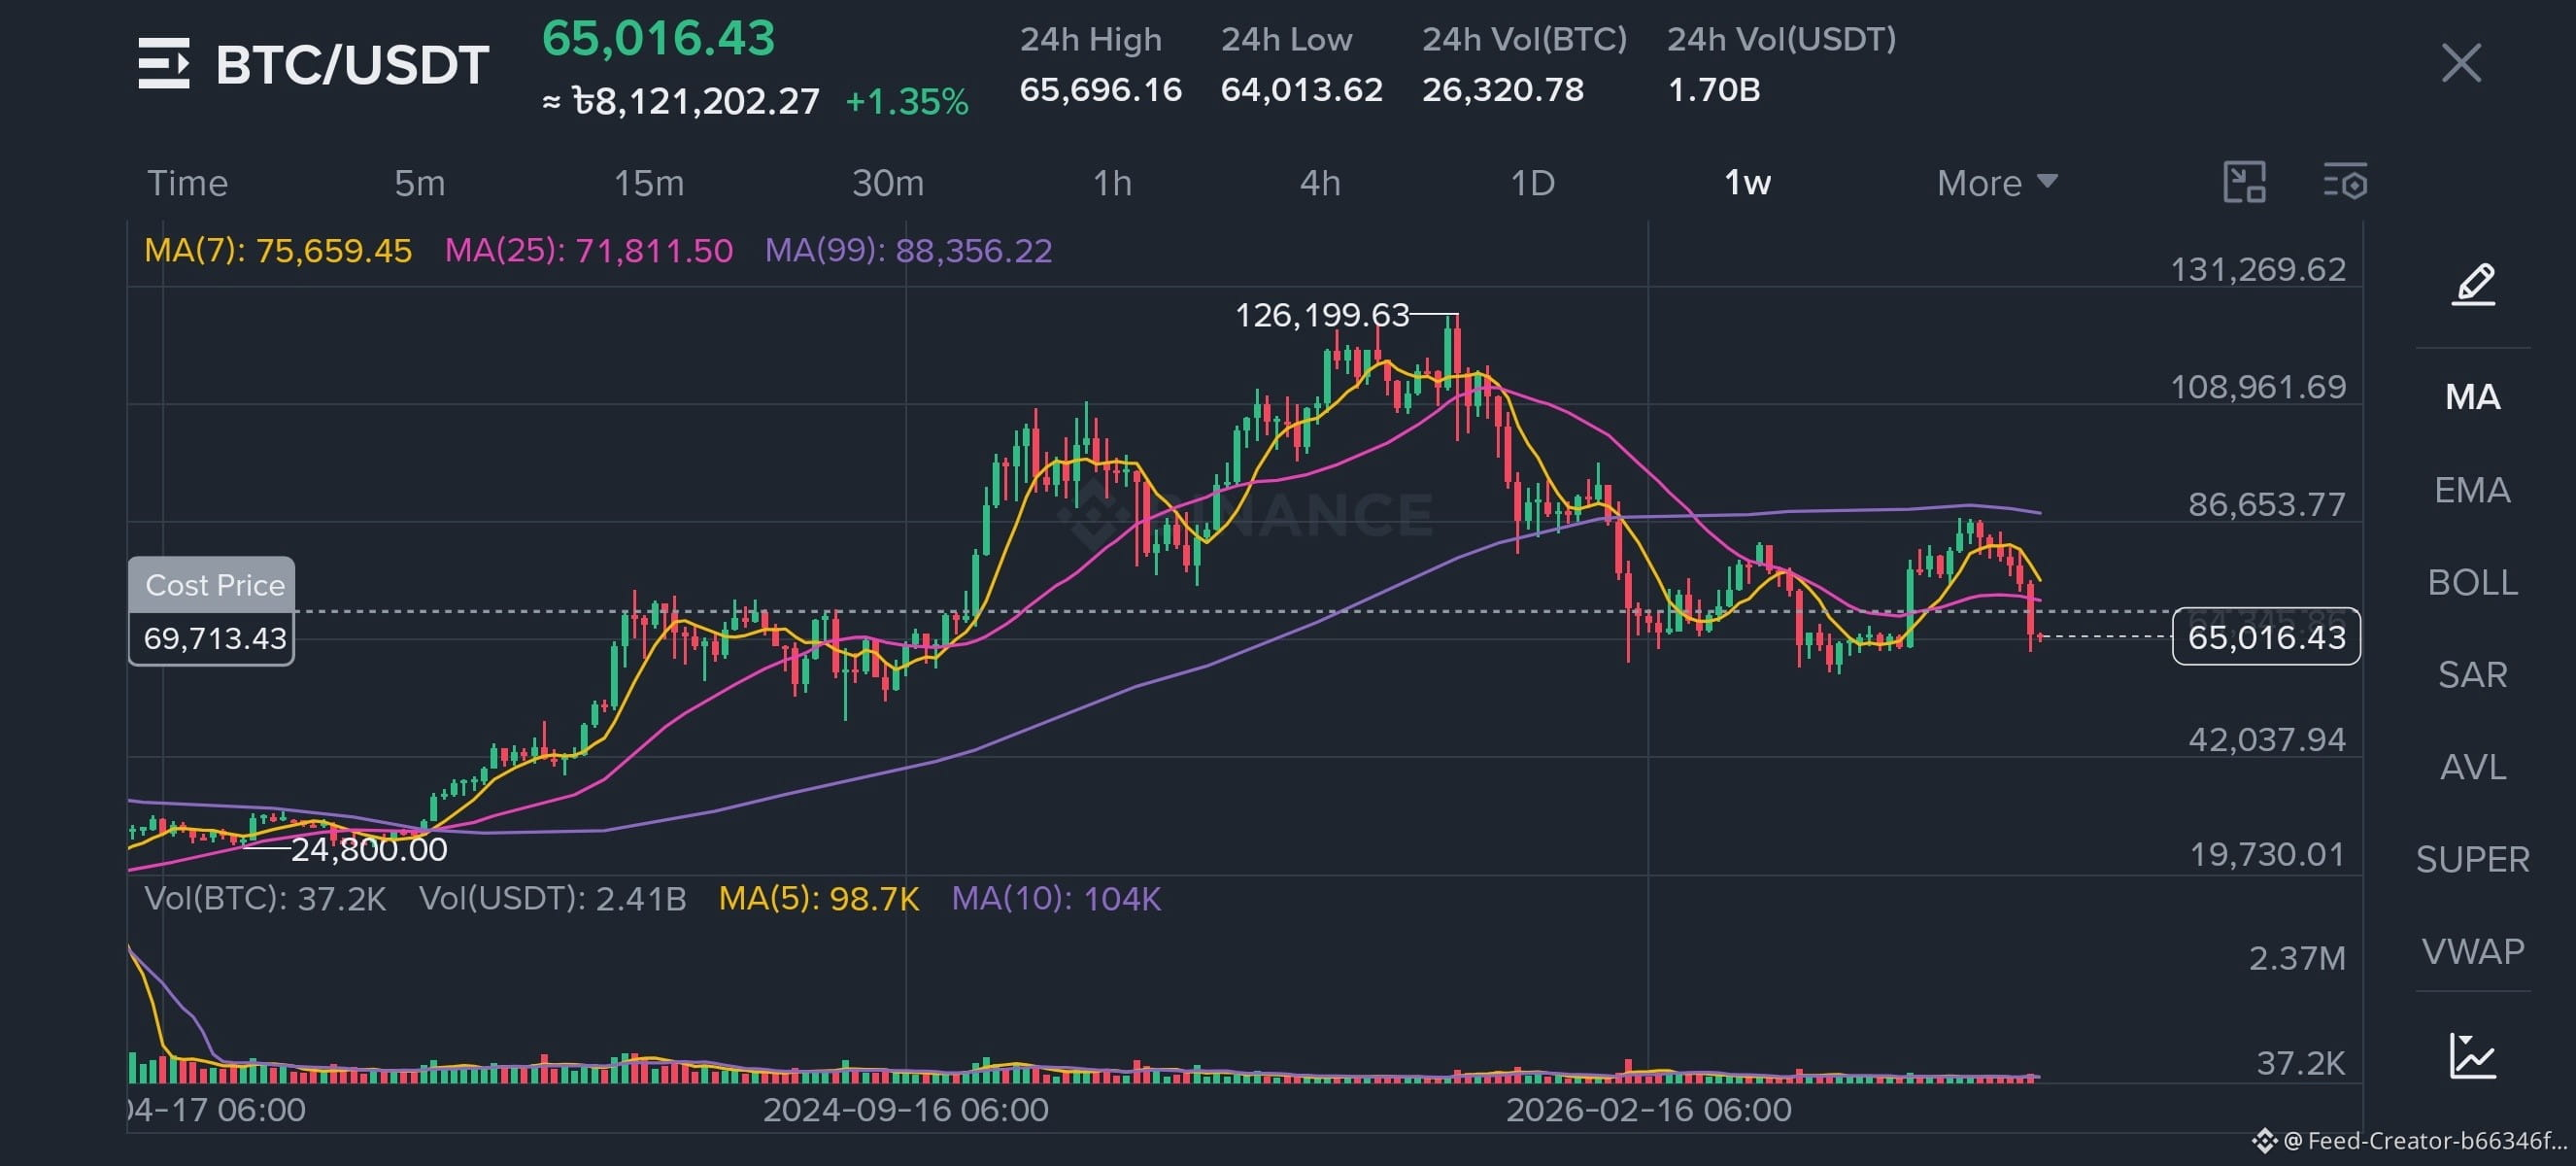
Bitcoin is currently trading around $65,016, showing weakness on the weekly timeframe.
🔍 Key observations:
- BTC is trading below MA(7), MA(25) and MA(99).
- The $64,000–$65,000 zone is an important area to watch.
- Buyers need to regain momentum to push the price higher.
- A strong weekly recovery could change the current market sentiment.
Remember: The market doesn't move in a straight line. Corrections are part of every market cycle.
$BTC
💡 Don't let fear control your decisions. Stay patient, manage your risk, and focus on the long term.
What do you think? Is $BTC preparing for a recovery or another correction? 🚀
#BitcoinDunyamiz #btc70k #CryptoMarketMoves #BinanceSquareTalks #BTCUSDT
{spot}(BTCUSDT)
📉 Bitcoin Weekly Analysis – Patience Is Key!
Bitcoin is currently trading around $65,016, showing weakness on the weekly timeframe.
🔍 Key observations:
- BTC is trading below MA(7), MA(25) and MA(99).
- The $64,000–$65,000 zone is an important area to watch.
- Buyers need to regain momentum to push the price higher.
- A strong weekly recovery could change the current market sentiment.
Remember: The market doesn't move in a straight line. Corrections are part of every market cycle.
$BTC
💡 Don't let fear control your decisions. Stay patient, manage your risk, and focus on the long term.
What do you think? Is $BTC preparing for a recovery or another correction? 🚀
#BitcoinDunyamiz #btc70k #CryptoMarketMoves #BinanceSquareTalks #BTCUSDT
Bitcoin is currently trading around $65,016, showing weakness on the weekly timeframe.
🔍 Key observations:
- BTC is trading below MA(7), MA(25) and MA(99).
- The $64,000–$65,000 zone is an important area to watch.
- Buyers need to regain momentum to push the price higher.
- A strong weekly recovery could change the current market sentiment.
Remember: The market doesn't move in a straight line. Corrections are part of every market cycle.
$BTC
💡 Don't let fear control your decisions. Stay patient, manage your risk, and focus on the long term.
What do you think? Is $BTC preparing for a recovery or another correction? 🚀
#BitcoinDunyamiz #btc70k #CryptoMarketMoves #BinanceSquareTalks #BTCUSDT
83

$BTC
Bitcoin is facing strong selling pressure, currently trading around $64,200–$64,600. The market remains weak after its recent decline, although buyers are attempting to stabilize the price.
Resistance 1: $65,500
Resistance 2: $66,300
Support 1: $63,900
Support 2: $63,000
Market trend: Bearish
#BTCUSDT
#BTCUSDT
$BTC
Bitcoin is facing strong selling pressure, currently trading around $64,200–$64,600. The market remains weak after its recent decline, although buyers are attempting to stabilize the price.
Resistance 1: $65,500
Resistance 2: $66,300
Support 1: $63,900
Support 2: $63,000
Market trend: Bearish
#BTCUSDT
#BTCUSDT
Bitcoin is facing strong selling pressure, currently trading around $64,200–$64,600. The market remains weak after its recent decline, although buyers are attempting to stabilize the price.
Resistance 1: $65,500
Resistance 2: $66,300
Support 1: $63,900
Support 2: $63,000
Market trend: Bearish
#BTCUSDT
#BTCUSDT

79

BTC is hammering higher on the 4‑hour chart, breaking a key swing low and eyeing the next resistance zone. The breakout is clean and the order flow is screaming bullish.
🟢 $BTC LONG 📈
Entry → $64,778.16-$64,907.84
Stop → $62,897.71 (-3.0%)
TP1 → $65,815.64 (+1.5%)
TP2 → $68,085.15 (+5.0%)
R/R 1:1.7 • Confidence 64%
The market structure flipped on a CHoCH as price ripped through the prior swing, while a surge in CVD confirms buying pressure. A fresh FVG aligns with a bullish order block, and a recent liquidity sweep set the stage for a POI where the OB and FVG overlap, delivering tight confluence. With confidence at 64% and a 1:1.7 R/R, the entry window feels urgent.
A 3.0% stop is relatively tight on this volatility, so stick to around 2‑3x leverage.
Take partial profit at the first target around 1.7 R to lock in gains.
Not financial advice — always manage your own risk 🙏
$BTC #BTCUSDT #EVAA #TradingSignals #Write2Earn
BTC is hammering higher on the 4‑hour chart, breaking a key swing low and eyeing the next resistance zone. The breakout is clean and the order flow is screaming bullish.
🟢 $BTC LONG 📈
Entry → $64,778.16-$64,907.84
Stop → $62,897.71 (-3.0%)
TP1 → $65,815.64 (+1.5%)
TP2 → $68,085.15 (+5.0%)
R/R 1:1.7 • Confidence 64%
The market structure flipped on a CHoCH as price ripped through the prior swing, while a surge in CVD confirms buying pressure. A fresh FVG aligns with a bullish order block, and a recent liquidity sweep set the stage for a POI where the OB and FVG overlap, delivering tight confluence. With confidence at 64% and a 1:1.7 R/R, the entry window feels urgent.
A 3.0% stop is relatively tight on this volatility, so stick to around 2‑3x leverage.
Take partial profit at the first target around 1.7 R to lock in gains.
Not financial advice — always manage your own risk 🙏
$BTC #BTCUSDT #EVAA #TradingSignals #Write2Earn
🟢 $BTC LONG 📈
Entry → $64,778.16-$64,907.84
Stop → $62,897.71 (-3.0%)
TP1 → $65,815.64 (+1.5%)
TP2 → $68,085.15 (+5.0%)
R/R 1:1.7 • Confidence 64%
The market structure flipped on a CHoCH as price ripped through the prior swing, while a surge in CVD confirms buying pressure. A fresh FVG aligns with a bullish order block, and a recent liquidity sweep set the stage for a POI where the OB and FVG overlap, delivering tight confluence. With confidence at 64% and a 1:1.7 R/R, the entry window feels urgent.
A 3.0% stop is relatively tight on this volatility, so stick to around 2‑3x leverage.
Take partial profit at the first target around 1.7 R to lock in gains.
Not financial advice — always manage your own risk 🙏
$BTC #BTCUSDT #EVAA #TradingSignals #Write2Earn
6

·
--
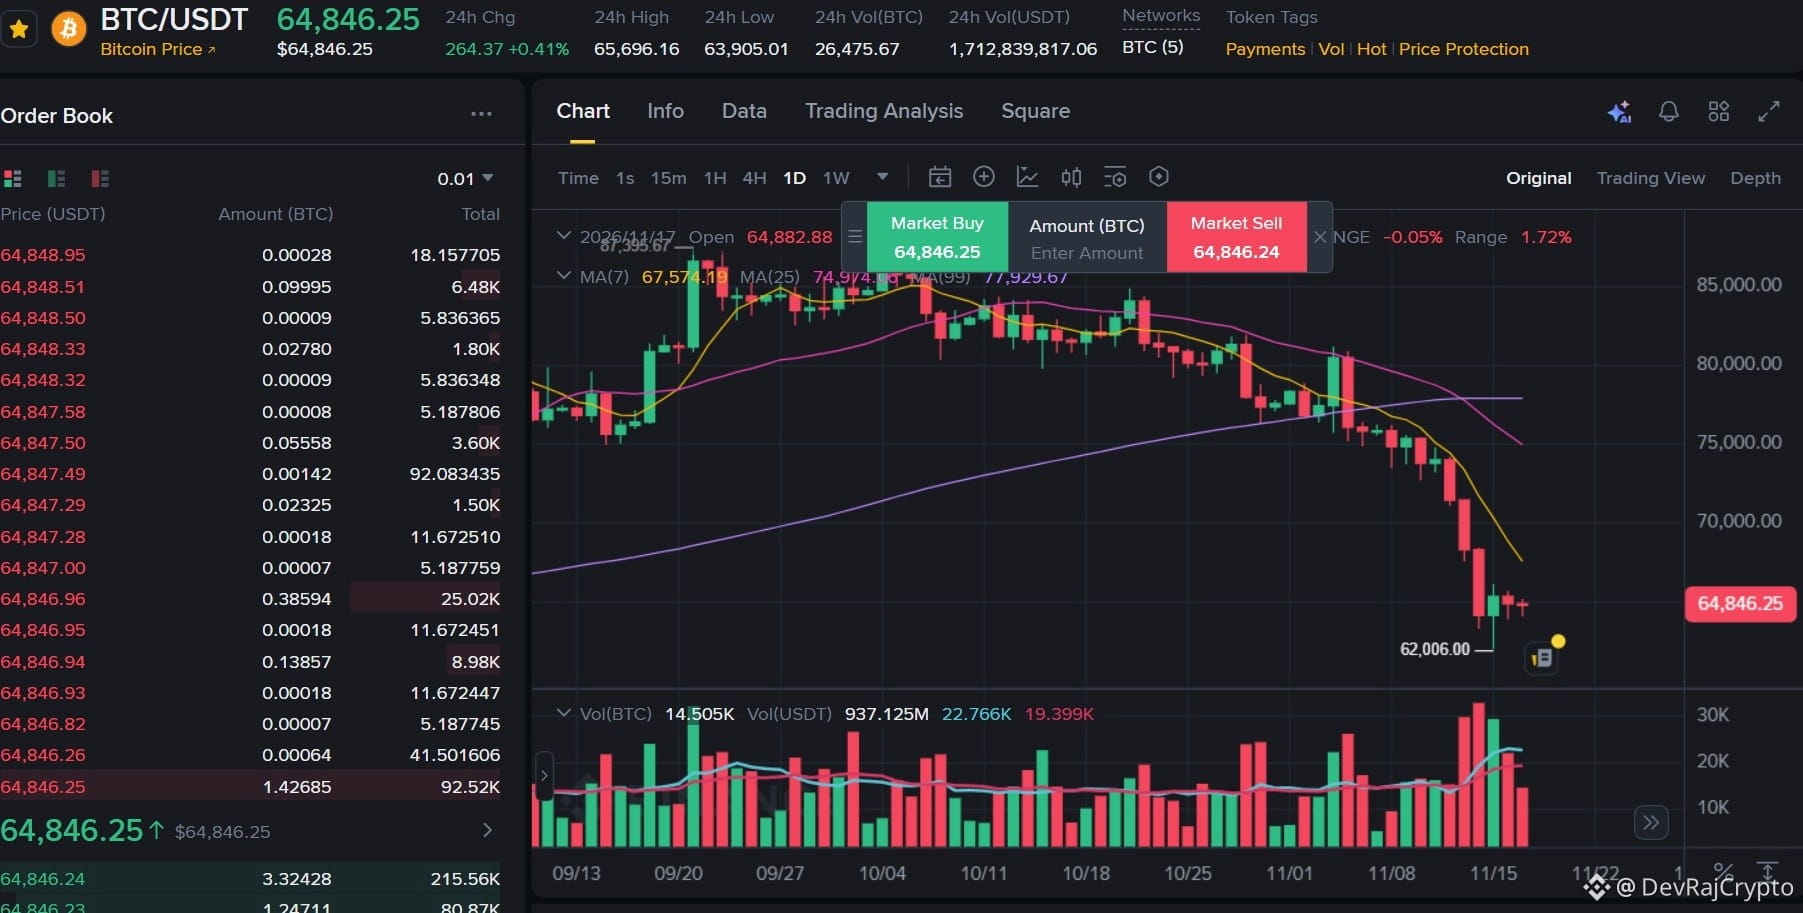
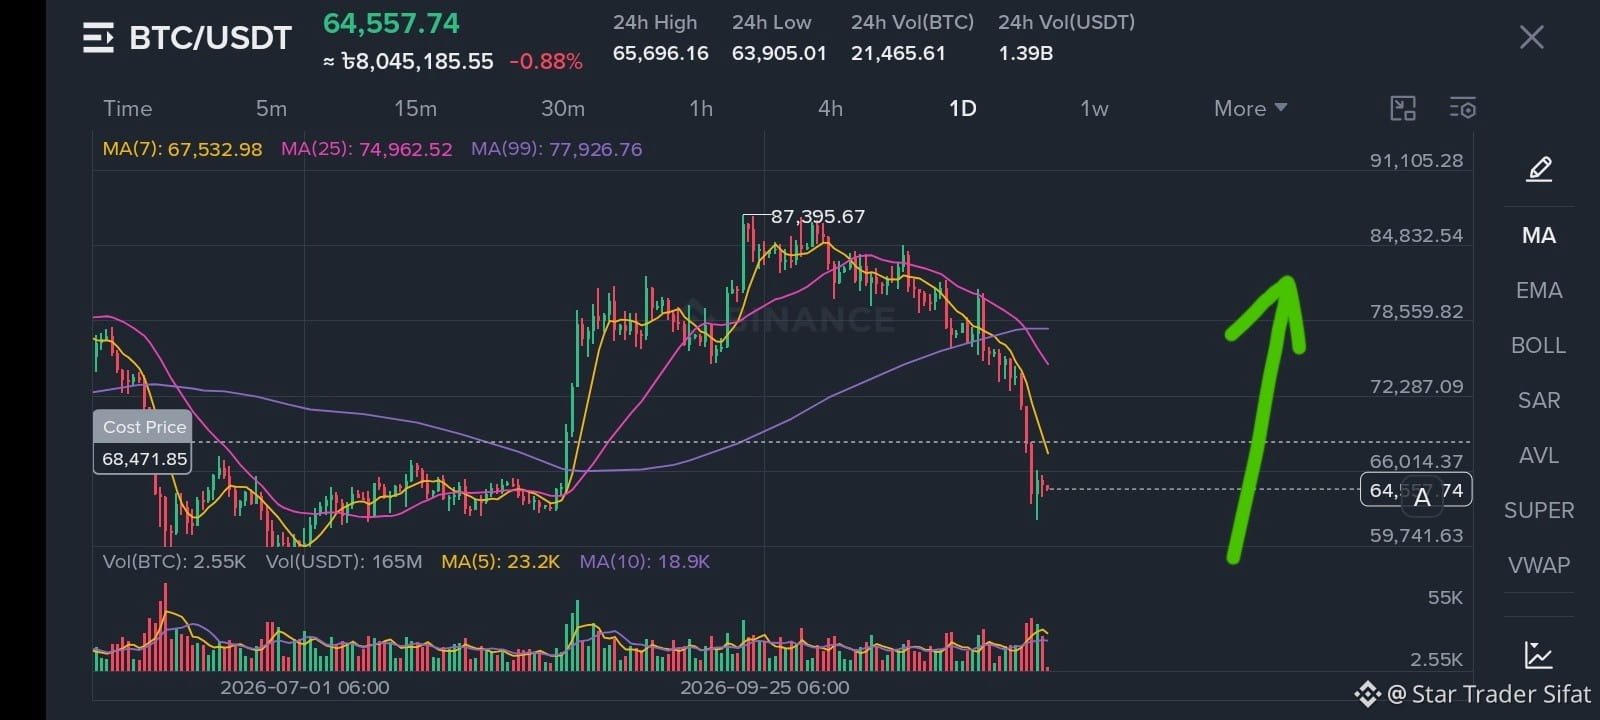
Bitcoin has recovered nearly $2,800 from its recent low, but I am not convinced the worst of the selling is behind us.
There is something interesting in the BTC/USDT daily chart.
The decline towards $62,006 came with a noticeable expansion in trading volume. Bitcoin then bounced, but the recovery has so far struggled to build sustained upward momentum.
At around $64,846, price remains below all three moving averages:
• 7-day MA: $67,574
• 25-day MA: $74,924
• 99-day MA: $77,930
What does this tell me?
The immediate selling pressure has eased, but the market has not repaired the technical damage caused by the decline.
I am particularly interested in what happens around $65,700 and $67,574.
The first is the recent 24-hour high. The second is the 7-day moving average. Reclaiming both would be a meaningful improvement in short-term structure. But I would also want to see stronger buying participation rather than a brief price spike.
My reading is that Bitcoin is at a point where the next few daily candles matter more than the initial rebound.
If buyers establish higher lows and push through $67,574, I would become more constructive about a recovery. If the price loses momentum and revisits $62,006, the recent bounce will look increasingly fragile.
I am not treating this rebound as a confirmed bottom. I want the market to demonstrate that demand can sustain higher prices.
What is your reading: is Bitcoin beginning to build a base around $62,000, or is this just a pause before another leg down?
$BTC #bitcoin #BTCUSDT #CryptoMarket
Bitcoin has recovered nearly $2,800 from its recent low, but I am not convinced the worst of the selling is behind us.
There is something interesting in the BTC/USDT daily chart.
The decline towards $62,006 came with a noticeable expansion in trading volume. Bitcoin then bounced, but the recovery has so far struggled to build sustained upward momentum.
At around $64,846, price remains below all three moving averages:
• 7-day MA: $67,574
• 25-day MA: $74,924
• 99-day MA: $77,930
What does this tell me?
The immediate selling pressure has eased, but the market has not repaired the technical damage caused by the decline.
I am particularly interested in what happens around $65,700 and $67,574.
The first is the recent 24-hour high. The second is the 7-day moving average. Reclaiming both would be a meaningful improvement in short-term structure. But I would also want to see stronger buying participation rather than a brief price spike.
My reading is that Bitcoin is at a point where the next few daily candles matter more than the initial rebound.
If buyers establish higher lows and push through $67,574, I would become more constructive about a recovery. If the price loses momentum and revisits $62,006, the recent bounce will look increasingly fragile.
I am not treating this rebound as a confirmed bottom. I want the market to demonstrate that demand can sustain higher prices.
What is your reading: is Bitcoin beginning to build a base around $62,000, or is this just a pause before another leg down?
$BTC #bitcoin #BTCUSDT #CryptoMarket
There is something interesting in the BTC/USDT daily chart.
The decline towards $62,006 came with a noticeable expansion in trading volume. Bitcoin then bounced, but the recovery has so far struggled to build sustained upward momentum.
At around $64,846, price remains below all three moving averages:
• 7-day MA: $67,574
• 25-day MA: $74,924
• 99-day MA: $77,930
What does this tell me?
The immediate selling pressure has eased, but the market has not repaired the technical damage caused by the decline.
I am particularly interested in what happens around $65,700 and $67,574.
The first is the recent 24-hour high. The second is the 7-day moving average. Reclaiming both would be a meaningful improvement in short-term structure. But I would also want to see stronger buying participation rather than a brief price spike.
My reading is that Bitcoin is at a point where the next few daily candles matter more than the initial rebound.
If buyers establish higher lows and push through $67,574, I would become more constructive about a recovery. If the price loses momentum and revisits $62,006, the recent bounce will look increasingly fragile.
I am not treating this rebound as a confirmed bottom. I want the market to demonstrate that demand can sustain higher prices.
What is your reading: is Bitcoin beginning to build a base around $62,000, or is this just a pause before another leg down?
$BTC #bitcoin #BTCUSDT #CryptoMarket
1
53

·
--
Bullish
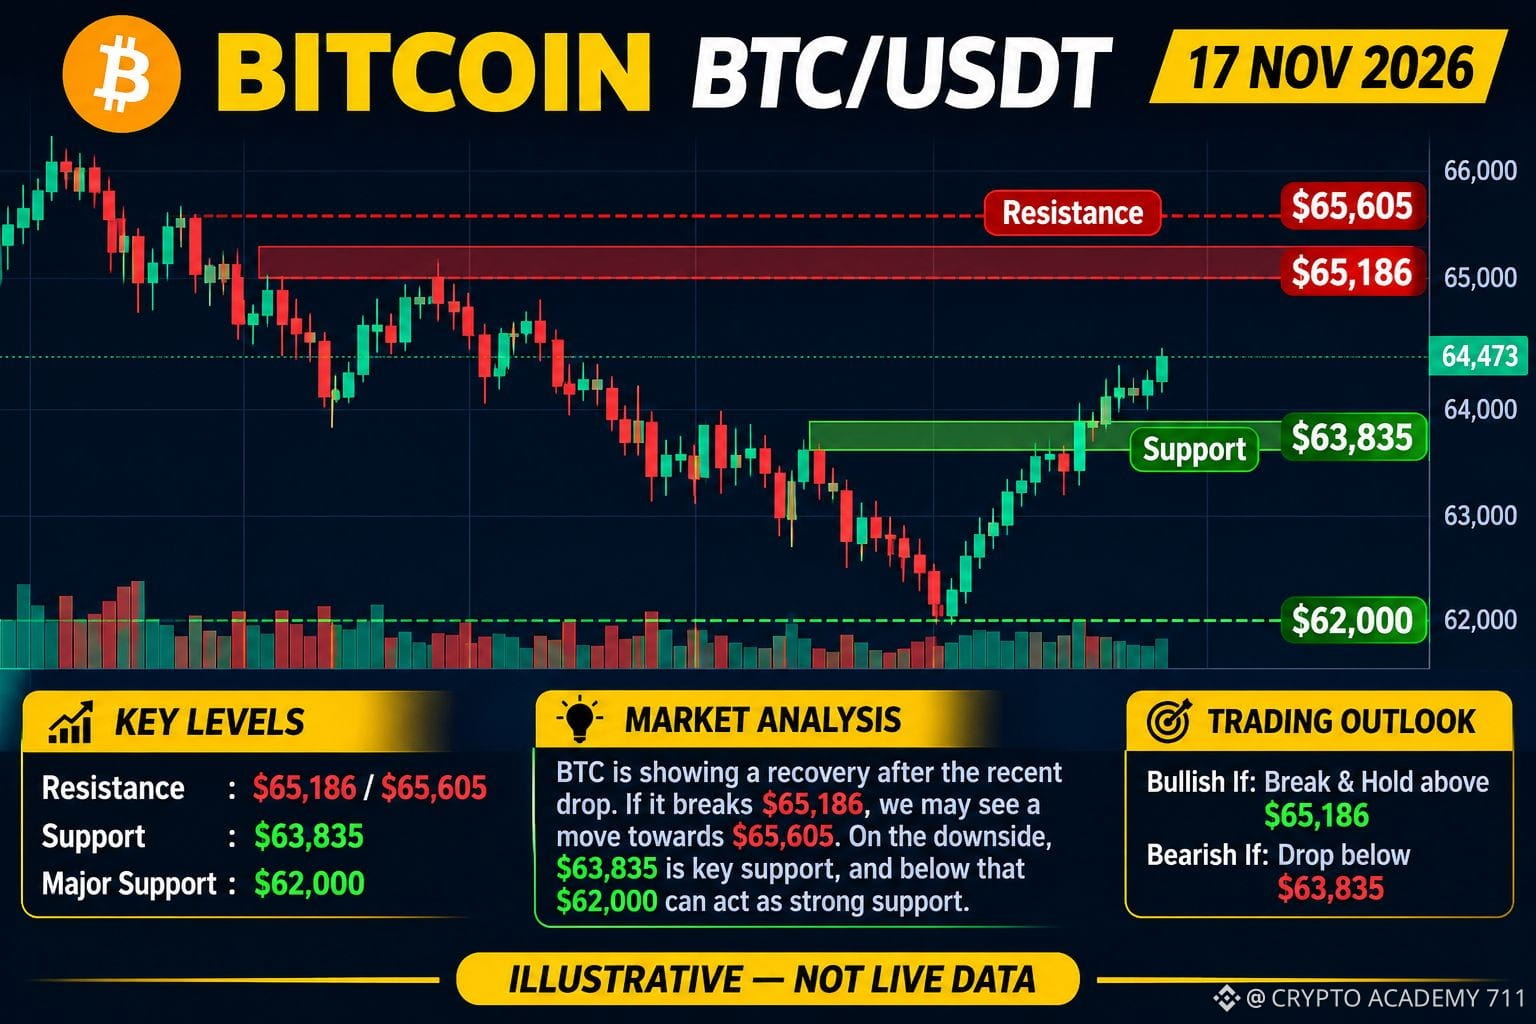
$BTC BITCOIN (BTC) MARKET UPDATE | NOVEMBER 17, 2026
Bitcoin is trading around $64,473 as the market faces selling pressure following its recent recovery.
📊 Key Levels:
🔴 Resistance: $65,186 – $65,605
🟢 Support: $63,835
🟢 Major Support: $62,000
📈 Bullish Scenario: A breakout above $65,186 could open the way towards $66,900.
📉 Bearish Scenario: Losing $63,835 could trigger another decline towards $62,000.
🎯 My Outlook: BTC remains under bearish pressure until buyers reclaim the key resistance zone. Watch volume and candle closes before entering a trade.
What do you think? Will Bitcoin recover or drop further?
{spot}(BTCUSDT)
#Bitcoin #BTC #CryptoAnalysis #BinanceSquare #BTCUSDT
$BTC BITCOIN (BTC) MARKET UPDATE | NOVEMBER 17, 2026
Bitcoin is trading around $64,473 as the market faces selling pressure following its recent recovery.
📊 Key Levels:
🔴 Resistance: $65,186 – $65,605
🟢 Support: $63,835
🟢 Major Support: $62,000
📈 Bullish Scenario: A breakout above $65,186 could open the way towards $66,900.
📉 Bearish Scenario: Losing $63,835 could trigger another decline towards $62,000.
🎯 My Outlook: BTC remains under bearish pressure until buyers reclaim the key resistance zone. Watch volume and candle closes before entering a trade.
What do you think? Will Bitcoin recover or drop further?
#Bitcoin #BTC #CryptoAnalysis #BinanceSquare #BTCUSDT
Bitcoin is trading around $64,473 as the market faces selling pressure following its recent recovery.
📊 Key Levels:
🔴 Resistance: $65,186 – $65,605
🟢 Support: $63,835
🟢 Major Support: $62,000
📈 Bullish Scenario: A breakout above $65,186 could open the way towards $66,900.
📉 Bearish Scenario: Losing $63,835 could trigger another decline towards $62,000.
🎯 My Outlook: BTC remains under bearish pressure until buyers reclaim the key resistance zone. Watch volume and candle closes before entering a trade.
What do you think? Will Bitcoin recover or drop further?
#Bitcoin #BTC #CryptoAnalysis #BinanceSquare #BTCUSDT
20

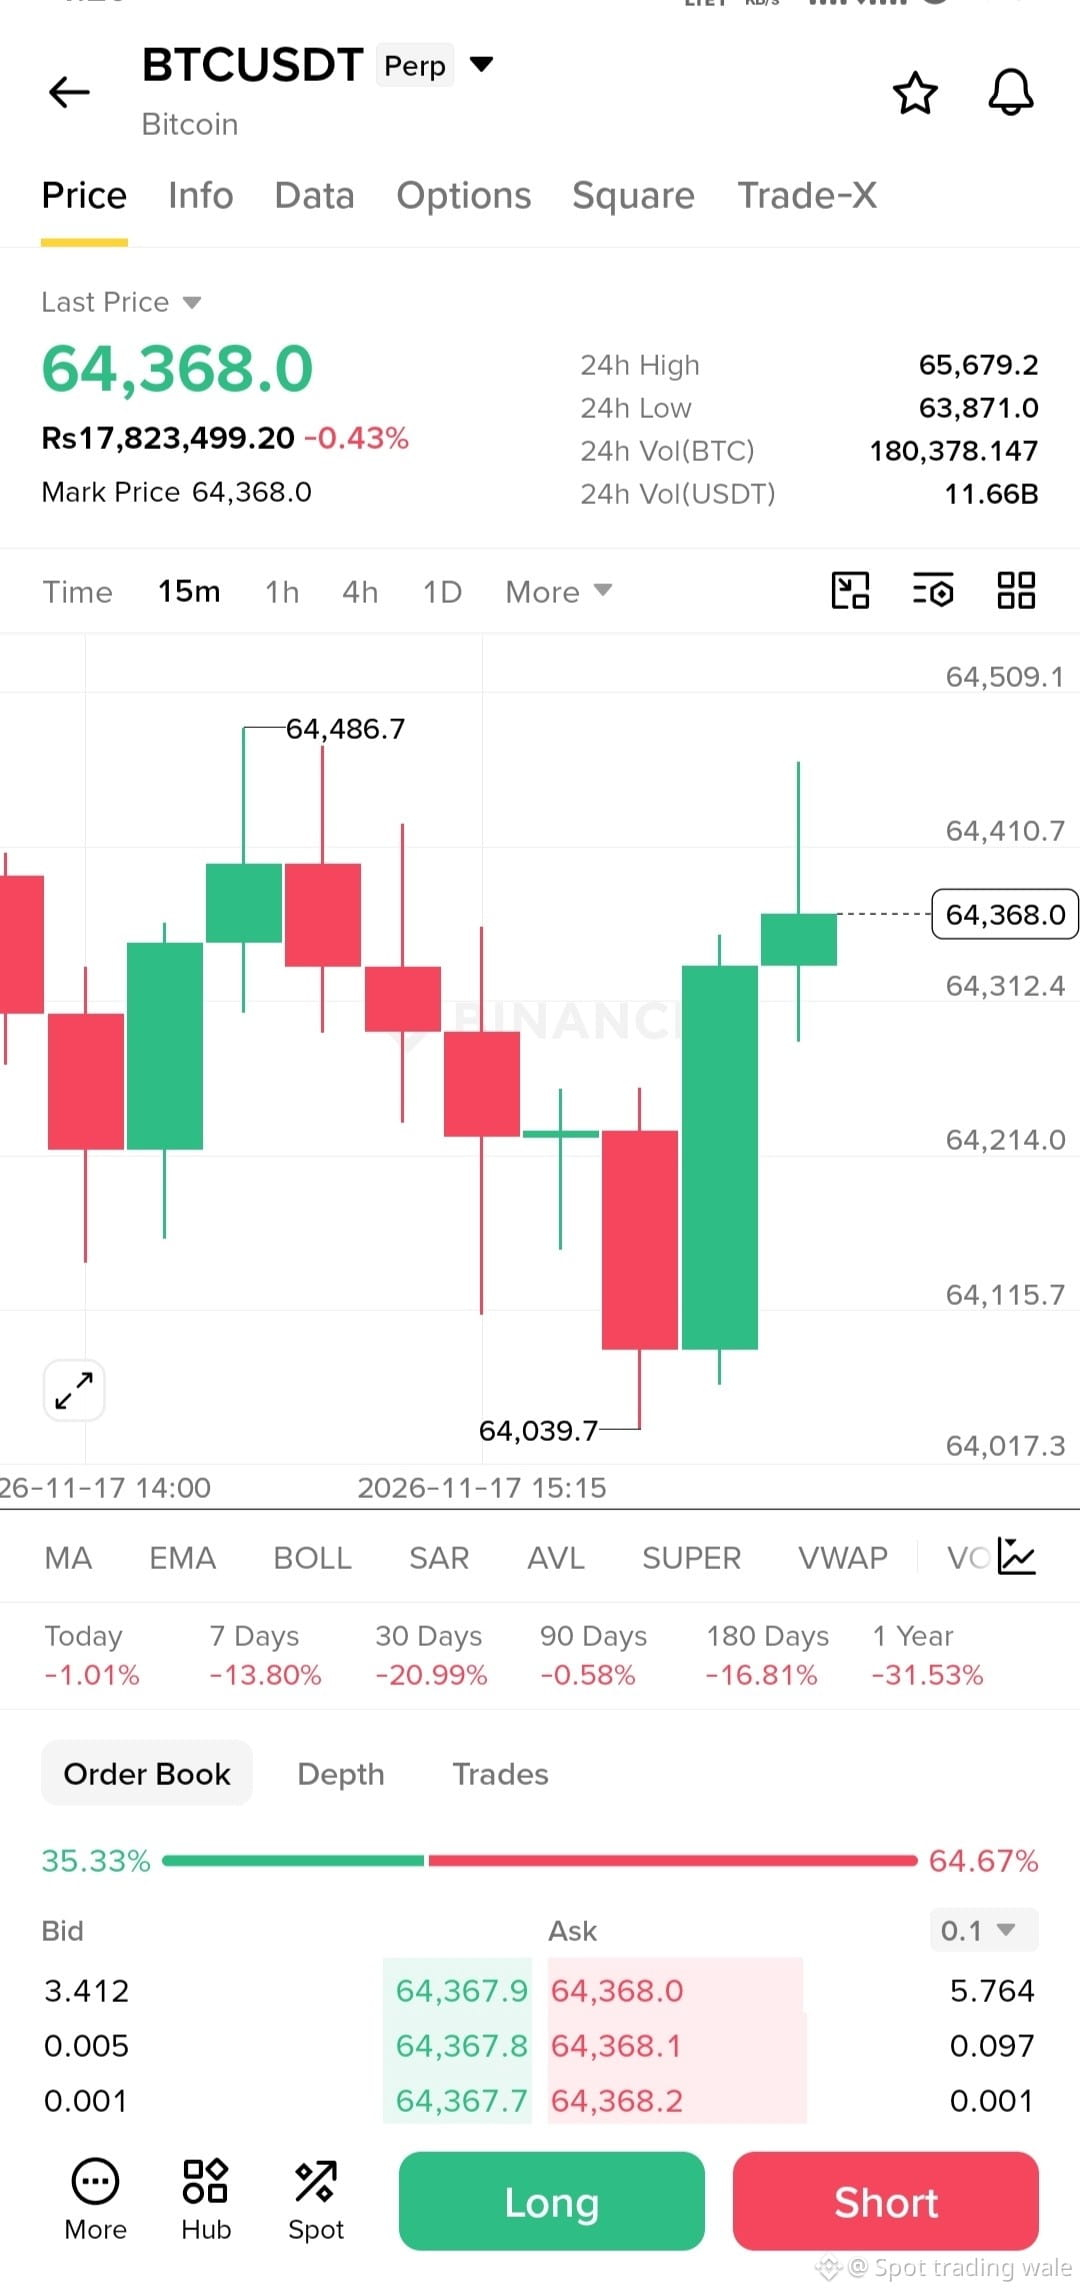
🚀 BITCOIN $BTC Market Update
💰 Price: $64,368 📉 24H Change: -0.43% 📈 24H High: $65,679.2 📉 24H Low: $63,871.0
What's next for Bitcoin? 👀
#Bitcoin #BTC #BTCUSDT #Binance #Crypto #CryptoMarket
$BTC
{spot}(BTCUSDT)
🚀 BITCOIN $BTC Market Update
💰 Price: $64,368 📉 24H Change: -0.43% 📈 24H High: $65,679.2 📉 24H Low: $63,871.0
What's next for Bitcoin? 👀
#Bitcoin #BTC #BTCUSDT #Binance #Crypto #CryptoMarket
$BTC
💰 Price: $64,368 📉 24H Change: -0.43% 📈 24H High: $65,679.2 📉 24H Low: $63,871.0
What's next for Bitcoin? 👀
#Bitcoin #BTC #BTCUSDT #Binance #Crypto #CryptoMarket
$BTC
33

{future}(BTCUSDT)
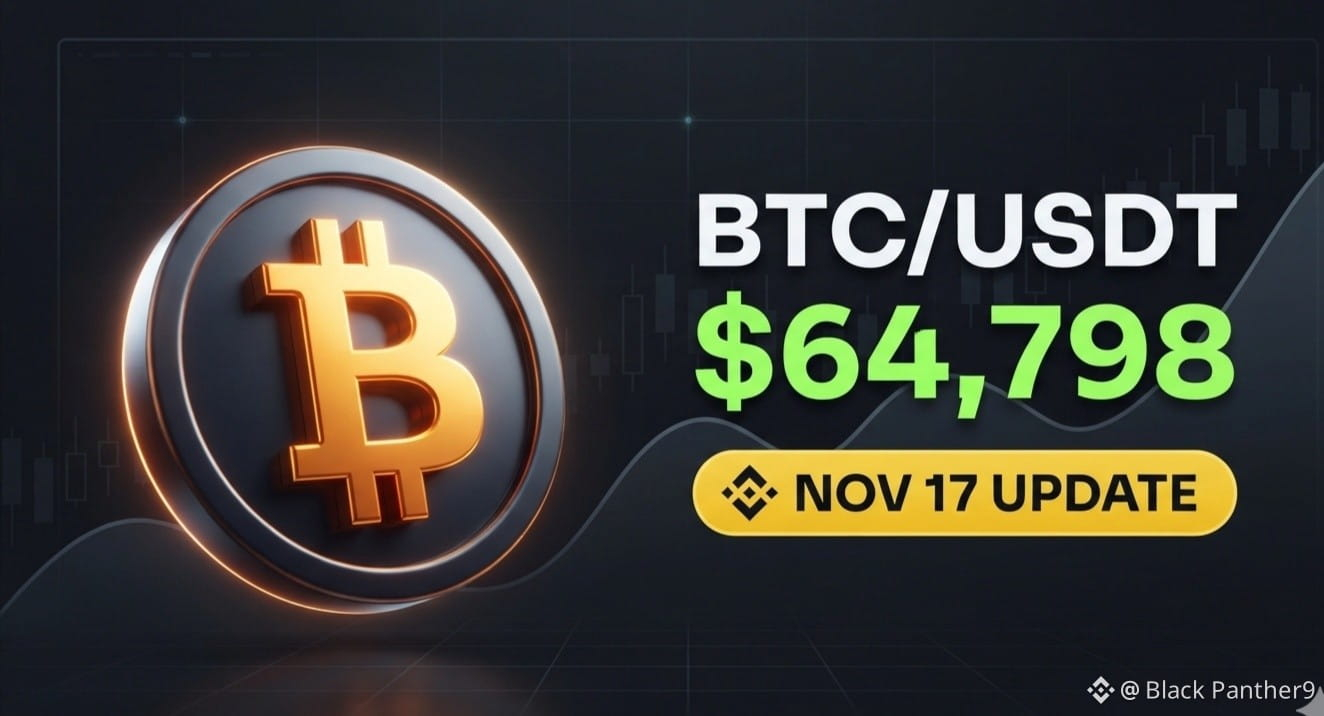
$BTC 📊 Current Price: ~$64,798
📈 24h High: ~$65,696 | 📉 24h Low: ~$63,905
💰 24h Volume: ~23,136 BTC ($1.50B USDT)
Bitcoin is consolidating around the $64,700–$64,800 zone after rebounding from weekend lows near $62,000. While short-term buyers are defending the $63,900 support area, bulls are still working to reclaim momentum above the $65,700 resistance level.
Levels to Watch🚀🚀
🔹 Resistance: $65,700 – $66,000
🔹 Support: $63,900 – $62,000
Are you expecting a breakout above $66K next, or another test of lower support? Drop your thoughts below! 👇 $BNB $XAU
#bitcoin #BTCUSDT #CryptoMarket #BinanceSquare #Write2Earn
{future}(XAUTUSDT)
{future}(BNBUSDT)
$BTC 📊 Current Price: ~$64,798
📈 24h High: ~$65,696 | 📉 24h Low: ~$63,905
💰 24h Volume: ~23,136 BTC ($1.50B USDT)
Bitcoin is consolidating around the $64,700–$64,800 zone after rebounding from weekend lows near $62,000. While short-term buyers are defending the $63,900 support area, bulls are still working to reclaim momentum above the $65,700 resistance level.
Levels to Watch🚀🚀
🔹 Resistance: $65,700 – $66,000
🔹 Support: $63,900 – $62,000
Are you expecting a breakout above $66K next, or another test of lower support? Drop your thoughts below! 👇 $BNB $XAU
#bitcoin #BTCUSDT #CryptoMarket #BinanceSquare #Write2Earn
📈 24h High: ~$65,696 | 📉 24h Low: ~$63,905
💰 24h Volume: ~23,136 BTC ($1.50B USDT)
Bitcoin is consolidating around the $64,700–$64,800 zone after rebounding from weekend lows near $62,000. While short-term buyers are defending the $63,900 support area, bulls are still working to reclaim momentum above the $65,700 resistance level.
Levels to Watch🚀🚀
🔹 Resistance: $65,700 – $66,000
🔹 Support: $63,900 – $62,000
Are you expecting a breakout above $66K next, or another test of lower support? Drop your thoughts below! 👇 $BNB $XAU
#bitcoin #BTCUSDT #CryptoMarket #BinanceSquare #Write2Earn
22

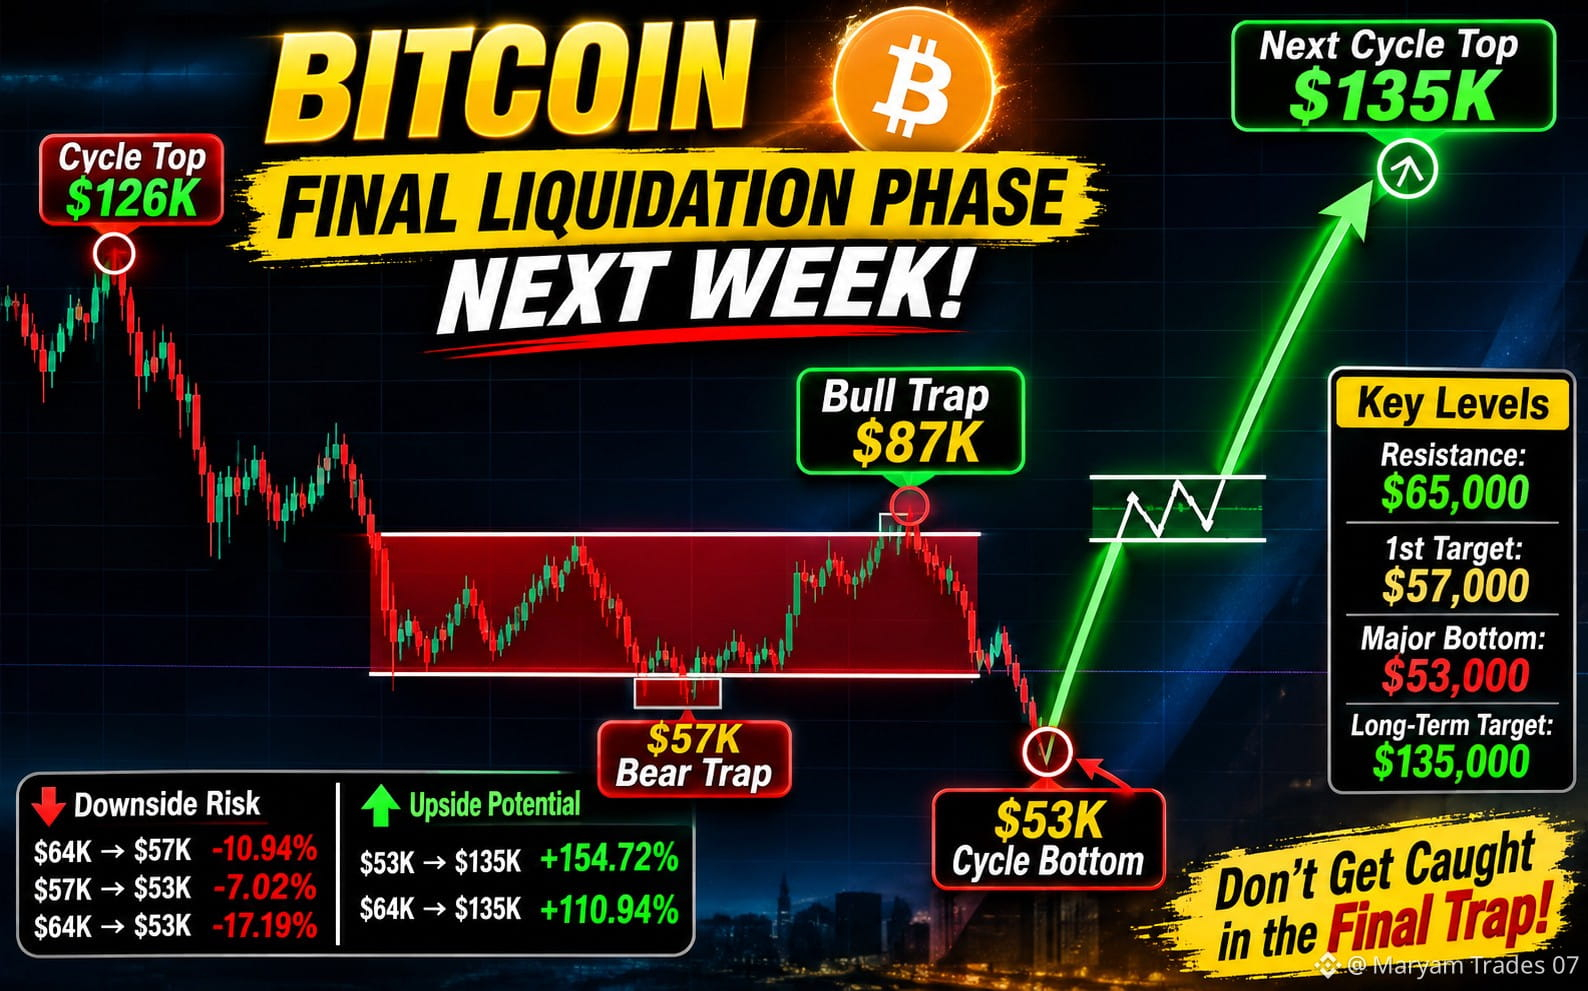
#InvescoStablecoinReservesFundLaunchesOnEthereum 🚨 $BITCOIN AT A CRITICAL TURNING POINT — THE NEXT MOVE COULD CHANGE EVERYTHING! ⚠️
Bitcoin ($BTC) is approaching a major decision zone, and traders need to stay alert. The $62,000–$65,000 region could become a dangerous liquidity trap if buyers fail to defend this support area.
Here’s the price roadmap I'm watching:
📉 Potential Downside Targets:
- $64,000 → $57,000 = 10.94% DECREASE
- $57,000 → $53,000 = 7.02% DECREASE
- $64,000 → $53,000 = 17.19% TOTAL DOWNSIDE
📈 Potential Bullish Recovery:
- $53,000 → $135,000 = 154.72% INCREASE
- $64,000 → $135,000 = 110.94% UPSIDE
🔥 My BTC Strategy:
First, watch how Bitcoin reacts around $62K–$65K. A breakdown could open the door toward $57K and potentially $53K. However, a strong recovery above the key resistance zone could invalidate the bearish setup and shift momentum toward higher levels.
🎯 Key Levels to Watch:
- Resistance: $65,000
- First Downside Target: $57,000
- Major Potential Bottom: $53,000
- Long-Term Bullish Target: $135,000
⚡ The bigger opportunity may come after the market reveals its true direction. Don't chase sudden moves; wait for confirmation and manage your risk.
What do you think? Will BTC visit $53K before making its next major rally?
Follow for more Bitcoin market updates!
#Bitcoin #BTC #CryptoMarket #BitcoinAnalysis #CryptoTrading #BTCUSDT
#InvescoStablecoinReservesFundLaunchesOnEthereum 🚨 $BITCOIN AT A CRITICAL TURNING POINT — THE NEXT MOVE COULD CHANGE EVERYTHING! ⚠️
Bitcoin ($BTC) is approaching a major decision zone, and traders need to stay alert. The $62,000–$65,000 region could become a dangerous liquidity trap if buyers fail to defend this support area.
Here’s the price roadmap I'm watching:
📉 Potential Downside Targets:
- $64,000 → $57,000 = 10.94% DECREASE
- $57,000 → $53,000 = 7.02% DECREASE
- $64,000 → $53,000 = 17.19% TOTAL DOWNSIDE
📈 Potential Bullish Recovery:
- $53,000 → $135,000 = 154.72% INCREASE
- $64,000 → $135,000 = 110.94% UPSIDE
🔥 My BTC Strategy:
First, watch how Bitcoin reacts around $62K–$65K. A breakdown could open the door toward $57K and potentially $53K. However, a strong recovery above the key resistance zone could invalidate the bearish setup and shift momentum toward higher levels.
🎯 Key Levels to Watch:
- Resistance: $65,000
- First Downside Target: $57,000
- Major Potential Bottom: $53,000
- Long-Term Bullish Target: $135,000
⚡ The bigger opportunity may come after the market reveals its true direction. Don't chase sudden moves; wait for confirmation and manage your risk.
What do you think? Will BTC visit $53K before making its next major rally?
Follow for more Bitcoin market updates!
#Bitcoin #BTC #CryptoMarket #BitcoinAnalysis #CryptoTrading #BTCUSDT
Bitcoin ($BTC) is approaching a major decision zone, and traders need to stay alert. The $62,000–$65,000 region could become a dangerous liquidity trap if buyers fail to defend this support area.
Here’s the price roadmap I'm watching:
📉 Potential Downside Targets:
- $64,000 → $57,000 = 10.94% DECREASE
- $57,000 → $53,000 = 7.02% DECREASE
- $64,000 → $53,000 = 17.19% TOTAL DOWNSIDE
📈 Potential Bullish Recovery:
- $53,000 → $135,000 = 154.72% INCREASE
- $64,000 → $135,000 = 110.94% UPSIDE
🔥 My BTC Strategy:
First, watch how Bitcoin reacts around $62K–$65K. A breakdown could open the door toward $57K and potentially $53K. However, a strong recovery above the key resistance zone could invalidate the bearish setup and shift momentum toward higher levels.
🎯 Key Levels to Watch:
- Resistance: $65,000
- First Downside Target: $57,000
- Major Potential Bottom: $53,000
- Long-Term Bullish Target: $135,000
⚡ The bigger opportunity may come after the market reveals its true direction. Don't chase sudden moves; wait for confirmation and manage your risk.
What do you think? Will BTC visit $53K before making its next major rally?
Follow for more Bitcoin market updates!
#Bitcoin #BTC #CryptoMarket #BitcoinAnalysis #CryptoTrading #BTCUSDT
1

·
--
$BTC /USDT – SHORT SIGNAL 🔴
Entry Zone: $65,000 – $65,250
Stop Loss (SL): $65,750
Take Profit Targets:
* TP1: $64,600
* TP2: $64,200
* TP3: $63,900
Trade here $BTC
{future}(BTCUSDT)
Analysis:
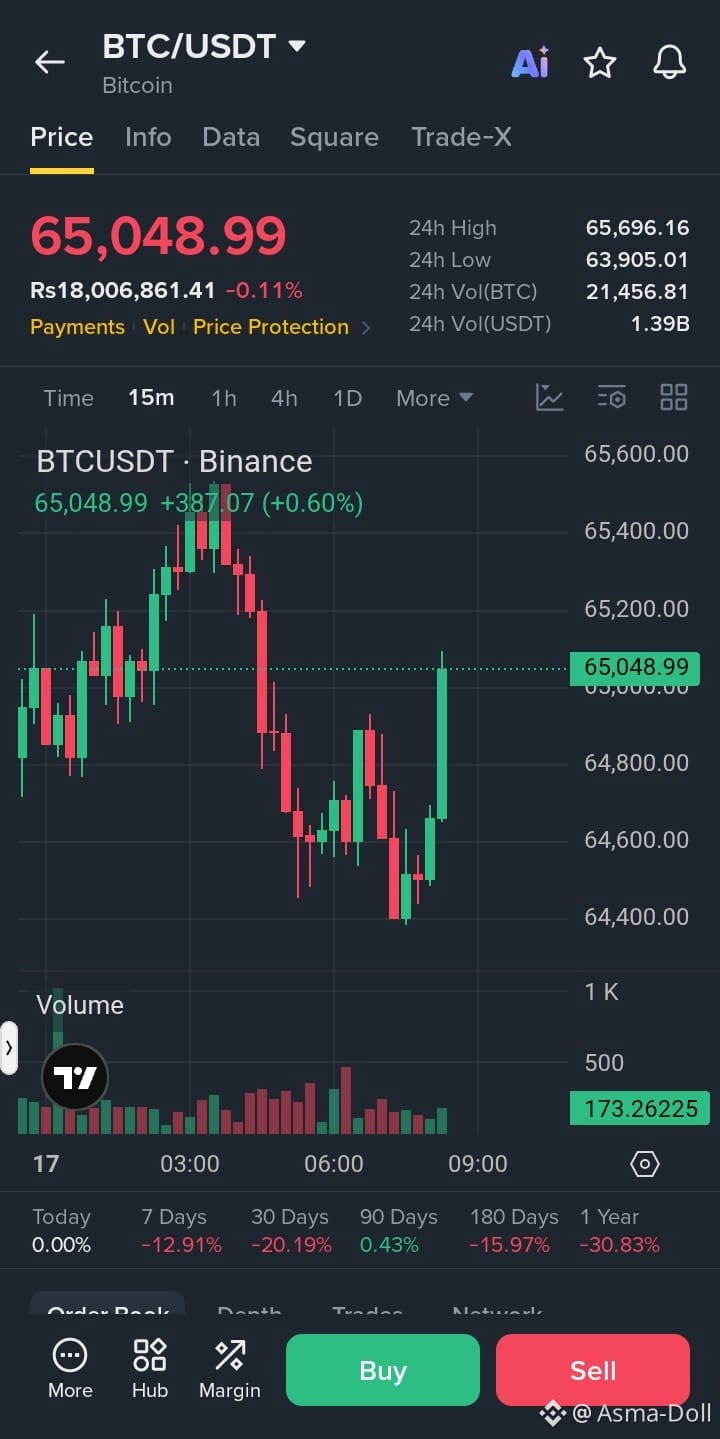
* BTC facing resistance near $65,600.
* Price showing weak short-term momentum.
* 24h low at $63,905 indicates downside risk.
* Sellers may push price toward lower support levels.
* Breakdown below $64,800 could trigger further downside.
Confirmation: Wait for a clean 15m candle close below $64,800 with strong selling volume before entering.
Risk-to-Reward: Approximately 1:0.8 to 1:2.2 (depending on entry and target).
⚠️ Avoid entry if BTC reclaims $65,600. Use proper risk management.
#BTC #Bitcoin #BTCUSDT #CryptoSignals #BinanceFutures
$BTC /USDT – SHORT SIGNAL 🔴
Entry Zone: $65,000 – $65,250
Stop Loss (SL): $65,750
Take Profit Targets:
* TP1: $64,600
* TP2: $64,200
* TP3: $63,900
Trade here $BTC
Analysis:
* BTC facing resistance near $65,600.
* Price showing weak short-term momentum.
* 24h low at $63,905 indicates downside risk.
* Sellers may push price toward lower support levels.
* Breakdown below $64,800 could trigger further downside.
Confirmation: Wait for a clean 15m candle close below $64,800 with strong selling volume before entering.
Risk-to-Reward: Approximately 1:0.8 to 1:2.2 (depending on entry and target).
⚠️ Avoid entry if BTC reclaims $65,600. Use proper risk management.
#BTC #Bitcoin #BTCUSDT #CryptoSignals #BinanceFutures
Entry Zone: $65,000 – $65,250
Stop Loss (SL): $65,750
Take Profit Targets:
* TP1: $64,600
* TP2: $64,200
* TP3: $63,900
Trade here $BTC
Analysis:
* BTC facing resistance near $65,600.
* Price showing weak short-term momentum.
* 24h low at $63,905 indicates downside risk.
* Sellers may push price toward lower support levels.
* Breakdown below $64,800 could trigger further downside.
Confirmation: Wait for a clean 15m candle close below $64,800 with strong selling volume before entering.
Risk-to-Reward: Approximately 1:0.8 to 1:2.2 (depending on entry and target).
⚠️ Avoid entry if BTC reclaims $65,600. Use proper risk management.
#BTC #Bitcoin #BTCUSDT #CryptoSignals #BinanceFutures
1
55

·
--
Bullish
🚨 BITCOIN ALERT! BTC IS AT A CRITICAL LEVEL! 📉📈
Bitcoin is currently trading around $64,557 and facing strong selling pressure.
The big question is: Will BTC continue falling, or are we about to see a powerful recovery? 👀
🐻 Bears are still in control.
🐂 Bulls are waiting for a comeback.
I'm watching the next move closely. What do you think?
$60K next, or a rally toward $70K?
Drop your prediction below! 👇
#Bitcoin #BTC #Binance #BTCUSDT #CryptoMarket #Bullish
🚨 BITCOIN ALERT! BTC IS AT A CRITICAL LEVEL! 📉📈
Bitcoin is currently trading around $64,557 and facing strong selling pressure.
The big question is: Will BTC continue falling, or are we about to see a powerful recovery? 👀
🐻 Bears are still in control.
🐂 Bulls are waiting for a comeback.
I'm watching the next move closely. What do you think?
$60K next, or a rally toward $70K?
Drop your prediction below! 👇
#Bitcoin #BTC #Binance #BTCUSDT #CryptoMarket #Bullish
Bitcoin is currently trading around $64,557 and facing strong selling pressure.
The big question is: Will BTC continue falling, or are we about to see a powerful recovery? 👀
🐻 Bears are still in control.
🐂 Bulls are waiting for a comeback.
I'm watching the next move closely. What do you think?
$60K next, or a rally toward $70K?
Drop your prediction below! 👇
#Bitcoin #BTC #Binance #BTCUSDT #CryptoMarket #Bullish
8

·
--
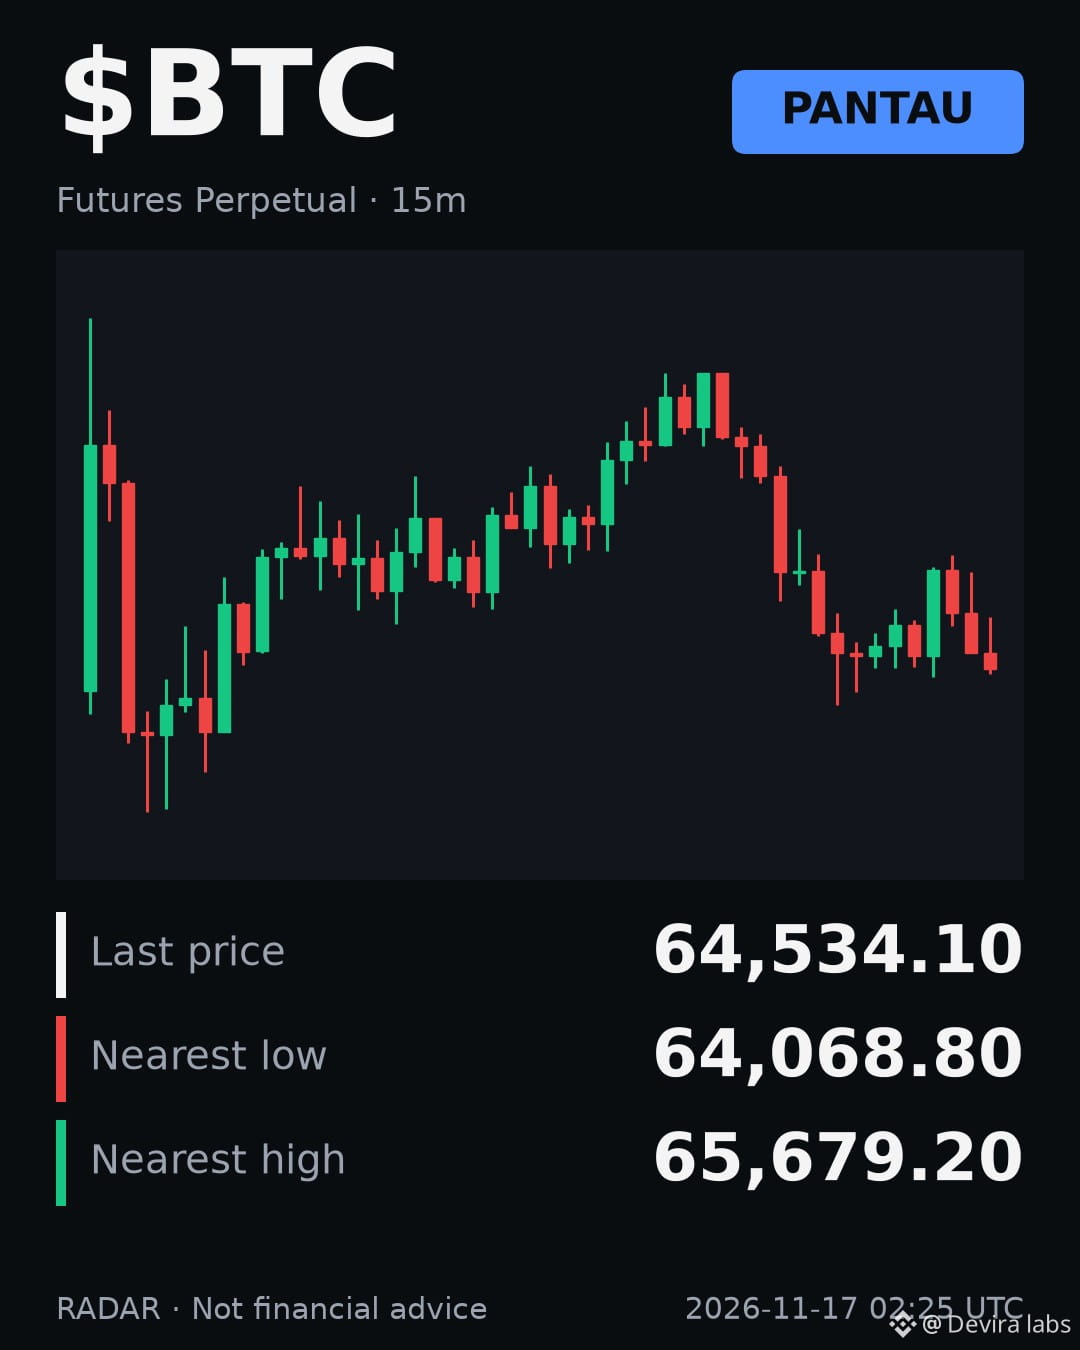
BTCUSDT Market Structure Analysis
$BTC
Market Context:
- Current Trend: Neutral
- Condition: Consolidation around 100.0
- Observation: Volume ratio stands at 1.0, indicating baseline market participation.
Technical Levels:
- Support Zone: Below 100.0
- Resistance Zone: Above 100.0
- Trend Direction: Neutral
Scenario:
Bullish Scenario:
- Acceptance and hold above 100.0 backed by expanding volume.
Bearish Scenario:
- Invalidation and break below 100.0 driven by sustained sell volume.
Risk:
- Range chop and false breakouts due to the lack of an established trend regime.
This analysis is for educational purposes only, not financial advice. Always manage your own risk.
#RADAR #Crypto #BTCUSDT
BTCUSDT Market Structure Analysis
$BTC
Market Context:
- Current Trend: Neutral
- Condition: Consolidation around 100.0
- Observation: Volume ratio stands at 1.0, indicating baseline market participation.
Technical Levels:
- Support Zone: Below 100.0
- Resistance Zone: Above 100.0
- Trend Direction: Neutral
Scenario:
Bullish Scenario:
- Acceptance and hold above 100.0 backed by expanding volume.
Bearish Scenario:
- Invalidation and break below 100.0 driven by sustained sell volume.
Risk:
- Range chop and false breakouts due to the lack of an established trend regime.
This analysis is for educational purposes only, not financial advice. Always manage your own risk.
#RADAR #Crypto #BTCUSDT
$BTC
Market Context:
- Current Trend: Neutral
- Condition: Consolidation around 100.0
- Observation: Volume ratio stands at 1.0, indicating baseline market participation.
Technical Levels:
- Support Zone: Below 100.0
- Resistance Zone: Above 100.0
- Trend Direction: Neutral
Scenario:
Bullish Scenario:
- Acceptance and hold above 100.0 backed by expanding volume.
Bearish Scenario:
- Invalidation and break below 100.0 driven by sustained sell volume.
Risk:
- Range chop and false breakouts due to the lack of an established trend regime.
This analysis is for educational purposes only, not financial advice. Always manage your own risk.
#RADAR #Crypto #BTCUSDT

·
--
$BTC Update 🔎 Bitcoin at $64.8K — Is a recovery developing?
Bitcoin remains under pressure following a significant market correction. The latest rebound has struggled to establish stronger momentum, while macroeconomic uncertainty and institutional fund flows remain important market considerations.
🔥 Key catalyst:
Strategy purchased 485 BTC for approximately $33.4 million between November 9 and 15, bringing its holdings to 850,849 BTC.
👀 Next step to watch:
🔴 Bearish case: A break below $63,900 could expose $62,000 and potentially $60,000.
🟢 Bullish case: Reclaiming $65,700 could open a recovery toward $66,100 and $68,000.
📝 My take:
Bitcoin needs stronger buying volume and a sustained recovery above resistance to improve its short-term outlook.
👉 Visit blockvia.cc for Signal Analysis.
#Bitcoin #BTC #CryptoNews #BTCUSDT #CryptoAnalysis #Blockvia
$BTC Update 🔎 Bitcoin at $64.8K — Is a recovery developing?
Bitcoin remains under pressure following a significant market correction. The latest rebound has struggled to establish stronger momentum, while macroeconomic uncertainty and institutional fund flows remain important market considerations.
🔥 Key catalyst:
Strategy purchased 485 BTC for approximately $33.4 million between November 9 and 15, bringing its holdings to 850,849 BTC.
👀 Next step to watch:
🔴 Bearish case: A break below $63,900 could expose $62,000 and potentially $60,000.
🟢 Bullish case: Reclaiming $65,700 could open a recovery toward $66,100 and $68,000.
📝 My take:
Bitcoin needs stronger buying volume and a sustained recovery above resistance to improve its short-term outlook.
👉 Visit blockvia.cc for Signal Analysis.
#Bitcoin #BTC #CryptoNews #BTCUSDT #CryptoAnalysis #Blockvia
Bitcoin remains under pressure following a significant market correction. The latest rebound has struggled to establish stronger momentum, while macroeconomic uncertainty and institutional fund flows remain important market considerations.
🔥 Key catalyst:
Strategy purchased 485 BTC for approximately $33.4 million between November 9 and 15, bringing its holdings to 850,849 BTC.
👀 Next step to watch:
🔴 Bearish case: A break below $63,900 could expose $62,000 and potentially $60,000.
🟢 Bullish case: Reclaiming $65,700 could open a recovery toward $66,100 and $68,000.
📝 My take:
Bitcoin needs stronger buying volume and a sustained recovery above resistance to improve its short-term outlook.
👉 Visit blockvia.cc for Signal Analysis.
#Bitcoin #BTC #CryptoNews #BTCUSDT #CryptoAnalysis #Blockvia

22

·
--
Article
Bitcoin at $64K: Will BTC Recover or Face Another Major Drop?Bitcoin (BTC) Price Analysis: Is the Market Preparing for a Recovery or Another Major Move?
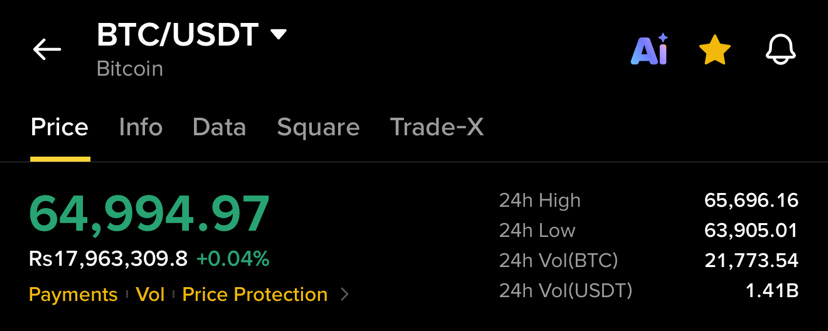
Bitcoin is currently trading around $64,994, and the daily chart is showing a market that deserves serious attention. After facing consistent selling pressure over recent sessions, BTC has experienced a significant decline from the $80,000–$84,000 region toward the $65,000 level.
The latest price action reflects a challenging environment for buyers. Bitcoin is down approximately 12.99% over the past seven days and 20.26% over the past 30 days. These numbers highlight the strength of the recent correction and show how quickly market sentiment has changed.
Market Structure: Bears Still Have Control
Looking at the 1D chart, Bitcoin has been forming a clear downward structure, with lower highs and lower lows. This indicates that sellers have maintained control throughout much of the recent movement.
One of the most important developments is the sharp decline toward the $64,000–$65,000 region. The selling candles are relatively large, suggesting strong bearish momentum. Trading volume also increased during the major downward movement, indicating significant market participation.
However, the latest candles show some hesitation around the current price area. This could be an early sign that buyers are attempting to defend this region.
Important Support Levels
The $64,000–$63,900 area is an important short-term support zone to monitor. Bitcoin’s recent 24-hour low is approximately $63,905.
If buyers manage to defend this region and push the price higher, BTC could attempt a recovery toward $65,700, followed by the $68,000 area.
However, if Bitcoin loses the $63,900 support zone with strong selling volume, additional downside pressure could develop. In that situation, traders will be watching for the next areas where buyers might become active.
Resistance: What Must Bitcoin Reclaim?
On the upside, $65,700 is the first nearby level to watch, based on the recent 24-hour high.
Beyond that, $68,000 represents another important resistance area. A sustained move above this level could improve short-term sentiment and create an opportunity for a stronger recovery.
Still, a temporary green candle does not necessarily confirm a trend reversal. Bitcoin needs stronger buying volume and consistent daily closes above important resistance levels before the market structure can meaningfully improve.
Volume and Market Sentiment
Volume is particularly interesting in the current setup. The recent decline has been accompanied by noticeable selling activity, showing that the downward move has attracted substantial participation.
The next important signal will be whether buying volume increases around the current support zone. If buyers begin stepping in with strength, Bitcoin could enter a consolidation phase before attempting its next major move.
On the other hand, continued heavy selling could keep the market under pressure.
Final Outlook: The Next Move Could Be Important
Bitcoin is approaching a critical area where the battle between buyers and sellers could determine its next short-term direction.
The $63,900–$64,000 region remains important for support, while $65,700 and $68,000 are the immediate upside levels worth monitoring.
For now, the daily chart continues to reflect bearish pressure, but the market is showing signs of hesitation after the sharp decline. The coming daily candles will be important in determining whether BTC can establish a base for recovery or whether sellers will push prices lower.
Bitcoin has entered an important phase, and the next move deserves close attention.
What do you think? Will BTC defend the $64K region and begin a recovery, or are we going to see another breakdown?
Share your BTC outlook in the comments. Let’s see what the market brings next!
#BTCUSDT #BitcoinAnalysis #CryptoMarket #TechnicalAnalysis #BinanceSquare $BTC
{spot}(BTCUSDT)
Bitcoin at $64K: Will BTC Recover or Face Another Major Drop?
Bitcoin (BTC) Price Analysis: Is the Market Preparing for a Recovery or Another Major Move?
Bitcoin is currently trading around $64,994, and the daily chart is showing a market that deserves serious attention. After facing consistent selling pressure over recent sessions, BTC has experienced a significant decline from the $80,000–$84,000 region toward the $65,000 level.
The latest price action reflects a challenging environment for buyers. Bitcoin is down approximately 12.99% over the past seven days and 20.26% over the past 30 days. These numbers highlight the strength of the recent correction and show how quickly market sentiment has changed.
Market Structure: Bears Still Have Control
Looking at the 1D chart, Bitcoin has been forming a clear downward structure, with lower highs and lower lows. This indicates that sellers have maintained control throughout much of the recent movement.
One of the most important developments is the sharp decline toward the $64,000–$65,000 region. The selling candles are relatively large, suggesting strong bearish momentum. Trading volume also increased during the major downward movement, indicating significant market participation.
However, the latest candles show some hesitation around the current price area. This could be an early sign that buyers are attempting to defend this region.
Important Support Levels
The $64,000–$63,900 area is an important short-term support zone to monitor. Bitcoin’s recent 24-hour low is approximately $63,905.
If buyers manage to defend this region and push the price higher, BTC could attempt a recovery toward $65,700, followed by the $68,000 area.
However, if Bitcoin loses the $63,900 support zone with strong selling volume, additional downside pressure could develop. In that situation, traders will be watching for the next areas where buyers might become active.
Resistance: What Must Bitcoin Reclaim?
On the upside, $65,700 is the first nearby level to watch, based on the recent 24-hour high.
Beyond that, $68,000 represents another important resistance area. A sustained move above this level could improve short-term sentiment and create an opportunity for a stronger recovery.
Still, a temporary green candle does not necessarily confirm a trend reversal. Bitcoin needs stronger buying volume and consistent daily closes above important resistance levels before the market structure can meaningfully improve.
Volume and Market Sentiment
Volume is particularly interesting in the current setup. The recent decline has been accompanied by noticeable selling activity, showing that the downward move has attracted substantial participation.
The next important signal will be whether buying volume increases around the current support zone. If buyers begin stepping in with strength, Bitcoin could enter a consolidation phase before attempting its next major move.
On the other hand, continued heavy selling could keep the market under pressure.
Final Outlook: The Next Move Could Be Important
Bitcoin is approaching a critical area where the battle between buyers and sellers could determine its next short-term direction.
The $63,900–$64,000 region remains important for support, while $65,700 and $68,000 are the immediate upside levels worth monitoring.
For now, the daily chart continues to reflect bearish pressure, but the market is showing signs of hesitation after the sharp decline. The coming daily candles will be important in determining whether BTC can establish a base for recovery or whether sellers will push prices lower.
Bitcoin has entered an important phase, and the next move deserves close attention.
What do you think? Will BTC defend the $64K region and begin a recovery, or are we going to see another breakdown?
Share your BTC outlook in the comments. Let’s see what the market brings next!
#BTCUSDT #BitcoinAnalysis #CryptoMarket #TechnicalAnalysis #BinanceSquare $BTC
Bitcoin is currently trading around $64,994, and the daily chart is showing a market that deserves serious attention. After facing consistent selling pressure over recent sessions, BTC has experienced a significant decline from the $80,000–$84,000 region toward the $65,000 level.
The latest price action reflects a challenging environment for buyers. Bitcoin is down approximately 12.99% over the past seven days and 20.26% over the past 30 days. These numbers highlight the strength of the recent correction and show how quickly market sentiment has changed.
Market Structure: Bears Still Have Control
Looking at the 1D chart, Bitcoin has been forming a clear downward structure, with lower highs and lower lows. This indicates that sellers have maintained control throughout much of the recent movement.
One of the most important developments is the sharp decline toward the $64,000–$65,000 region. The selling candles are relatively large, suggesting strong bearish momentum. Trading volume also increased during the major downward movement, indicating significant market participation.
However, the latest candles show some hesitation around the current price area. This could be an early sign that buyers are attempting to defend this region.
Important Support Levels
The $64,000–$63,900 area is an important short-term support zone to monitor. Bitcoin’s recent 24-hour low is approximately $63,905.
If buyers manage to defend this region and push the price higher, BTC could attempt a recovery toward $65,700, followed by the $68,000 area.
However, if Bitcoin loses the $63,900 support zone with strong selling volume, additional downside pressure could develop. In that situation, traders will be watching for the next areas where buyers might become active.
Resistance: What Must Bitcoin Reclaim?
On the upside, $65,700 is the first nearby level to watch, based on the recent 24-hour high.
Beyond that, $68,000 represents another important resistance area. A sustained move above this level could improve short-term sentiment and create an opportunity for a stronger recovery.
Still, a temporary green candle does not necessarily confirm a trend reversal. Bitcoin needs stronger buying volume and consistent daily closes above important resistance levels before the market structure can meaningfully improve.
Volume and Market Sentiment
Volume is particularly interesting in the current setup. The recent decline has been accompanied by noticeable selling activity, showing that the downward move has attracted substantial participation.
The next important signal will be whether buying volume increases around the current support zone. If buyers begin stepping in with strength, Bitcoin could enter a consolidation phase before attempting its next major move.
On the other hand, continued heavy selling could keep the market under pressure.
Final Outlook: The Next Move Could Be Important
Bitcoin is approaching a critical area where the battle between buyers and sellers could determine its next short-term direction.
The $63,900–$64,000 region remains important for support, while $65,700 and $68,000 are the immediate upside levels worth monitoring.
For now, the daily chart continues to reflect bearish pressure, but the market is showing signs of hesitation after the sharp decline. The coming daily candles will be important in determining whether BTC can establish a base for recovery or whether sellers will push prices lower.
Bitcoin has entered an important phase, and the next move deserves close attention.
What do you think? Will BTC defend the $64K region and begin a recovery, or are we going to see another breakdown?
Share your BTC outlook in the comments. Let’s see what the market brings next!
#BTCUSDT #BitcoinAnalysis #CryptoMarket #TechnicalAnalysis #BinanceSquare $BTC
25
🐻 $BTC /USDT — BITCOIN SHORT SIGNAL
📉 Market Bias: BEARISH BELOW RESISTANCE
💰 Reference Price: $65,058
🎯 SHORT ENTRY: $64,750–$64,500 Wait for bearish confirmation and failed retest.
🔥 TAKE PROFIT: ✅ TP1: $64,076 ✅ TP2: $63,095 ✅ TP3: $62,478
🛑 STOP LOSS: $65,900
📊 Confirmation: 15-minute candle close below $64,500 with selling volume.
⚠️ No confirmation = No trade. Use stop-loss. Avoid excessive leverage.
#BTC #Bitcoin #BTCUSDT #BinanceSquare #CryptoSignals
🐻 $BTC /USDT — BITCOIN SHORT SIGNAL
📉 Market Bias: BEARISH BELOW RESISTANCE
💰 Reference Price: $65,058
🎯 SHORT ENTRY: $64,750–$64,500 Wait for bearish confirmation and failed retest.
🔥 TAKE PROFIT: ✅ TP1: $64,076 ✅ TP2: $63,095 ✅ TP3: $62,478
🛑 STOP LOSS: $65,900
📊 Confirmation: 15-minute candle close below $64,500 with selling volume.
⚠️ No confirmation = No trade. Use stop-loss. Avoid excessive leverage.
#BTC #Bitcoin #BTCUSDT #BinanceSquare #CryptoSignals
📉 Market Bias: BEARISH BELOW RESISTANCE
💰 Reference Price: $65,058
🎯 SHORT ENTRY: $64,750–$64,500 Wait for bearish confirmation and failed retest.
🔥 TAKE PROFIT: ✅ TP1: $64,076 ✅ TP2: $63,095 ✅ TP3: $62,478
🛑 STOP LOSS: $65,900
📊 Confirmation: 15-minute candle close below $64,500 with selling volume.
⚠️ No confirmation = No trade. Use stop-loss. Avoid excessive leverage.
#BTC #Bitcoin #BTCUSDT #BinanceSquare #CryptoSignals
1
54

·
--
Bearish
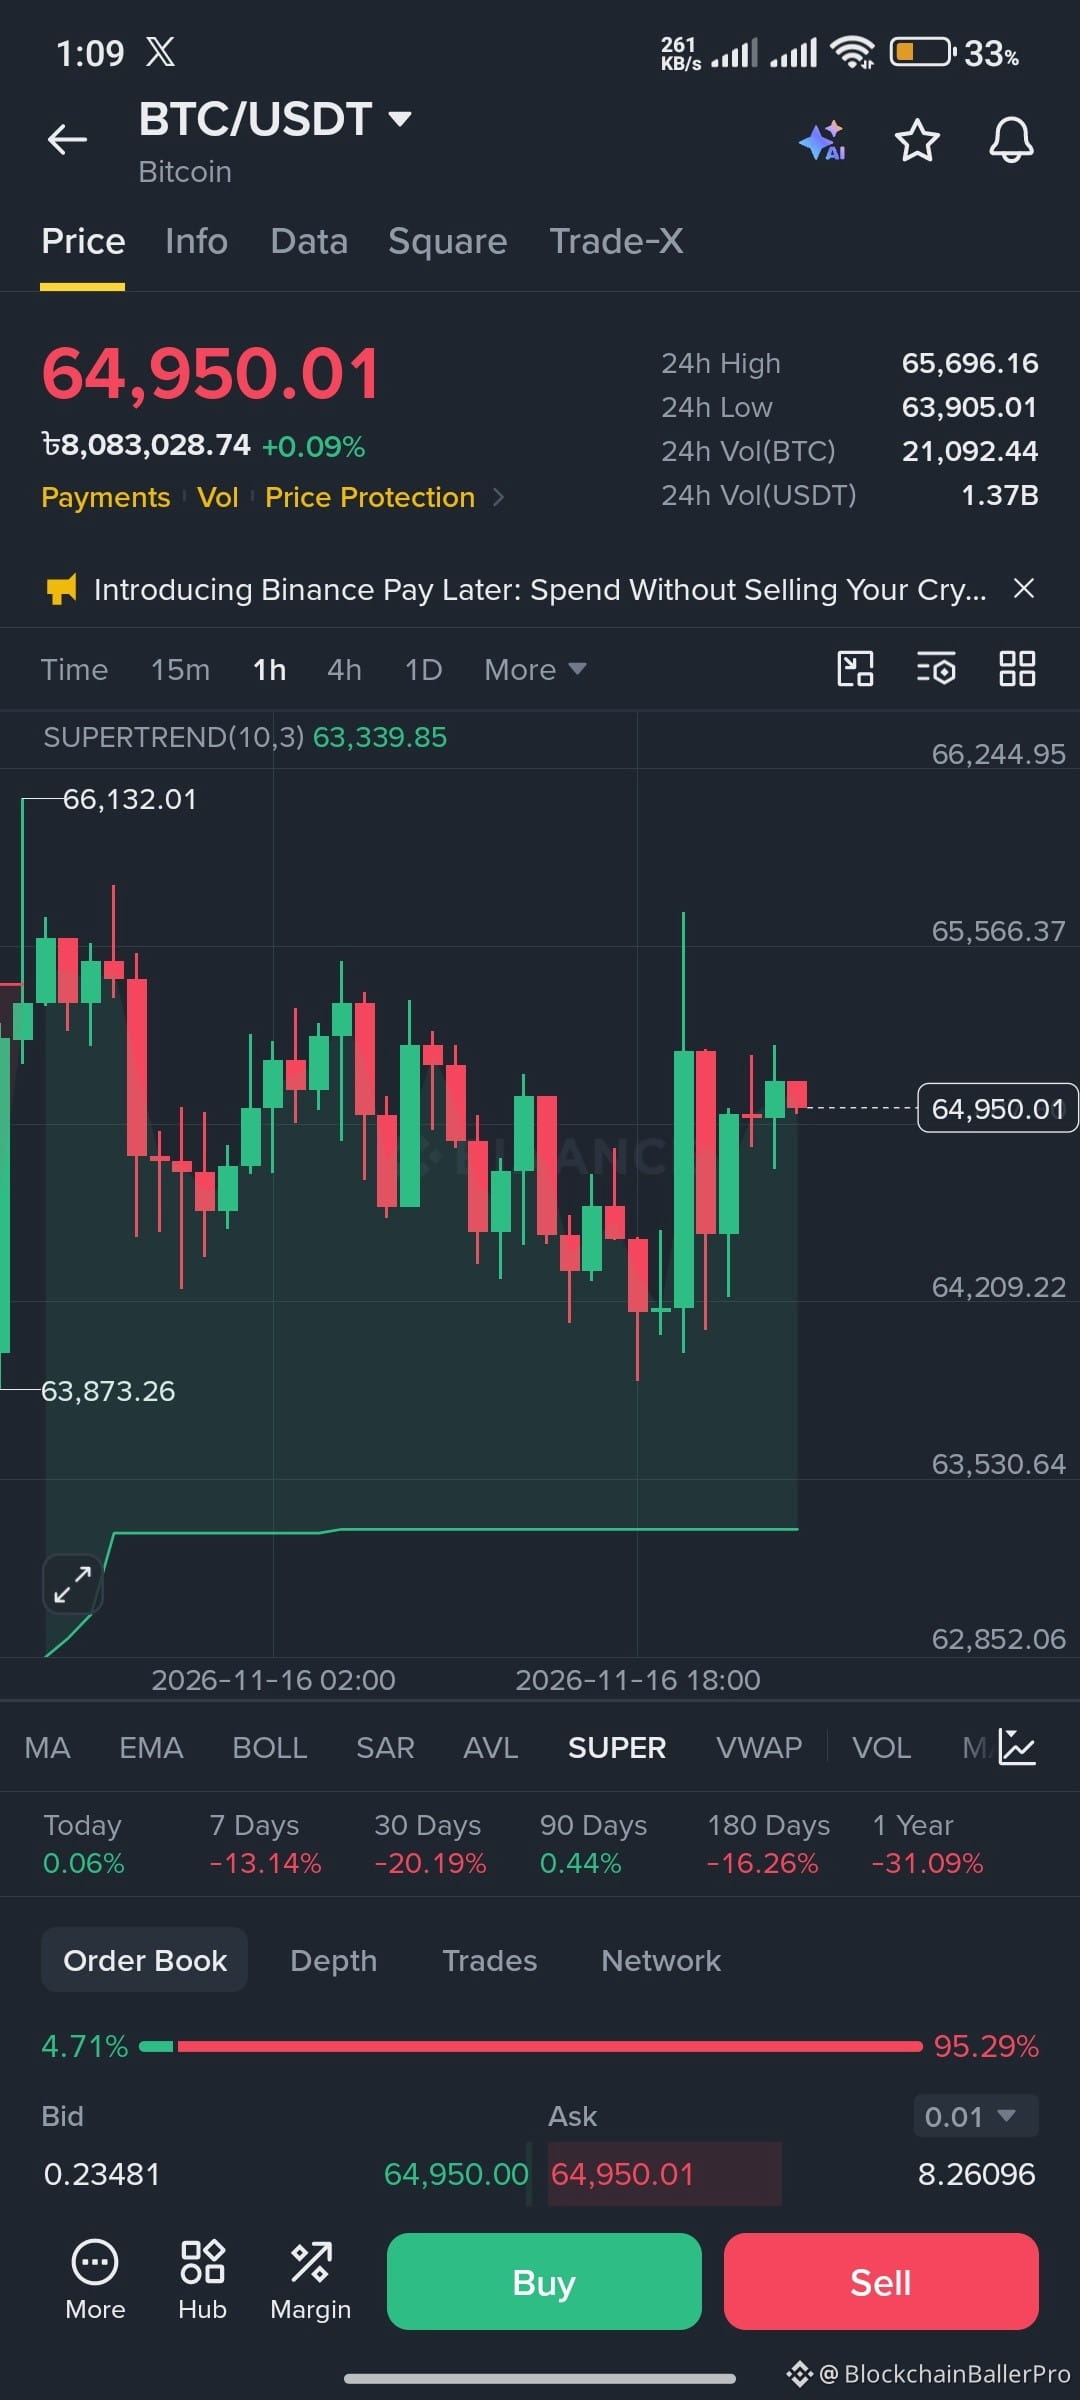
$BTC breakout or another rejection?
BTC is hovering around $64,950 after a sharp rebound.My key zone: $65,550–$65,700.A
confirmed 1H close above it would put the visible $66,130 swing high in focus. Lose $64,200 instead,and I’m watching $63,900 next.�
I’m watching for volume confirmation—not chasing the first candle.No confirmation,
no trade. Protect your capital first.�
#BTC #Bitcoin #BTCUSDT $BTC
{future}(BTCUSDT)
$BTC breakout or another rejection?
BTC is hovering around $64,950 after a sharp rebound.My key zone: $65,550–$65,700.A
confirmed 1H close above it would put the visible $66,130 swing high in focus. Lose $64,200 instead,and I’m watching $63,900 next.�
I’m watching for volume confirmation—not chasing the first candle.No confirmation,
no trade. Protect your capital first.�
#BTC #Bitcoin #BTCUSDT $BTC
BTC is hovering around $64,950 after a sharp rebound.My key zone: $65,550–$65,700.A
confirmed 1H close above it would put the visible $66,130 swing high in focus. Lose $64,200 instead,and I’m watching $63,900 next.�
I’m watching for volume confirmation—not chasing the first candle.No confirmation,
no trade. Protect your capital first.�
#BTC #Bitcoin #BTCUSDT $BTC
13
Log in to explore more content
Join global crypto users on Binance Square
⚡️ Get latest and useful information about crypto.
💬 Trusted by the world’s largest crypto exchange.
👍 Discover real insights from verified creators.
Email / Phone number
Trending Topics
1
#NvidiaEarningsTonight:AIStocks’NextMove?
40,499 views
657 Discussing
2
#A Packed Week of Earnings and Data Tests Markets
112,981 views
574 Discussing
3
#AnthropicIPOTestsInvestorAppetiteForAI
242,329 views
2,406 Discussing
4
#NvidiaBoardNotConsideringHuang’sReturnasCEO
60,323 views
649 Discussing
5
#KOSPIFalls2.59%ToLowestCloseSinceFebruary
3,865 views
93 Discussing
6
#AnthropicClearedToListOnNasdaqAsANT
6,243 views
104 Discussing
7
#WhatInvestmentSignalsDo13FFilingsReveal?
36,267 views
498 Discussing
8
#TetherCapitalMakesStrategicInvestmentInStables
232 views
8 Discussing
9
#EvernorthRecords$505MImpairmentOnPreListingXRP
800 views
15 Discussing
10
#GoldmanSachsReports$1.22BInEtherETFHoldings
627 views
13 Discussing