
#rsi
rsi
1.5M views
4,771 Discussing
Hot
Latest

·
--
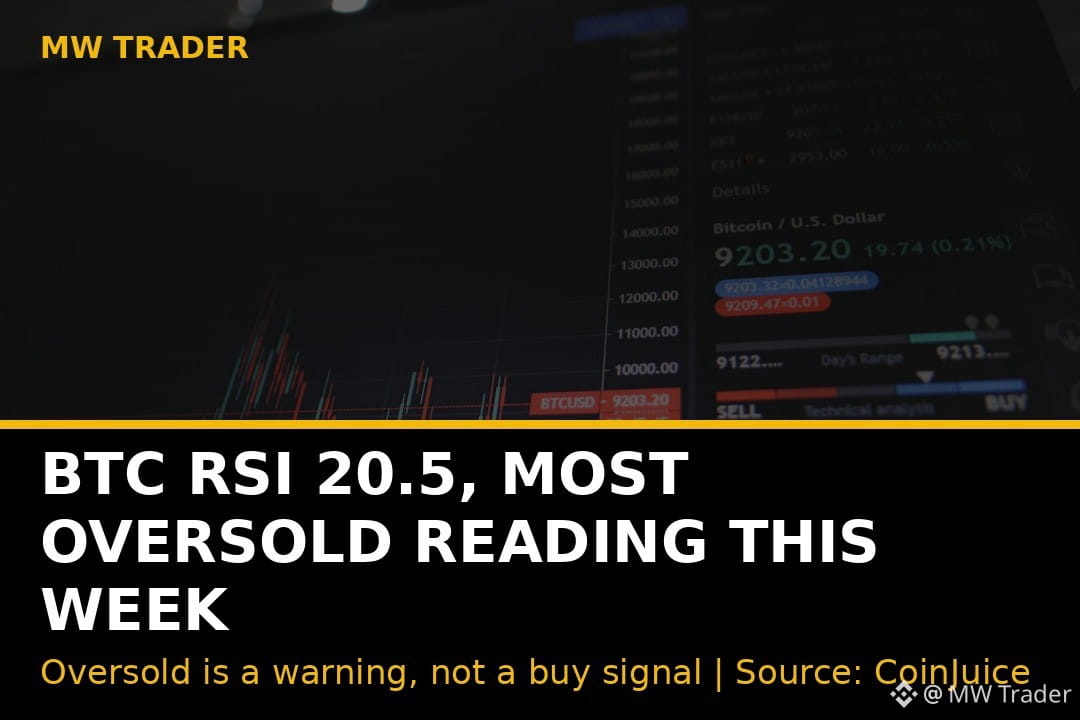
Bitcoin RSI is 20.5, the most oversold reading this week. Here is how I read it. 📚
Bitcoin daily RSI has fallen to 20.5, the lowest reading this week, according to CoinJuice calculations from CryptoQuant daily closes, and RSI near 20 means the market is heavily oversold. But oversold is not a buy signal on its own. Oversold can stay oversold for days while price keeps falling, and every trader who bought the first oversold reading became exit liquidity for the next leg down. What I wait for is a higher low on the 4 hour chart plus RSI turning up from below 30, and only then do I look for a long with a tight stop. 💡
Do you buy when RSI hits 20, or wait for RSI to turn up first? 🤔
Source: CoinJuice.
Futures trading is risky, trade small and manage risk. ⚠️
Follow for more trades.
#Crypto #Bitcoin #FuturesTrading #TradingSignals #RSI
Bitcoin RSI is 20.5, the most oversold reading this week. Here is how I read it. 📚
Bitcoin daily RSI has fallen to 20.5, the lowest reading this week, according to CoinJuice calculations from CryptoQuant daily closes, and RSI near 20 means the market is heavily oversold. But oversold is not a buy signal on its own. Oversold can stay oversold for days while price keeps falling, and every trader who bought the first oversold reading became exit liquidity for the next leg down. What I wait for is a higher low on the 4 hour chart plus RSI turning up from below 30, and only then do I look for a long with a tight stop. 💡
Do you buy when RSI hits 20, or wait for RSI to turn up first? 🤔
Source: CoinJuice.
Futures trading is risky, trade small and manage risk. ⚠️
Follow for more trades.
#Crypto #Bitcoin #FuturesTrading #TradingSignals #RSI
Bitcoin daily RSI has fallen to 20.5, the lowest reading this week, according to CoinJuice calculations from CryptoQuant daily closes, and RSI near 20 means the market is heavily oversold. But oversold is not a buy signal on its own. Oversold can stay oversold for days while price keeps falling, and every trader who bought the first oversold reading became exit liquidity for the next leg down. What I wait for is a higher low on the 4 hour chart plus RSI turning up from below 30, and only then do I look for a long with a tight stop. 💡
Do you buy when RSI hits 20, or wait for RSI to turn up first? 🤔
Source: CoinJuice.
Futures trading is risky, trade small and manage risk. ⚠️
Follow for more trades.
#Crypto #Bitcoin #FuturesTrading #TradingSignals #RSI
3
·
--
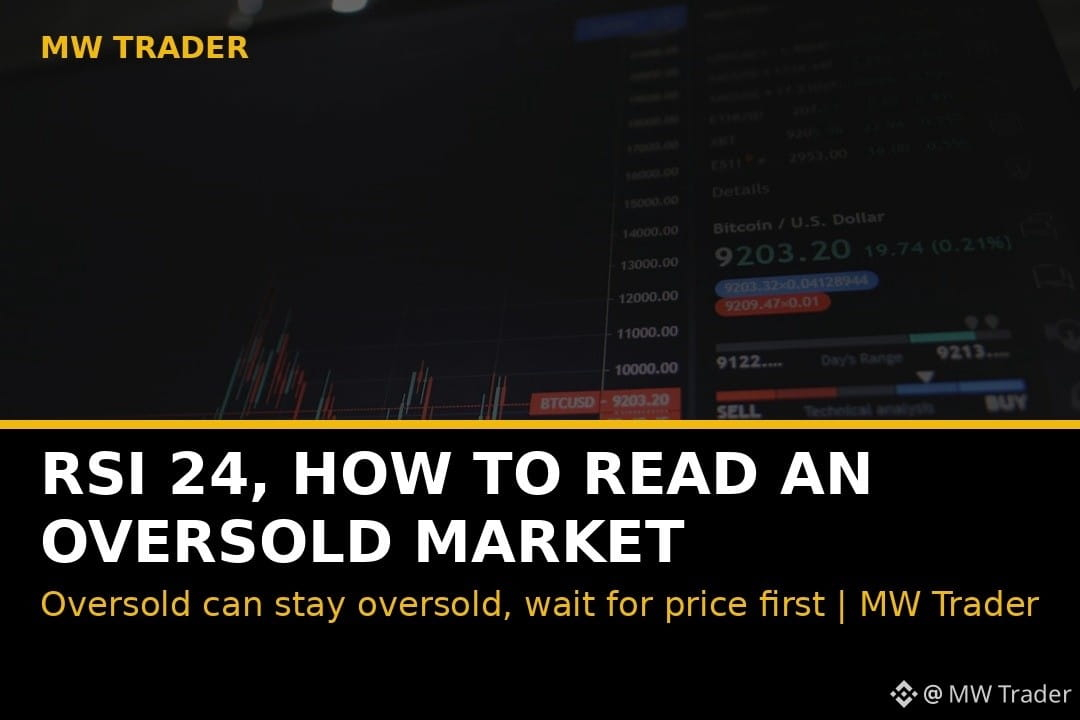
Bitcoin RSI is near 24. Here is how to read an oversold market without getting trapped. 📚
Bitcoin RSI hovers in oversold territory near 24, according to FXStreet, which means downside momentum is strong even if it looks stretched, and price is still holding well below the 50 day, 100 day and 200 day moving averages clustered between roughly $75,200 and $75,700. My lesson from this market is simple: oversold can stay oversold for days, and buying just because RSI is low is how traders catch a falling knife. Wait for price to hold a level, like $61,273, and for RSI to turn up from the low, then buy small with a stop under the low. 💡
Do you buy when RSI hits 24, or wait for price to confirm the turn first? 🤔
Source: FXStreet.
Futures trading is risky, trade small and manage risk. ⚠️
Follow for more trades.
#Crypto #Bitcoin #FuturesTrading #TradingSignals #RSI
Bitcoin RSI is near 24. Here is how to read an oversold market without getting trapped. 📚
Bitcoin RSI hovers in oversold territory near 24, according to FXStreet, which means downside momentum is strong even if it looks stretched, and price is still holding well below the 50 day, 100 day and 200 day moving averages clustered between roughly $75,200 and $75,700. My lesson from this market is simple: oversold can stay oversold for days, and buying just because RSI is low is how traders catch a falling knife. Wait for price to hold a level, like $61,273, and for RSI to turn up from the low, then buy small with a stop under the low. 💡
Do you buy when RSI hits 24, or wait for price to confirm the turn first? 🤔
Source: FXStreet.
Futures trading is risky, trade small and manage risk. ⚠️
Follow for more trades.
#Crypto #Bitcoin #FuturesTrading #TradingSignals #RSI
Bitcoin RSI hovers in oversold territory near 24, according to FXStreet, which means downside momentum is strong even if it looks stretched, and price is still holding well below the 50 day, 100 day and 200 day moving averages clustered between roughly $75,200 and $75,700. My lesson from this market is simple: oversold can stay oversold for days, and buying just because RSI is low is how traders catch a falling knife. Wait for price to hold a level, like $61,273, and for RSI to turn up from the low, then buy small with a stop under the low. 💡
Do you buy when RSI hits 24, or wait for price to confirm the turn first? 🤔
Source: FXStreet.
Futures trading is risky, trade small and manage risk. ⚠️
Follow for more trades.
#Crypto #Bitcoin #FuturesTrading #TradingSignals #RSI

·
--
RSI, MACD, Bollinger Bands, and EMAs help spot trend shifts without guessing the market. RSI measures momentum. A reading over 70 suggests the asset is overbought; under 30 signals oversold. On $BTC, an RSI of 68 on Monday could mean a short pullback is likely. MACD compares two EMAs. When the fast line crosses above the slow line, a bullish momentum may begin. A negative histogram that turns positive shows a potential trend change. Bollinger Bands use a 20‑period SMA with ±2 standard deviations. When $ETH touches the upper band, it may be overextended. A squeeze—bands close together—often precedes a big move. EMAs smooth . A 12‑EMA crossing above a 26‑EMA creates a bullish signal; a 200‑EMA is a long‑term support line. Use these tools together to spot entry points. CryptoTrading #TechnicalAnalysis #RSI #BollingerBands
RSI, MACD, Bollinger Bands, and EMAs help spot trend shifts without guessing the market. RSI measures momentum. A reading over 70 suggests the asset is overbought; under 30 signals oversold. On $BTC , an RSI of 68 on Monday could mean a short pullback is likely. MACD compares two EMAs. When the fast line crosses above the slow line, a bullish momentum may begin. A negative histogram that turns positive shows a potential trend change. Bollinger Bands use a 20‑period SMA with ±2 standard deviations. When $ETH touches the upper band, it may be overextended. A squeeze—bands close together—often precedes a big move. EMAs smooth . A 12‑EMA crossing above a 26‑EMA creates a bullish signal; a 200‑EMA is a long‑term support line. Use these tools together to spot entry points. CryptoTrading #TechnicalAnalysis #RSI #BollingerBands
80

·
--
Bearish
🔴 SOL REMAINS STEADY, BUT WHAT DOES THE RSI SAY?
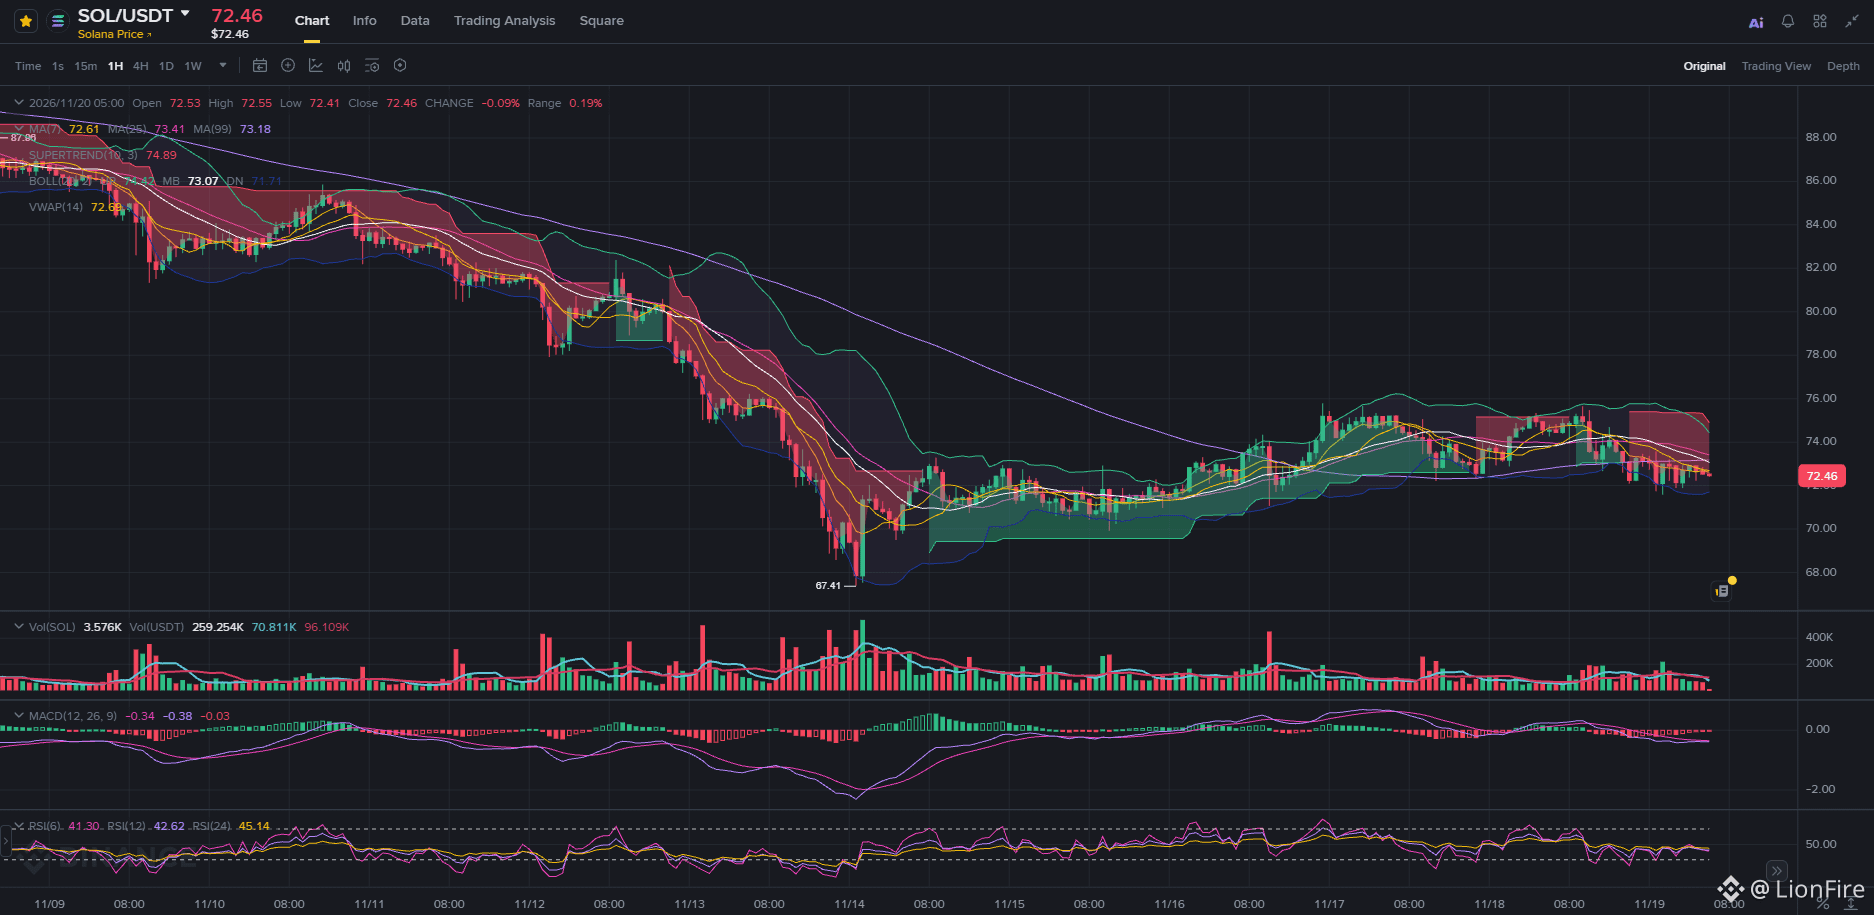
Despite a 2.27% drop, $SOL is trading at $72.680, staying close to its 25-period moving average and holding above the 24h support at $71.590. The 1H RSI(6) is at 45.66, in the neutral equilibrium zone, suggesting a possible technical recovery.
🔍 1. Technical and macroeconomic analysis:
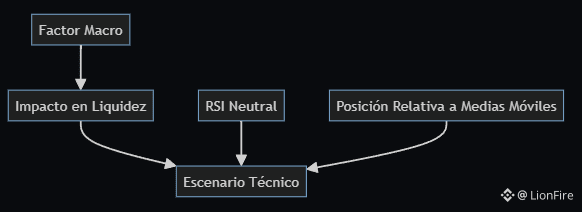
The drop in $BTC following Anthropic’s initial public offering has triggered massive liquidations across the market, affecting assets such as $SOL. However, the price remains within its usual volatility range, supported by its position relative to the moving averages and the 24h VWAP.
The 1H structure shows that the price is below MA7 ($72.713), MA25 ($73.502), and the 24h VWAP ($73.387). Although a clear rebound has not been confirmed, the price’s proximity to the 25-period moving average suggests the market could be poised for a reaction.
🧠 2. Tactical discipline during a downturn:
When an asset falls, it’s easy to panic or try to catch falling knives. However, an institutional trader knows that sharp moves are often backed by high volumes and don’t always signal the end of a trend.
The RSI in the neutral zone is a clear signal: the market is balanced, and a recovery could be just around the corner. But that doesn’t mean we should chase green candles without a plan.
💡 Market structure, liquidity, and technical indicators are tools, not emotions. Keep a cool head and trade with a clear plan.
#solana #BTC #RSI
🔴 SOL REMAINS STEADY, BUT WHAT DOES THE RSI SAY?
Despite a 2.27% drop, $SOL is trading at $72.680, staying close to its 25-period moving average and holding above the 24h support at $71.590. The 1H RSI(6) is at 45.66, in the neutral equilibrium zone, suggesting a possible technical recovery.
🔍 1. Technical and macroeconomic analysis:
The drop in $BTC following Anthropic’s initial public offering has triggered massive liquidations across the market, affecting assets such as $SOL . However, the price remains within its usual volatility range, supported by its position relative to the moving averages and the 24h VWAP.
The 1H structure shows that the price is below MA7 ($72.713), MA25 ($73.502), and the 24h VWAP ($73.387). Although a clear rebound has not been confirmed, the price’s proximity to the 25-period moving average suggests the market could be poised for a reaction.
🧠 2. Tactical discipline during a downturn:
When an asset falls, it’s easy to panic or try to catch falling knives. However, an institutional trader knows that sharp moves are often backed by high volumes and don’t always signal the end of a trend.
The RSI in the neutral zone is a clear signal: the market is balanced, and a recovery could be just around the corner. But that doesn’t mean we should chase green candles without a plan.
💡 Market structure, liquidity, and technical indicators are tools, not emotions. Keep a cool head and trade with a clear plan.
#solana #BTC #RSI
Despite a 2.27% drop, $SOL is trading at $72.680, staying close to its 25-period moving average and holding above the 24h support at $71.590. The 1H RSI(6) is at 45.66, in the neutral equilibrium zone, suggesting a possible technical recovery.
🔍 1. Technical and macroeconomic analysis:
The drop in $BTC following Anthropic’s initial public offering has triggered massive liquidations across the market, affecting assets such as $SOL . However, the price remains within its usual volatility range, supported by its position relative to the moving averages and the 24h VWAP.
The 1H structure shows that the price is below MA7 ($72.713), MA25 ($73.502), and the 24h VWAP ($73.387). Although a clear rebound has not been confirmed, the price’s proximity to the 25-period moving average suggests the market could be poised for a reaction.
🧠 2. Tactical discipline during a downturn:
When an asset falls, it’s easy to panic or try to catch falling knives. However, an institutional trader knows that sharp moves are often backed by high volumes and don’t always signal the end of a trend.
The RSI in the neutral zone is a clear signal: the market is balanced, and a recovery could be just around the corner. But that doesn’t mean we should chase green candles without a plan.
💡 Market structure, liquidity, and technical indicators are tools, not emotions. Keep a cool head and trade with a clear plan.
#solana #BTC #RSI

109

·
--
$BTC's daily RSI14 is now just 20, while $LTC's daily RSI14 is 26. Both are firmly in oversold territory, but this isn't a call for a bounce—it's about making one thing clear: oversold doesn't mean it's time to buy the dip. That's the easiest way to misuse the RSI indicator.
As of 16:00, BTC is trading at 61859, down 2.9% over 24 hours, 9.4% over 7 days, and 26.4% over 30 days. It's 3% below the daily MA7, 15% below the MA25, and 20.6% below the MA99, with all three moving averages in a bearish alignment. Its 30-day range is 61291 to 84377, and the current price is right near the bottom, in the lowest 2% of that range. LTC is moving almost in lockstep: down 6.3% over 24 hours, 15.2% over 7 days, and 32% over 30 days, and it's also just 3% up from the bottom of its 30-day range. The two coins are rising and falling together, which suggests this isn't a sell-off in just one coin, but broad, systemic selling pressure across the sector. The RSI is low not because too few people are buying the dip, but because the trend itself is strong.
By the traditional definition, an RSI below 30 is oversold and above 70 is overbought. Many people see it drop below 30, or even to 20, and instinctively think a bounce is due. That's the easiest trap to fall into. In a strong trend, the RSI can become pinned near 20 for a long time without recovering. After each “oversold” reading, the price can go on to make another new low. Using this indicator alone to time an entry is like forcing rules from a sideways market onto a trending market.
I've fallen into this trap myself. I previously tested a reversal strategy using the same daily framework. The logic was straightforward: after a big drop, a bounce should follow; after a big rise, a pullback should follow. But across 27 assets in the time-series trend group, only 37% generated positive returns. By contrast, the out-of-sample results for the cross-sectional momentum strategy were positive. I tried many rounds of parameter tuning, but the reversal approach just lost money. The lesson is practical: just because an idea sounds reasonable doesn't mean it works. The value of backtesting is to disprove a hypothesis, not to find evidence for your intuition.
People in the community are discussing whether $57,500 is the next support level, while others have mentioned that $60,000 could be a short-term bottom. Sentiment is generally negative, and opinions are divided.
My own view is that while the moving averages are all bearish and the RSI is pinned low, I'm leaning toward continued choppy, weak price action. I wouldn't treat an RSI reading of 20 as a reversal signal or buy into it. For me to change my view, I'd first need to see the price reclaim the 4h MA20. Conversely, if it breaks below this cycle's low of 61291, that would mean my assessment was wrong.
#RSI #技术分析 #BTC
$BTC 's daily RSI14 is now just 20, while $LTC 's daily RSI14 is 26. Both are firmly in oversold territory, but this isn't a call for a bounce—it's about making one thing clear: oversold doesn't mean it's time to buy the dip. That's the easiest way to misuse the RSI indicator.
As of 16:00, BTC is trading at 61859, down 2.9% over 24 hours, 9.4% over 7 days, and 26.4% over 30 days. It's 3% below the daily MA7, 15% below the MA25, and 20.6% below the MA99, with all three moving averages in a bearish alignment. Its 30-day range is 61291 to 84377, and the current price is right near the bottom, in the lowest 2% of that range. LTC is moving almost in lockstep: down 6.3% over 24 hours, 15.2% over 7 days, and 32% over 30 days, and it's also just 3% up from the bottom of its 30-day range. The two coins are rising and falling together, which suggests this isn't a sell-off in just one coin, but broad, systemic selling pressure across the sector. The RSI is low not because too few people are buying the dip, but because the trend itself is strong.
By the traditional definition, an RSI below 30 is oversold and above 70 is overbought. Many people see it drop below 30, or even to 20, and instinctively think a bounce is due. That's the easiest trap to fall into. In a strong trend, the RSI can become pinned near 20 for a long time without recovering. After each “oversold” reading, the price can go on to make another new low. Using this indicator alone to time an entry is like forcing rules from a sideways market onto a trending market.
I've fallen into this trap myself. I previously tested a reversal strategy using the same daily framework. The logic was straightforward: after a big drop, a bounce should follow; after a big rise, a pullback should follow. But across 27 assets in the time-series trend group, only 37% generated positive returns. By contrast, the out-of-sample results for the cross-sectional momentum strategy were positive. I tried many rounds of parameter tuning, but the reversal approach just lost money. The lesson is practical: just because an idea sounds reasonable doesn't mean it works. The value of backtesting is to disprove a hypothesis, not to find evidence for your intuition.
People in the community are discussing whether $57,500 is the next support level, while others have mentioned that $60,000 could be a short-term bottom. Sentiment is generally negative, and opinions are divided.
My own view is that while the moving averages are all bearish and the RSI is pinned low, I'm leaning toward continued choppy, weak price action. I wouldn't treat an RSI reading of 20 as a reversal signal or buy into it. For me to change my view, I'd first need to see the price reclaim the 4h MA20. Conversely, if it breaks below this cycle's low of 61291, that would mean my assessment was wrong.
#RSI #技术分析 #BTC
As of 16:00, BTC is trading at 61859, down 2.9% over 24 hours, 9.4% over 7 days, and 26.4% over 30 days. It's 3% below the daily MA7, 15% below the MA25, and 20.6% below the MA99, with all three moving averages in a bearish alignment. Its 30-day range is 61291 to 84377, and the current price is right near the bottom, in the lowest 2% of that range. LTC is moving almost in lockstep: down 6.3% over 24 hours, 15.2% over 7 days, and 32% over 30 days, and it's also just 3% up from the bottom of its 30-day range. The two coins are rising and falling together, which suggests this isn't a sell-off in just one coin, but broad, systemic selling pressure across the sector. The RSI is low not because too few people are buying the dip, but because the trend itself is strong.
By the traditional definition, an RSI below 30 is oversold and above 70 is overbought. Many people see it drop below 30, or even to 20, and instinctively think a bounce is due. That's the easiest trap to fall into. In a strong trend, the RSI can become pinned near 20 for a long time without recovering. After each “oversold” reading, the price can go on to make another new low. Using this indicator alone to time an entry is like forcing rules from a sideways market onto a trending market.
I've fallen into this trap myself. I previously tested a reversal strategy using the same daily framework. The logic was straightforward: after a big drop, a bounce should follow; after a big rise, a pullback should follow. But across 27 assets in the time-series trend group, only 37% generated positive returns. By contrast, the out-of-sample results for the cross-sectional momentum strategy were positive. I tried many rounds of parameter tuning, but the reversal approach just lost money. The lesson is practical: just because an idea sounds reasonable doesn't mean it works. The value of backtesting is to disprove a hypothesis, not to find evidence for your intuition.
People in the community are discussing whether $57,500 is the next support level, while others have mentioned that $60,000 could be a short-term bottom. Sentiment is generally negative, and opinions are divided.
My own view is that while the moving averages are all bearish and the RSI is pinned low, I'm leaning toward continued choppy, weak price action. I wouldn't treat an RSI reading of 20 as a reversal signal or buy into it. For me to change my view, I'd first need to see the price reclaim the 4h MA20. Conversely, if it breaks below this cycle's low of 61291, that would mean my assessment was wrong.
#RSI #技术分析 #BTC
503

RSI is a momentum indicator, not a guaranteed reversal tool.
It measures the magnitude of recent price gains relative to losses. Readings above 70 are commonly described as overbought, while readings below 30 are described as oversold.
However, a token can remain overbought during a strong rally or oversold during a prolonged decline.
For $SHELL, the sharp mid-November move and subsequent pullback demonstrate why short-term indicators can change quickly. Without a consistent and timestamped indicator source, assigning a specific RSI reading would create false precision.
Understanding what an indicator measures is more useful than treating its thresholds as automatic trading instructions.
#RSI #TechnicalAnalysis #CryptoEducation
RSI is a momentum indicator, not a guaranteed reversal tool.
It measures the magnitude of recent price gains relative to losses. Readings above 70 are commonly described as overbought, while readings below 30 are described as oversold.
However, a token can remain overbought during a strong rally or oversold during a prolonged decline.
For $SHELL , the sharp mid-November move and subsequent pullback demonstrate why short-term indicators can change quickly. Without a consistent and timestamped indicator source, assigning a specific RSI reading would create false precision.
Understanding what an indicator measures is more useful than treating its thresholds as automatic trading instructions.
#RSI #TechnicalAnalysis #CryptoEducation
It measures the magnitude of recent price gains relative to losses. Readings above 70 are commonly described as overbought, while readings below 30 are described as oversold.
However, a token can remain overbought during a strong rally or oversold during a prolonged decline.
For $SHELL , the sharp mid-November move and subsequent pullback demonstrate why short-term indicators can change quickly. Without a consistent and timestamped indicator source, assigning a specific RSI reading would create false precision.
Understanding what an indicator measures is more useful than treating its thresholds as automatic trading instructions.
#RSI #TechnicalAnalysis #CryptoEducation
45

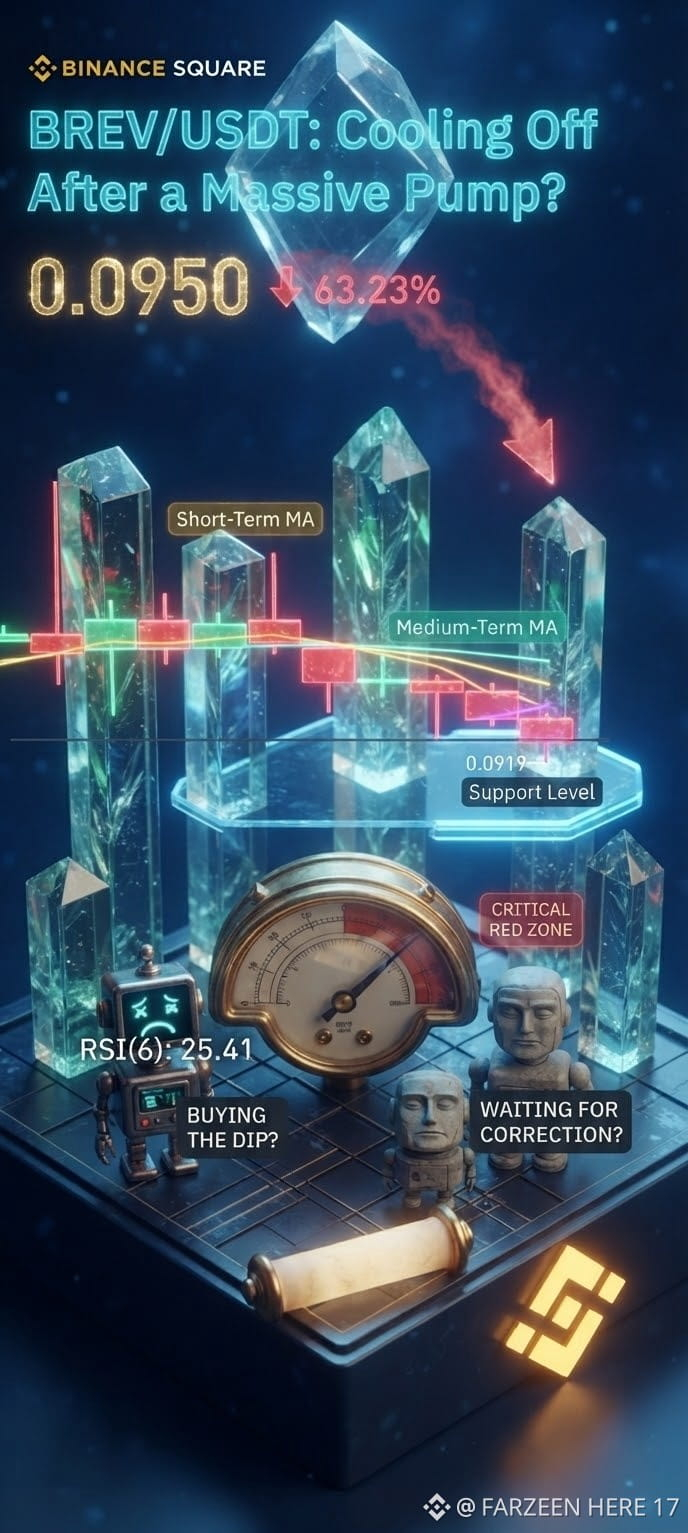
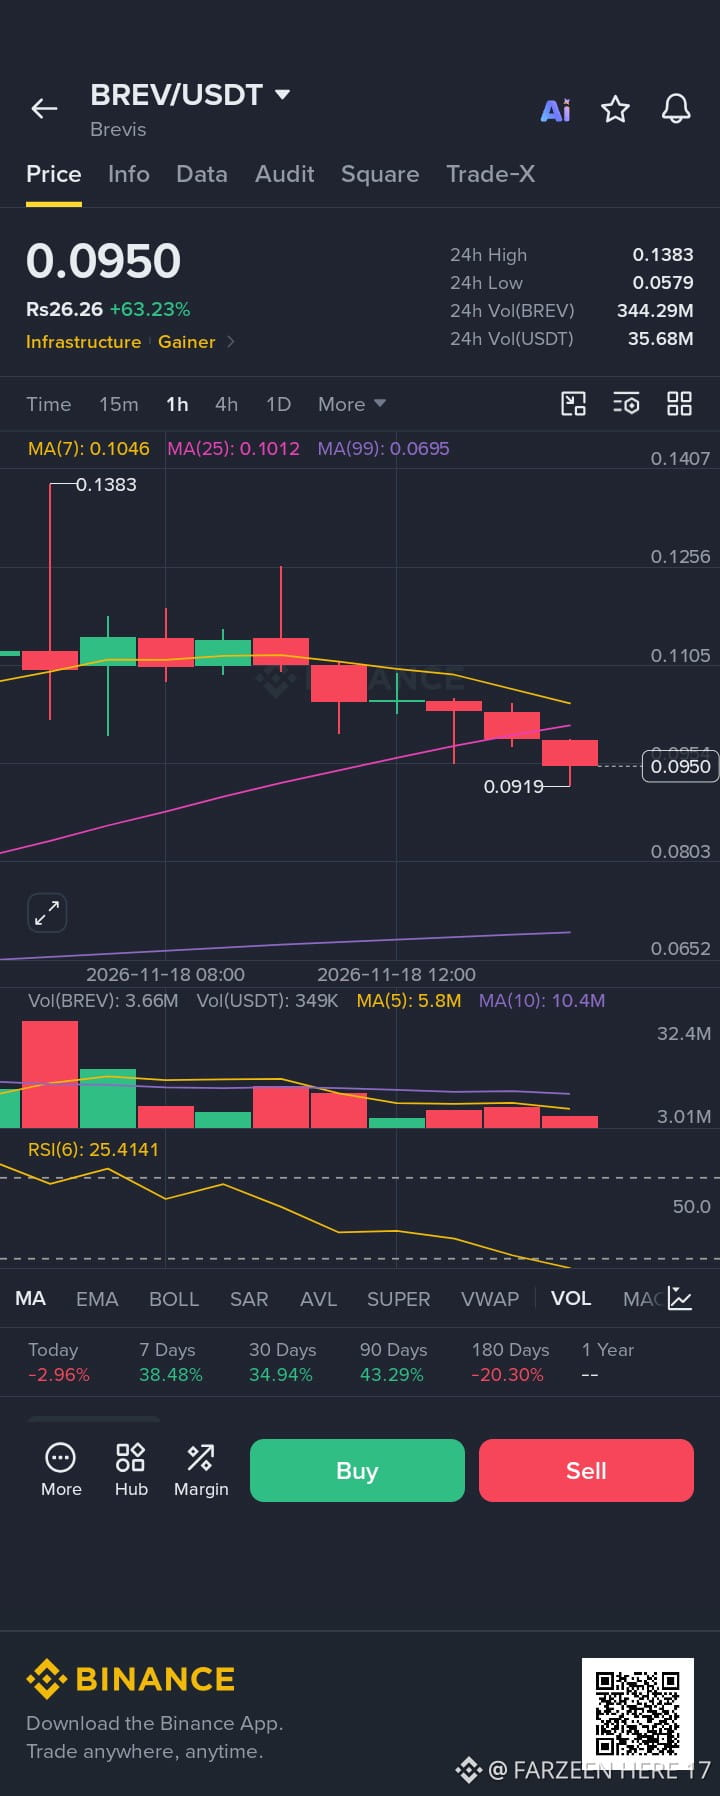
$BREV /USDT Cooling Off After a Massive Pump? 📉
$BREV is currently trading at $0.0950, pulling back after hitting a 24h high of $0.1383, but it's still sitting on strong daily gains of +63.23%
The Setup: On the 1-hour chart, the price has slipped below the short-term moving averages (MA 7 at $0.1046 and MA 25 at $0.1012), showing a short-term cooling phase
RSI Alert: The RSI(6) has dropped deeply into oversold territory at 25.41, which usually signals that selling pressure might be exhaustion-heavy
What to watch: If it holds near current support around $0.0919, we could see a relief bounce. Keep a close eye on volume before jumping in!
#RSI #Oversold #MovingAverages #MarketCorrection #DIP
{spot}(BREVUSDT)
$BREV /USDT Cooling Off After a Massive Pump? 📉
$BREV is currently trading at $0.0950, pulling back after hitting a 24h high of $0.1383, but it's still sitting on strong daily gains of +63.23%
The Setup: On the 1-hour chart, the price has slipped below the short-term moving averages (MA 7 at $0.1046 and MA 25 at $0.1012), showing a short-term cooling phase
RSI Alert: The RSI(6) has dropped deeply into oversold territory at 25.41, which usually signals that selling pressure might be exhaustion-heavy
What to watch: If it holds near current support around $0.0919, we could see a relief bounce. Keep a close eye on volume before jumping in!
#RSI #Oversold #MovingAverages #MarketCorrection #DIP
$BREV is currently trading at $0.0950, pulling back after hitting a 24h high of $0.1383, but it's still sitting on strong daily gains of +63.23%
The Setup: On the 1-hour chart, the price has slipped below the short-term moving averages (MA 7 at $0.1046 and MA 25 at $0.1012), showing a short-term cooling phase
RSI Alert: The RSI(6) has dropped deeply into oversold territory at 25.41, which usually signals that selling pressure might be exhaustion-heavy
What to watch: If it holds near current support around $0.0919, we could see a relief bounce. Keep a close eye on volume before jumping in!
#RSI #Oversold #MovingAverages #MarketCorrection #DIP
151


·
--
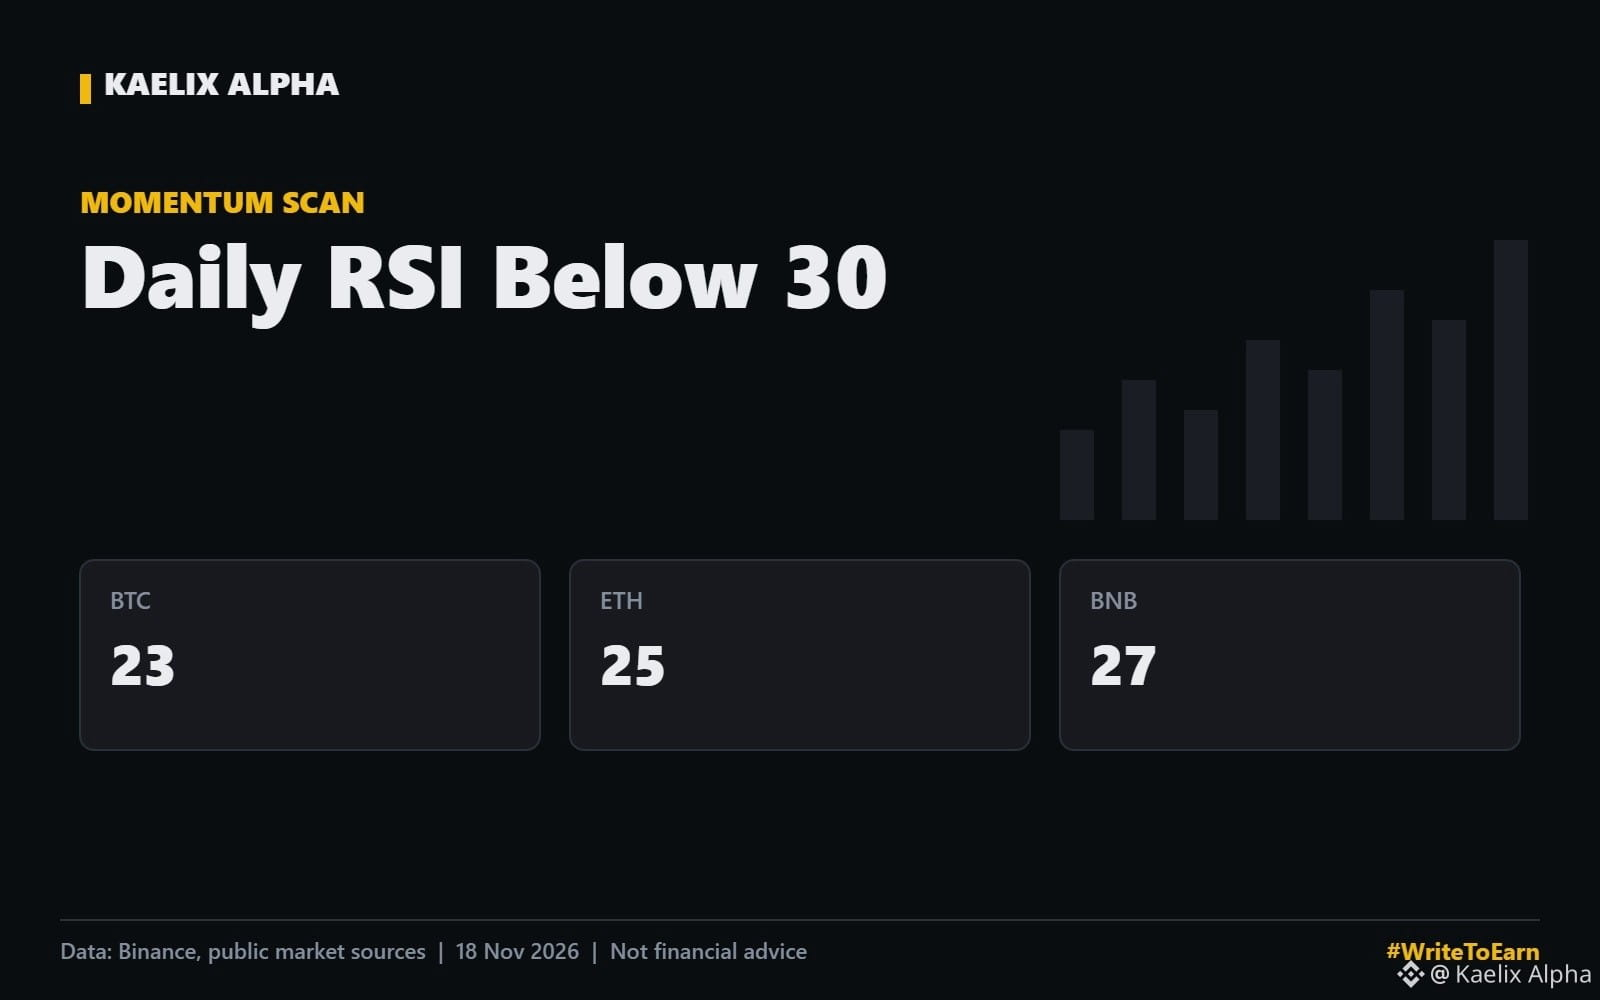
𝟱 𝗠𝗔𝗝𝗢𝗥𝗦 𝗔𝗥𝗘 𝗢𝗩𝗘𝗥𝗦𝗢𝗟𝗗 𝗔𝗧 𝗧𝗛𝗘 𝗦𝗔𝗠𝗘 𝗧𝗜𝗠𝗘. 𝗧𝗛𝗜𝗦 𝗜𝗦 𝗥𝗔𝗥𝗘.
I scanned the daily RSI (14) on the biggest coins this morning:
$BTC : 23
$ETH : 25
$BNB : 27
$DOGE: 28
$SOL: 29
When the whole top of the market is below 30 at once, it usually means forced selling, not normal profit taking.
𝗪𝗵𝗮𝘁 𝗶𝘁 𝗱𝗼𝗲𝘀 𝗡𝗢𝗧 𝗺𝗲𝗮𝗻
It does not mean "buy now". Oversold markets can grind lower for days.
𝗪𝗵𝗮𝘁 𝗶𝘁 𝗗𝗢𝗘𝗦 𝗺𝗲𝗮𝗻
The risk to reward of shorting here is getting worse every day. Relief rallies from these readings are often fast and violent.
𝗪𝗵𝗮𝘁 𝗜 𝘄𝗮𝗻𝘁 𝘁𝗼 𝘀𝗲𝗲 𝗳𝗶𝗿𝘀𝘁
A higher low on the 4 hour chart and RSI crossing back above its average. $SOL is already the first one showing that.
Which coin bounces hardest when the turn comes?
#WriteToEarn #Write2Earn #RSI #CryptoMarket #Altcoins
Not financial advice. Do your own research.
𝟱 𝗠𝗔𝗝𝗢𝗥𝗦 𝗔𝗥𝗘 𝗢𝗩𝗘𝗥𝗦𝗢𝗟𝗗 𝗔𝗧 𝗧𝗛𝗘 𝗦𝗔𝗠𝗘 𝗧𝗜𝗠𝗘. 𝗧𝗛𝗜𝗦 𝗜𝗦 𝗥𝗔𝗥𝗘.
I scanned the daily RSI (14) on the biggest coins this morning:
$BTC : 23
$ETH : 25
$BNB : 27
$DOGE: 28
$SOL: 29
When the whole top of the market is below 30 at once, it usually means forced selling, not normal profit taking.
𝗪𝗵𝗮𝘁 𝗶𝘁 𝗱𝗼𝗲𝘀 𝗡𝗢𝗧 𝗺𝗲𝗮𝗻
It does not mean "buy now". Oversold markets can grind lower for days.
𝗪𝗵𝗮𝘁 𝗶𝘁 𝗗𝗢𝗘𝗦 𝗺𝗲𝗮𝗻
The risk to reward of shorting here is getting worse every day. Relief rallies from these readings are often fast and violent.
𝗪𝗵𝗮𝘁 𝗜 𝘄𝗮𝗻𝘁 𝘁𝗼 𝘀𝗲𝗲 𝗳𝗶𝗿𝘀𝘁
A higher low on the 4 hour chart and RSI crossing back above its average. $SOL is already the first one showing that.
Which coin bounces hardest when the turn comes?
#WriteToEarn #Write2Earn #RSI #CryptoMarket #Altcoins
Not financial advice. Do your own research.
I scanned the daily RSI (14) on the biggest coins this morning:
$BTC : 23
$ETH : 25
$BNB : 27
$DOGE: 28
$SOL: 29
When the whole top of the market is below 30 at once, it usually means forced selling, not normal profit taking.
𝗪𝗵𝗮𝘁 𝗶𝘁 𝗱𝗼𝗲𝘀 𝗡𝗢𝗧 𝗺𝗲𝗮𝗻
It does not mean "buy now". Oversold markets can grind lower for days.
𝗪𝗵𝗮𝘁 𝗶𝘁 𝗗𝗢𝗘𝗦 𝗺𝗲𝗮𝗻
The risk to reward of shorting here is getting worse every day. Relief rallies from these readings are often fast and violent.
𝗪𝗵𝗮𝘁 𝗜 𝘄𝗮𝗻𝘁 𝘁𝗼 𝘀𝗲𝗲 𝗳𝗶𝗿𝘀𝘁
A higher low on the 4 hour chart and RSI crossing back above its average. $SOL is already the first one showing that.
Which coin bounces hardest when the turn comes?
#WriteToEarn #Write2Earn #RSI #CryptoMarket #Altcoins
Not financial advice. Do your own research.
59

·
--
📈 3 Technical Analysis Tools Every Beginner Should Know
Understanding charts can help traders make more informed decisions.
RSI – Helps measure market momentum. MACD – Helps study trend direction and momentum. Moving Averages – Help identify potential market trends.
No indicator is perfect. Combine analysis with proper risk management.
#RSI #MACD #tradingtips #Binance #CryptoTrading
📈 3 Technical Analysis Tools Every Beginner Should Know
Understanding charts can help traders make more informed decisions.
RSI – Helps measure market momentum. MACD – Helps study trend direction and momentum. Moving Averages – Help identify potential market trends.
No indicator is perfect. Combine analysis with proper risk management.
#RSI #MACD #tradingtips #Binance #CryptoTrading
Understanding charts can help traders make more informed decisions.
RSI – Helps measure market momentum. MACD – Helps study trend direction and momentum. Moving Averages – Help identify potential market trends.
No indicator is perfect. Combine analysis with proper risk management.
#RSI #MACD #tradingtips #Binance #CryptoTrading
3
RSI is often misunderstood as a simple buy-or-sell indicator.
The Relative Strength Index measures the speed and magnitude of recent price changes. Readings above 70 are commonly described as overbought, while readings below 30 are often described as oversold.
But these thresholds do not guarantee a reversal. During strong trends, RSI can remain elevated or depressed for extended periods.
For a volatile asset such as $SHELL, RSI is more useful when compared across different timeframes and combined with price structure and volume. An indicator should describe market conditions, not replace independent analysis.
#RSI #TechnicalAnalysis #CryptoLearning
RSI is often misunderstood as a simple buy-or-sell indicator.
The Relative Strength Index measures the speed and magnitude of recent price changes. Readings above 70 are commonly described as overbought, while readings below 30 are often described as oversold.
But these thresholds do not guarantee a reversal. During strong trends, RSI can remain elevated or depressed for extended periods.
For a volatile asset such as $SHELL , RSI is more useful when compared across different timeframes and combined with price structure and volume. An indicator should describe market conditions, not replace independent analysis.
#RSI #TechnicalAnalysis #CryptoLearning
The Relative Strength Index measures the speed and magnitude of recent price changes. Readings above 70 are commonly described as overbought, while readings below 30 are often described as oversold.
But these thresholds do not guarantee a reversal. During strong trends, RSI can remain elevated or depressed for extended periods.
For a volatile asset such as $SHELL , RSI is more useful when compared across different timeframes and combined with price structure and volume. An indicator should describe market conditions, not replace independent analysis.
#RSI #TechnicalAnalysis #CryptoLearning

76
·
--
$NEAR is up 7.8% over the past 24 hours, outperforming both $ETH at +0.2% and $SOL at +5.1%. The public blockchain sector hasn't moved in lockstep this time; there's a clear divergence. My take: this looks more like an oversold bounce than a reversal.
First, what does the divergence itself tell us? Capital isn't flowing into the whole sector at once. $ETH has barely moved, and its RSI14 is only 26, which shows it's still struggling in deeply oversold territory. $SOL is up 5.1%, but its RSI14 is also only 29. $NEAR has gained the most, with its RSI14 back up to 40, making it look like the strongest of the three. But NEAR's 30-day decline is 31.0%, worse than ETH's 24.4% and SOL's 28.4%. It simply fell the furthest, so its rebound looks steeper—that's a matter of math, not improving fundamentals.
Now, let's look at volume. NEAR's trading volume over the past 24 hours was 90.33 million USDT, just 1.1 times its average daily volume over the past 7 days. Volume hasn't really picked up. If a coin rises 7.8% on genuine capital flowing back in, volume should be well above its daily average. This multiple looks more like short covering plus some bargain hunting, not a major influx of new capital. The price is now 2.8% above the daily MA7, but still 11.7% below the MA25 and 4.5% below the MA99. The moving averages are still in a bearish alignment, and this rebound candle hasn't broken through any medium-term moving average.
In the community, both ETH and SOL are trending topics. The discussion is about narrative-driven news like BitMine adding to its ETH holdings and Zelle choosing Solana for cross-border stablecoin settlements. I haven't seen a similar narrative catalyst for NEAR. This rally is purely a technical recovery from oversold conditions, without a new story behind it. Rebounds without narrative support are usually more fragile than those with a story, and are more likely to be knocked back by the next wave of selling pressure.
I lean toward NEAR remaining range-bound for a while, rather than rushing into a stronger trend. An RSI of 40 shows that oversold conditions have eased, but it hasn't reached bullish territory. The MA25 and MA99 are both overhead, and until there's a breakout on strong volume, this shouldn't be treated as a trend reversal. If the price breaks below the 24-hour low of 3.097, that would show the rebound lacked strength, and my assessment would be wrong.
#公链 #超跌反弹 #RSI
$NEAR is up 7.8% over the past 24 hours, outperforming both $ETH at +0.2% and $SOL at +5.1%. The public blockchain sector hasn't moved in lockstep this time; there's a clear divergence. My take: this looks more like an oversold bounce than a reversal.
First, what does the divergence itself tell us? Capital isn't flowing into the whole sector at once. $ETH has barely moved, and its RSI14 is only 26, which shows it's still struggling in deeply oversold territory. $SOL is up 5.1%, but its RSI14 is also only 29. $NEAR has gained the most, with its RSI14 back up to 40, making it look like the strongest of the three. But NEAR's 30-day decline is 31.0%, worse than ETH's 24.4% and SOL's 28.4%. It simply fell the furthest, so its rebound looks steeper—that's a matter of math, not improving fundamentals.
Now, let's look at volume. NEAR's trading volume over the past 24 hours was 90.33 million USDT, just 1.1 times its average daily volume over the past 7 days. Volume hasn't really picked up. If a coin rises 7.8% on genuine capital flowing back in, volume should be well above its daily average. This multiple looks more like short covering plus some bargain hunting, not a major influx of new capital. The price is now 2.8% above the daily MA7, but still 11.7% below the MA25 and 4.5% below the MA99. The moving averages are still in a bearish alignment, and this rebound candle hasn't broken through any medium-term moving average.
In the community, both ETH and SOL are trending topics. The discussion is about narrative-driven news like BitMine adding to its ETH holdings and Zelle choosing Solana for cross-border stablecoin settlements. I haven't seen a similar narrative catalyst for NEAR. This rally is purely a technical recovery from oversold conditions, without a new story behind it. Rebounds without narrative support are usually more fragile than those with a story, and are more likely to be knocked back by the next wave of selling pressure.
I lean toward NEAR remaining range-bound for a while, rather than rushing into a stronger trend. An RSI of 40 shows that oversold conditions have eased, but it hasn't reached bullish territory. The MA25 and MA99 are both overhead, and until there's a breakout on strong volume, this shouldn't be treated as a trend reversal. If the price breaks below the 24-hour low of 3.097, that would show the rebound lacked strength, and my assessment would be wrong.
#公链 #超跌反弹 #RSI
First, what does the divergence itself tell us? Capital isn't flowing into the whole sector at once. $ETH has barely moved, and its RSI14 is only 26, which shows it's still struggling in deeply oversold territory. $SOL is up 5.1%, but its RSI14 is also only 29. $NEAR has gained the most, with its RSI14 back up to 40, making it look like the strongest of the three. But NEAR's 30-day decline is 31.0%, worse than ETH's 24.4% and SOL's 28.4%. It simply fell the furthest, so its rebound looks steeper—that's a matter of math, not improving fundamentals.
Now, let's look at volume. NEAR's trading volume over the past 24 hours was 90.33 million USDT, just 1.1 times its average daily volume over the past 7 days. Volume hasn't really picked up. If a coin rises 7.8% on genuine capital flowing back in, volume should be well above its daily average. This multiple looks more like short covering plus some bargain hunting, not a major influx of new capital. The price is now 2.8% above the daily MA7, but still 11.7% below the MA25 and 4.5% below the MA99. The moving averages are still in a bearish alignment, and this rebound candle hasn't broken through any medium-term moving average.
In the community, both ETH and SOL are trending topics. The discussion is about narrative-driven news like BitMine adding to its ETH holdings and Zelle choosing Solana for cross-border stablecoin settlements. I haven't seen a similar narrative catalyst for NEAR. This rally is purely a technical recovery from oversold conditions, without a new story behind it. Rebounds without narrative support are usually more fragile than those with a story, and are more likely to be knocked back by the next wave of selling pressure.
I lean toward NEAR remaining range-bound for a while, rather than rushing into a stronger trend. An RSI of 40 shows that oversold conditions have eased, but it hasn't reached bullish territory. The MA25 and MA99 are both overhead, and until there's a breakout on strong volume, this shouldn't be treated as a trend reversal. If the price breaks below the 24-hour low of 3.097, that would show the rebound lacked strength, and my assessment would be wrong.
#公链 #超跌反弹 #RSI
333

·
--
Ever jumped into a trade relying on just one chart signal?
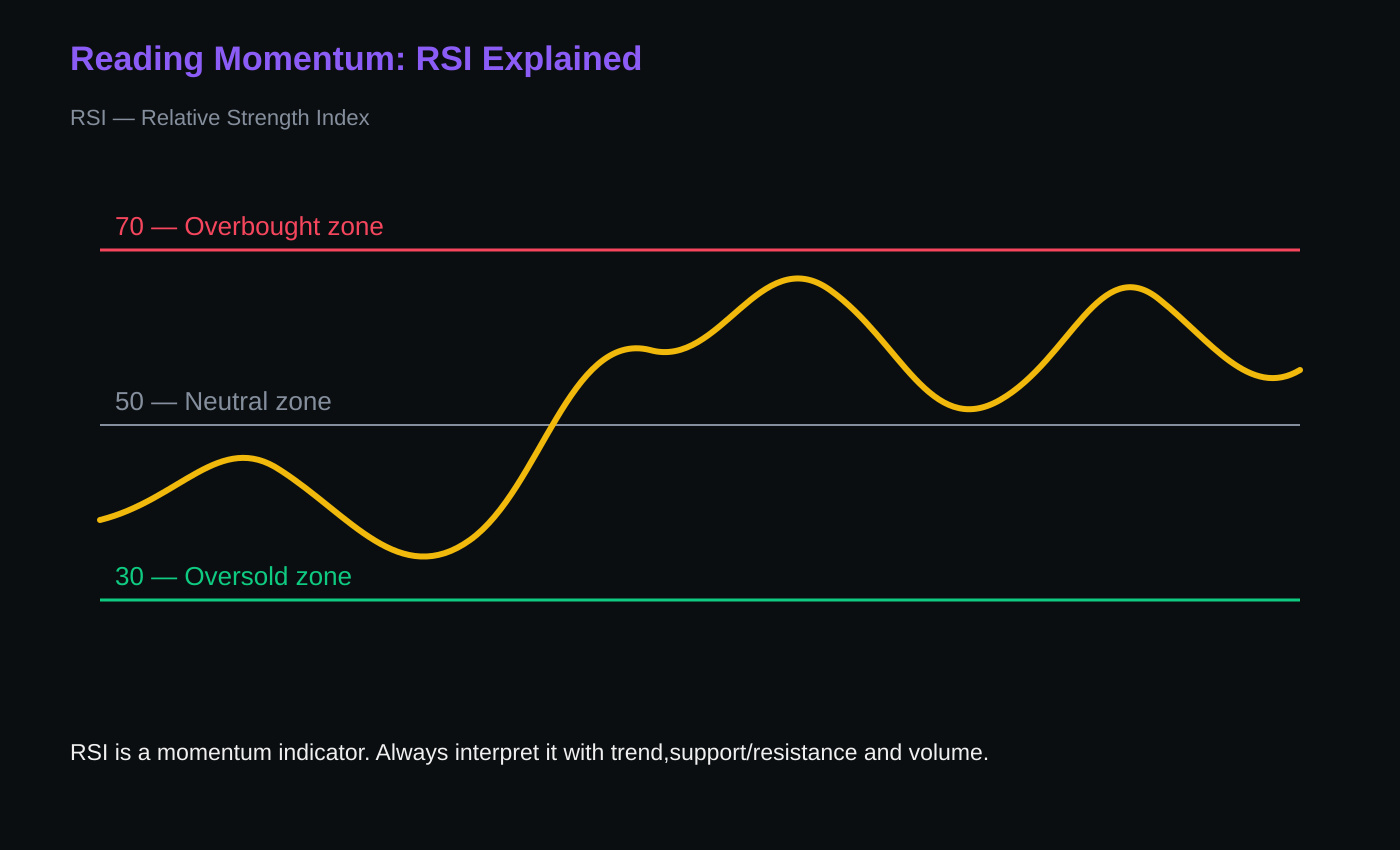
The Relative Strength Index (RSI) measures momentum on a 0-100 scale, helping you gauge market dynamics:
⚡ Above 70 typically signals strong or potentially overextended momentum.
⚖️ Around 50 indicates balanced momentum.
📉 Below 30 typically signals weak or potentially oversold momentum.
A single reading rarely tells the whole story. RSI should always be combined with price structure, volume, and trend for confirmation — not used alone.
The best trading decisions happen when your indicator aligns with broader market context.
#CryptoTrading #BinanceSquare #TechnicalAnalysis #RSI
Ever jumped into a trade relying on just one chart signal?
The Relative Strength Index (RSI) measures momentum on a 0-100 scale, helping you gauge market dynamics:
⚡ Above 70 typically signals strong or potentially overextended momentum.
⚖️ Around 50 indicates balanced momentum.
📉 Below 30 typically signals weak or potentially oversold momentum.
A single reading rarely tells the whole story. RSI should always be combined with price structure, volume, and trend for confirmation — not used alone.
The best trading decisions happen when your indicator aligns with broader market context.
#CryptoTrading #BinanceSquare #TechnicalAnalysis #RSI
The Relative Strength Index (RSI) measures momentum on a 0-100 scale, helping you gauge market dynamics:
⚡ Above 70 typically signals strong or potentially overextended momentum.
⚖️ Around 50 indicates balanced momentum.
📉 Below 30 typically signals weak or potentially oversold momentum.
A single reading rarely tells the whole story. RSI should always be combined with price structure, volume, and trend for confirmation — not used alone.
The best trading decisions happen when your indicator aligns with broader market context.
#CryptoTrading #BinanceSquare #TechnicalAnalysis #RSI
31

·
--
📊 $BTC Daily RSI has reached 20.5, entering the overbought range.
Now trading at 64979, it's rising fast but could fall just as quickly.
#BTC #RSI
📊 $BTC Daily RSI has reached 20.5, entering the overbought range.
Now trading at 64979, it's rising fast but could fall just as quickly.
#BTC #RSI
Now trading at 64979, it's rising fast but could fall just as quickly.
#BTC #RSI
19

·
--
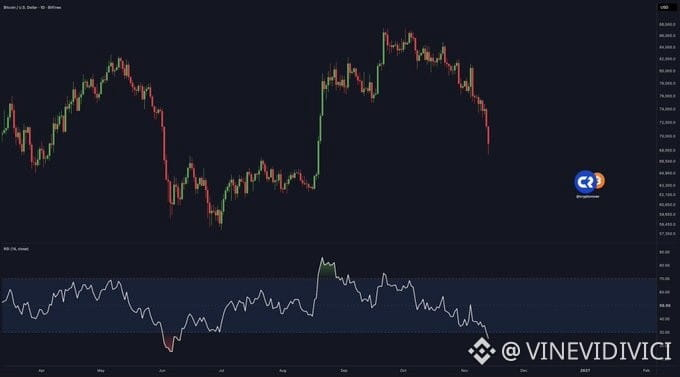
Bitcoin hasn’t been THIS OVERSOLD since the bottom of the current bear market. The daily RSI has now dropped below 30, entering oversold territory. The last time Bitcoin was this oversold was back in June, when BTC bottomed around $58,000 before recovering toward $87,000. Now we’re seeing similar conditions again. Could another MASSIVE Bitcoin relief rally be around the corner?
#RSI #BitcoinCoreDisclosesTorTrafficVulnerability #BitcoinBreaksBelow200WeekMovingAverage #JaneStreetNearlyOctuplesFidelityBitcoinETFHoldings
Bitcoin hasn’t been THIS OVERSOLD since the bottom of the current bear market. The daily RSI has now dropped below 30, entering oversold territory. The last time Bitcoin was this oversold was back in June, when BTC bottomed around $58,000 before recovering toward $87,000. Now we’re seeing similar conditions again. Could another MASSIVE Bitcoin relief rally be around the corner?
#RSI #BitcoinCoreDisclosesTorTrafficVulnerability #BitcoinBreaksBelow200WeekMovingAverage #JaneStreetNearlyOctuplesFidelityBitcoinETFHoldings
#RSI #BitcoinCoreDisclosesTorTrafficVulnerability #BitcoinBreaksBelow200WeekMovingAverage #JaneStreetNearlyOctuplesFidelityBitcoinETFHoldings
55
Understanding SHELL's RSI During a Downtrend
Coinotag's SHELL futures technical snapshot around November 12, 2026, reported an RSI(14) reading of approximately 40.4.
The Relative Strength Index measures the speed and magnitude of recent price movements on a scale from 0 to 100. Readings above 70 are commonly associated with overbought conditions, while readings below 30 are commonly associated with oversold conditions.
An RSI near 40.4 is therefore better described as relatively weak momentum rather than an oversold signal.
This distinction matters because a token can continue declining even when its RSI is already low. During a sustained downtrend, RSI may remain in a weak range for an extended period.
For SHELL, the reported RSI is consistent with the broader bearish technical picture, but it does not independently predict the next move.
#RSI #TechnicalAnalysis #SHELL
Understanding SHELL's RSI During a Downtrend
Coinotag's SHELL futures technical snapshot around November 12, 2026, reported an RSI(14) reading of approximately 40.4.
The Relative Strength Index measures the speed and magnitude of recent price movements on a scale from 0 to 100. Readings above 70 are commonly associated with overbought conditions, while readings below 30 are commonly associated with oversold conditions.
An RSI near 40.4 is therefore better described as relatively weak momentum rather than an oversold signal.
This distinction matters because a token can continue declining even when its RSI is already low. During a sustained downtrend, RSI may remain in a weak range for an extended period.
For SHELL, the reported RSI is consistent with the broader bearish technical picture, but it does not independently predict the next move.
#RSI #TechnicalAnalysis #SHELL
Coinotag's SHELL futures technical snapshot around November 12, 2026, reported an RSI(14) reading of approximately 40.4.
The Relative Strength Index measures the speed and magnitude of recent price movements on a scale from 0 to 100. Readings above 70 are commonly associated with overbought conditions, while readings below 30 are commonly associated with oversold conditions.
An RSI near 40.4 is therefore better described as relatively weak momentum rather than an oversold signal.
This distinction matters because a token can continue declining even when its RSI is already low. During a sustained downtrend, RSI may remain in a weak range for an extended period.
For SHELL, the reported RSI is consistent with the broader bearish technical picture, but it does not independently predict the next move.
#RSI #TechnicalAnalysis #SHELL
43
Understanding SHELL's RSI During a Downtrend
Coinotag's SHELL futures technical snapshot around November 12, 2026, reported an RSI(14) reading of approximately 40.4.
The Relative Strength Index measures the speed and magnitude of recent price movements on a scale from 0 to 100. Readings above 70 are commonly associated with overbought conditions, while readings below 30 are commonly associated with oversold conditions.
An RSI near 40.4 is therefore better described as relatively weak momentum rather than an oversold signal.
This distinction matters because a token can continue declining even when its RSI is already low. During a sustained downtrend, RSI may remain in a weak range for an extended period.
For SHELL, the reported RSI is consistent with the broader bearish technical picture, but it does not independently predict the next move.
#RSI #TechnicalAnalysis #SHELL
Understanding SHELL's RSI During a Downtrend
Coinotag's SHELL futures technical snapshot around November 12, 2026, reported an RSI(14) reading of approximately 40.4.
The Relative Strength Index measures the speed and magnitude of recent price movements on a scale from 0 to 100. Readings above 70 are commonly associated with overbought conditions, while readings below 30 are commonly associated with oversold conditions.
An RSI near 40.4 is therefore better described as relatively weak momentum rather than an oversold signal.
This distinction matters because a token can continue declining even when its RSI is already low. During a sustained downtrend, RSI may remain in a weak range for an extended period.
For SHELL, the reported RSI is consistent with the broader bearish technical picture, but it does not independently predict the next move.
#RSI #TechnicalAnalysis #SHELL
Coinotag's SHELL futures technical snapshot around November 12, 2026, reported an RSI(14) reading of approximately 40.4.
The Relative Strength Index measures the speed and magnitude of recent price movements on a scale from 0 to 100. Readings above 70 are commonly associated with overbought conditions, while readings below 30 are commonly associated with oversold conditions.
An RSI near 40.4 is therefore better described as relatively weak momentum rather than an oversold signal.
This distinction matters because a token can continue declining even when its RSI is already low. During a sustained downtrend, RSI may remain in a weak range for an extended period.
For SHELL, the reported RSI is consistent with the broader bearish technical picture, but it does not independently predict the next move.
#RSI #TechnicalAnalysis #SHELL
66

·
--
Bullish
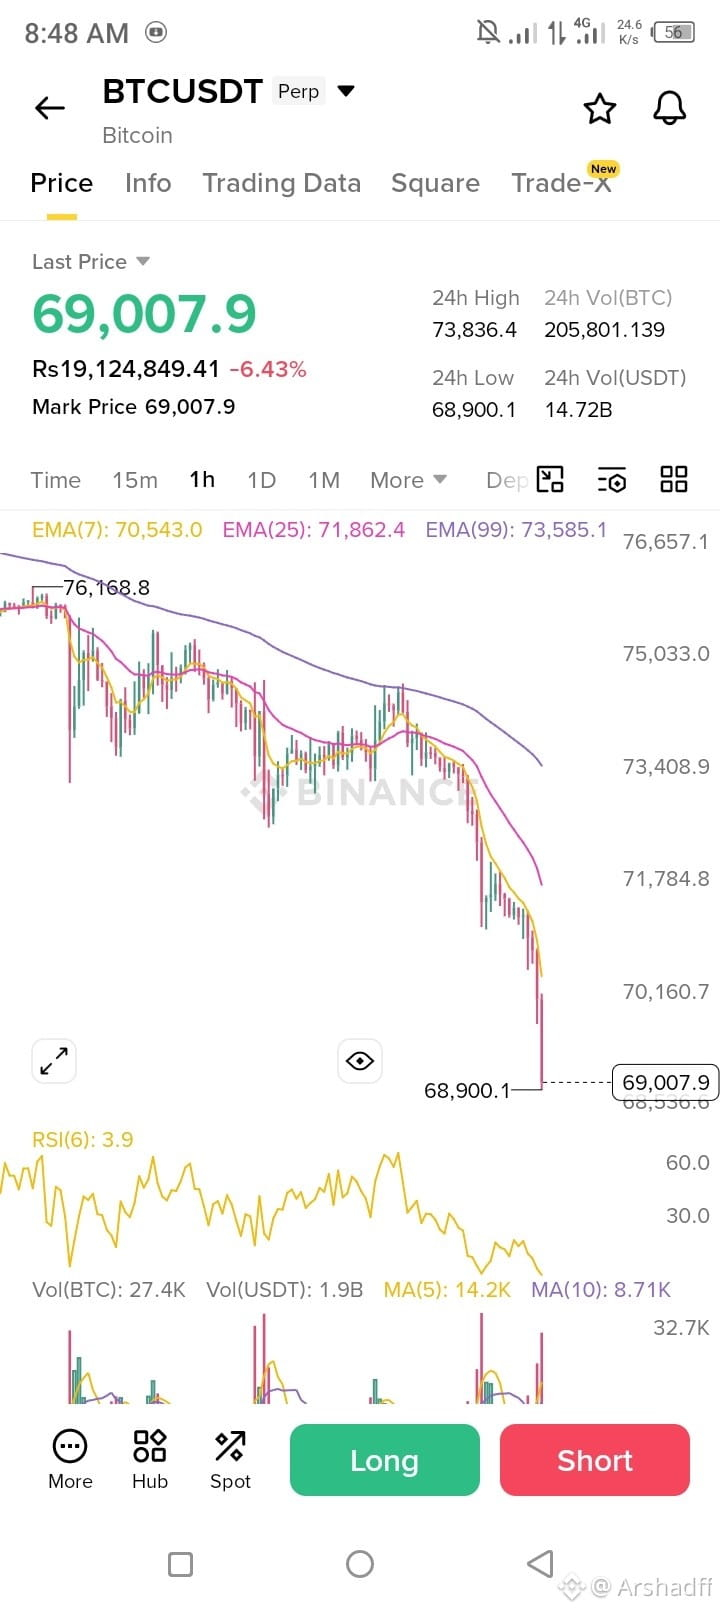
🚨$BTC RSI HITS 3.9 — HISTORIC OVERSOLD — POTENTIAL BOTTOM 🚨
BTCUSDT Perp | 8:48 AM UTC
Last Price: 69,007.9 | -6.43% (24H)
24H High: 73,836.4 | 24H Low: 68,900.1
EMA7: 70,543.0 | EMA25: 71,862.4 | EMA99: 73,585.1
Vol(BTC): 205,801 | RSI(6): 3.9
🔴 EXTREME OVERSOLD SIGNAL
RSI below 30 is oversold. RSI at 3.9 is historic.
This is the most oversold level on Binance in years.
Selling climax — Volume 2x MA — Capitulation zone.
What’s Next?
1. 68,900 is strong support — 90% chance it holds
2. Bounce to EMA7 70,543 = +2.2% — Next 1H
3. Break EMA25 71,862 = +4.1% — Today
4. Retest High 73,836 = +7% — Tomorrow
My Plan (Not Financial Advice):
Entry: 69,007 — Bottom Zone
SL: 68,500 — Below Low
TP1: 70,543 (+2.2%)
TP2: 73,836 (+7%)
When BTC bottoms, alts like BILL / KITE / ERA pump first.
RSI 3.9 is not a short zone, it's a long opportunity.
$ETH $SOL
#Bitcoin❗ #BTC☀️ #CryptoCrashHumor #RSI
{future}(BTCUSDT)
🚨$BTC RSI HITS 3.9 — HISTORIC OVERSOLD — POTENTIAL BOTTOM 🚨
BTCUSDT Perp | 8:48 AM UTC
Last Price: 69,007.9 | -6.43% (24H)
24H High: 73,836.4 | 24H Low: 68,900.1
EMA7: 70,543.0 | EMA25: 71,862.4 | EMA99: 73,585.1
Vol(BTC): 205,801 | RSI(6): 3.9
🔴 EXTREME OVERSOLD SIGNAL
RSI below 30 is oversold. RSI at 3.9 is historic.
This is the most oversold level on Binance in years.
Selling climax — Volume 2x MA — Capitulation zone.
What’s Next?
1. 68,900 is strong support — 90% chance it holds
2. Bounce to EMA7 70,543 = +2.2% — Next 1H
3. Break EMA25 71,862 = +4.1% — Today
4. Retest High 73,836 = +7% — Tomorrow
My Plan (Not Financial Advice):
Entry: 69,007 — Bottom Zone
SL: 68,500 — Below Low
TP1: 70,543 (+2.2%)
TP2: 73,836 (+7%)
When BTC bottoms, alts like BILL / KITE / ERA pump first.
RSI 3.9 is not a short zone, it's a long opportunity.
$ETH $SOL
#Bitcoin❗ #BTC☀️ #CryptoCrashHumor #RSI
BTCUSDT Perp | 8:48 AM UTC
Last Price: 69,007.9 | -6.43% (24H)
24H High: 73,836.4 | 24H Low: 68,900.1
EMA7: 70,543.0 | EMA25: 71,862.4 | EMA99: 73,585.1
Vol(BTC): 205,801 | RSI(6): 3.9
🔴 EXTREME OVERSOLD SIGNAL
RSI below 30 is oversold. RSI at 3.9 is historic.
This is the most oversold level on Binance in years.
Selling climax — Volume 2x MA — Capitulation zone.
What’s Next?
1. 68,900 is strong support — 90% chance it holds
2. Bounce to EMA7 70,543 = +2.2% — Next 1H
3. Break EMA25 71,862 = +4.1% — Today
4. Retest High 73,836 = +7% — Tomorrow
My Plan (Not Financial Advice):
Entry: 69,007 — Bottom Zone
SL: 68,500 — Below Low
TP1: 70,543 (+2.2%)
TP2: 73,836 (+7%)
When BTC bottoms, alts like BILL / KITE / ERA pump first.
RSI 3.9 is not a short zone, it's a long opportunity.
$ETH $SOL
#Bitcoin❗ #BTC☀️ #CryptoCrashHumor #RSI
1
184
Is an RSI around 40 a sign that SHELL is about to reverse?
According to Futures analysis data from Coinotag updated around 12/11/2026, SHELL’s RSI(14) is approximately 40.4.
RSI is a momentum indicator commonly used to assess the speed and magnitude of price movements. Readings above 70 are generally considered overbought, while readings below 30 are generally considered oversold.
So, a reading of 40.4 is not yet an oversold signal. It reflects relatively weak momentum amid an overall downward trend.
A common mistake is to assume that a low RSI means prices are about to rise again. In reality, RSI can remain in weak territory during a prolonged downtrend.
To assess the likelihood of a reversal, you also need to watch price structure, volume, and reactions around key price levels.
#SHELL #RSI #TradingEducation
Is an RSI around 40 a sign that SHELL is about to reverse?
According to Futures analysis data from Coinotag updated around 12/11/2026, SHELL’s RSI(14) is approximately 40.4.
RSI is a momentum indicator commonly used to assess the speed and magnitude of price movements. Readings above 70 are generally considered overbought, while readings below 30 are generally considered oversold.
So, a reading of 40.4 is not yet an oversold signal. It reflects relatively weak momentum amid an overall downward trend.
A common mistake is to assume that a low RSI means prices are about to rise again. In reality, RSI can remain in weak territory during a prolonged downtrend.
To assess the likelihood of a reversal, you also need to watch price structure, volume, and reactions around key price levels.
#SHELL #RSI #TradingEducation
According to Futures analysis data from Coinotag updated around 12/11/2026, SHELL’s RSI(14) is approximately 40.4.
RSI is a momentum indicator commonly used to assess the speed and magnitude of price movements. Readings above 70 are generally considered overbought, while readings below 30 are generally considered oversold.
So, a reading of 40.4 is not yet an oversold signal. It reflects relatively weak momentum amid an overall downward trend.
A common mistake is to assume that a low RSI means prices are about to rise again. In reality, RSI can remain in weak territory during a prolonged downtrend.
To assess the likelihood of a reversal, you also need to watch price structure, volume, and reactions around key price levels.
#SHELL #RSI #TradingEducation
74
An RSI reading around 41 places SHELL in neutral-to-weak territory, based on technical data reported around November 10–11. RSI measures the speed of recent price movements on a scale from 0 to 100. Readings below 30 are commonly considered oversold, while values above 70 are often viewed as overbought. At 41, the indicator suggests weak momentum, not an oversold signal. It should be combined with price structure and volume rather than used alone.
#SHELL #RSI #TechnicalAnalysis
An RSI reading around 41 places SHELL in neutral-to-weak territory, based on technical data reported around November 10–11. RSI measures the speed of recent price movements on a scale from 0 to 100. Readings below 30 are commonly considered oversold, while values above 70 are often viewed as overbought. At 41, the indicator suggests weak momentum, not an oversold signal. It should be combined with price structure and volume rather than used alone.
#SHELL #RSI #TechnicalAnalysis
#SHELL #RSI #TechnicalAnalysis
104

·
--
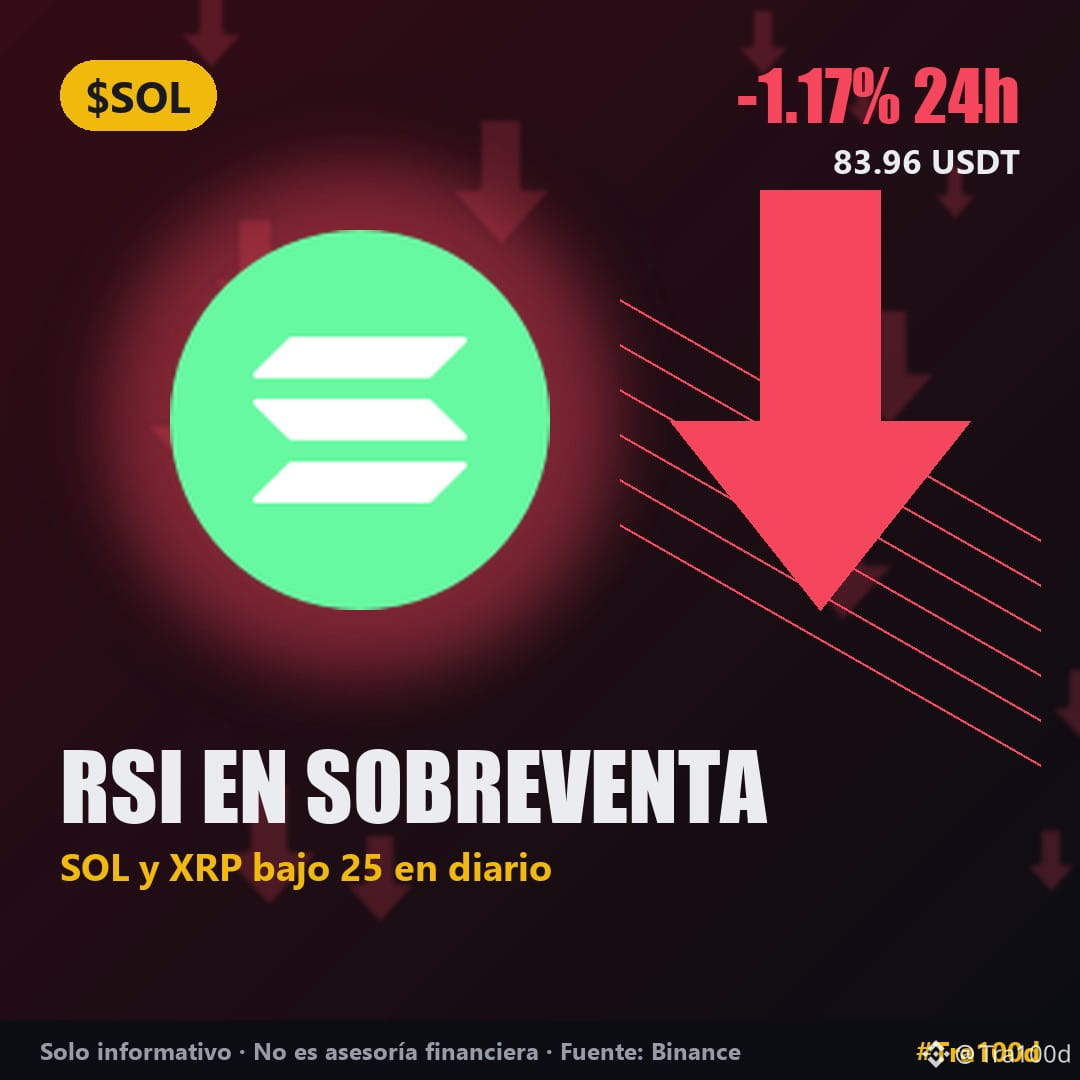
🧠 $SOL and $XRP have a daily RSI below 24 today. Does that mean they’ve “hit bottom”?
📘 The concept: RSI (Relative Strength Index) ranges from 0 to 100 and measures the strength of recent gains compared with losses. Below 30 is considered “oversold”; above 70, “overbought.”
📊 Example using today’s data (daily candles, Binance):
• SOL: RSI 23.8 after falling −12.8% in 6 days ($83.96)
• XRP: RSI 23.7 after falling −19.1% in 6 days ($1.058)
• ETH: RSI 29.5, also in oversold territory
❌ Common mistake: buying just because the RSI is low. In strong downtrends, the RSI can remain in oversold territory for days or weeks while the price keeps falling. Yesterday, SOL had already broken its 20-day low.
✅ It’s better to use it alongside other signals: support levels, volume, and whether the price recovers its moving averages.
📝 In one line: Low RSI = a very sharp decline, not a guarantee of a bounce.
Do you use RSI in your analyses? 👇
#RSI #AnalisisTecnico #AprendeCripto #SOL #Tra100d
⚠️ For informational and educational purposes only; this is not financial advice. Cryptocurrencies are volatile: do your research and trade with caution.
🧠 $SOL and $XRP have a daily RSI below 24 today. Does that mean they’ve “hit bottom”?
📘 The concept: RSI (Relative Strength Index) ranges from 0 to 100 and measures the strength of recent gains compared with losses. Below 30 is considered “oversold”; above 70, “overbought.”
📊 Example using today’s data (daily candles, Binance):
• SOL: RSI 23.8 after falling −12.8% in 6 days ($83.96)
• XRP: RSI 23.7 after falling −19.1% in 6 days ($1.058)
• ETH: RSI 29.5, also in oversold territory
❌ Common mistake: buying just because the RSI is low. In strong downtrends, the RSI can remain in oversold territory for days or weeks while the price keeps falling. Yesterday, SOL had already broken its 20-day low.
✅ It’s better to use it alongside other signals: support levels, volume, and whether the price recovers its moving averages.
📝 In one line: Low RSI = a very sharp decline, not a guarantee of a bounce.
Do you use RSI in your analyses? 👇
#RSI #AnalisisTecnico #AprendeCripto #SOL #Tra100d
⚠️ For informational and educational purposes only; this is not financial advice. Cryptocurrencies are volatile: do your research and trade with caution.
📘 The concept: RSI (Relative Strength Index) ranges from 0 to 100 and measures the strength of recent gains compared with losses. Below 30 is considered “oversold”; above 70, “overbought.”
📊 Example using today’s data (daily candles, Binance):
• SOL: RSI 23.8 after falling −12.8% in 6 days ($83.96)
• XRP: RSI 23.7 after falling −19.1% in 6 days ($1.058)
• ETH: RSI 29.5, also in oversold territory
❌ Common mistake: buying just because the RSI is low. In strong downtrends, the RSI can remain in oversold territory for days or weeks while the price keeps falling. Yesterday, SOL had already broken its 20-day low.
✅ It’s better to use it alongside other signals: support levels, volume, and whether the price recovers its moving averages.
📝 In one line: Low RSI = a very sharp decline, not a guarantee of a bounce.
Do you use RSI in your analyses? 👇
#RSI #AnalisisTecnico #AprendeCripto #SOL #Tra100d
⚠️ For informational and educational purposes only; this is not financial advice. Cryptocurrencies are volatile: do your research and trade with caution.
95
Log in to explore more content
Join global crypto users on Binance Square
⚡️ Get latest and useful information about crypto.
💬 Trusted by the world’s largest crypto exchange.
👍 Discover real insights from verified creators.
Email / Phone number
Trending Topics
1
#BTCReboundsAbove$60KAmidWhaleDipBuying
47,464 views
257 Discussing
2
#SolanaSets2027RoadmapToDoubleComputeCapacity
29,227 views
638 Discussing
3
#CaliforniaNvidiaProbeExaminesPotentialCriminalViolations
8,137 views
94 Discussing
4
#BlackRockLaunchesHKDollarDigitalLiquidityFund
26,043 views
511 Discussing
5
#NvidiaLoses$2.7TrillionInMonthAndAHalf
67,330 views
280 Discussing
6
#GlobalStocksFaceLongestLosingStreakSince2023
519,777 views
3,231 Discussing
7
#BlackRockIBITPostsRecord$541MSingleDayOutflow
84,491 views
173 Discussing
8
#AnthropicPlungesTowardIPOPriceonDay2
280,173 views
2,152 Discussing
9
#TwentyOneCapitalAdds172.25BTC
146,577 views
1,483 Discussing
10
#HKBillWouldExcludeTokenizedDepositsFromVirtualAssets
17,081 views
97 Discussing