
#technicalanalysis
technicalanalysis
28.5M views
200,726 Discussing
Hot
Latest


·
--
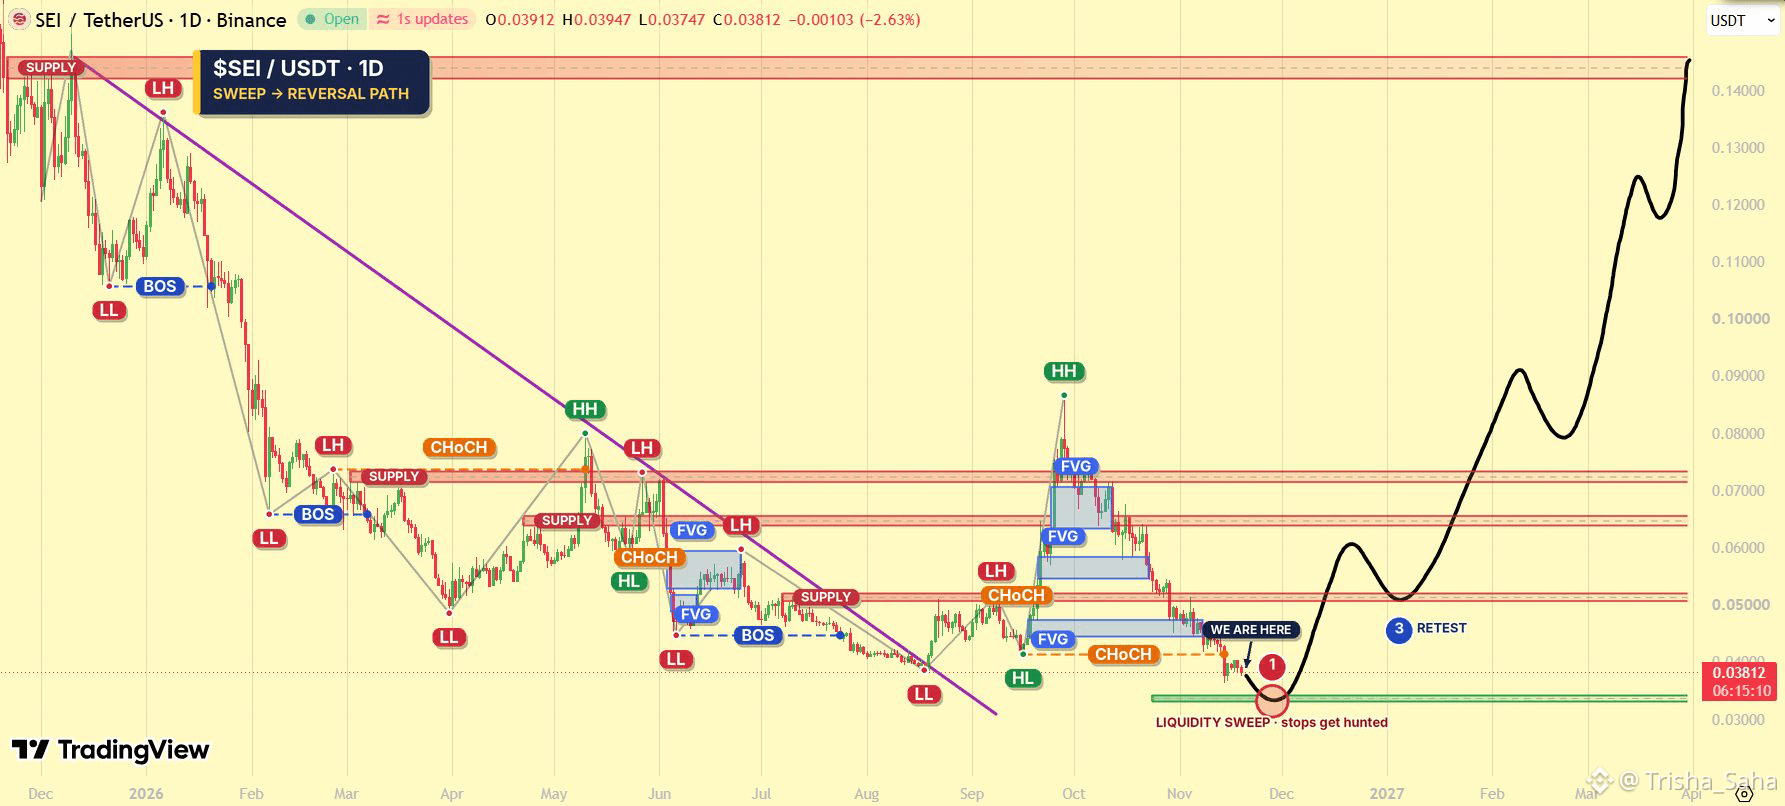
🌊 $SEI IS APPROACHING DEMAND AFTER A LONG TRENDLINE BREAK
🔥 Trade $SEI
Sei trades near 0.038 on the daily chart.
A demand line sits near 0.033, just under the recent lows.
A sweep there would take out the stops below.
The path then recovers toward 0.061 with a retest on the way.
A large supply zone near 0.07 and the 0.14 high are the bigger targets.
Does Sei bounce from demand?
#Sei #Crypto #TechnicalAnalysis
{future}(SEIUSDT)
🌊 $SEI IS APPROACHING DEMAND AFTER A LONG TRENDLINE BREAK
🔥 Trade $SEI
Sei trades near 0.038 on the daily chart.
A demand line sits near 0.033, just under the recent lows.
A sweep there would take out the stops below.
The path then recovers toward 0.061 with a retest on the way.
A large supply zone near 0.07 and the 0.14 high are the bigger targets.
Does Sei bounce from demand?
#Sei #Crypto #TechnicalAnalysis
🔥 Trade $SEI
Sei trades near 0.038 on the daily chart.
A demand line sits near 0.033, just under the recent lows.
A sweep there would take out the stops below.
The path then recovers toward 0.061 with a retest on the way.
A large supply zone near 0.07 and the 0.14 high are the bigger targets.
Does Sei bounce from demand?
#Sei #Crypto #TechnicalAnalysis
3
1.5k

·
--
📉 $ZEC Bears Remain in Control – Short Trade in Profit!
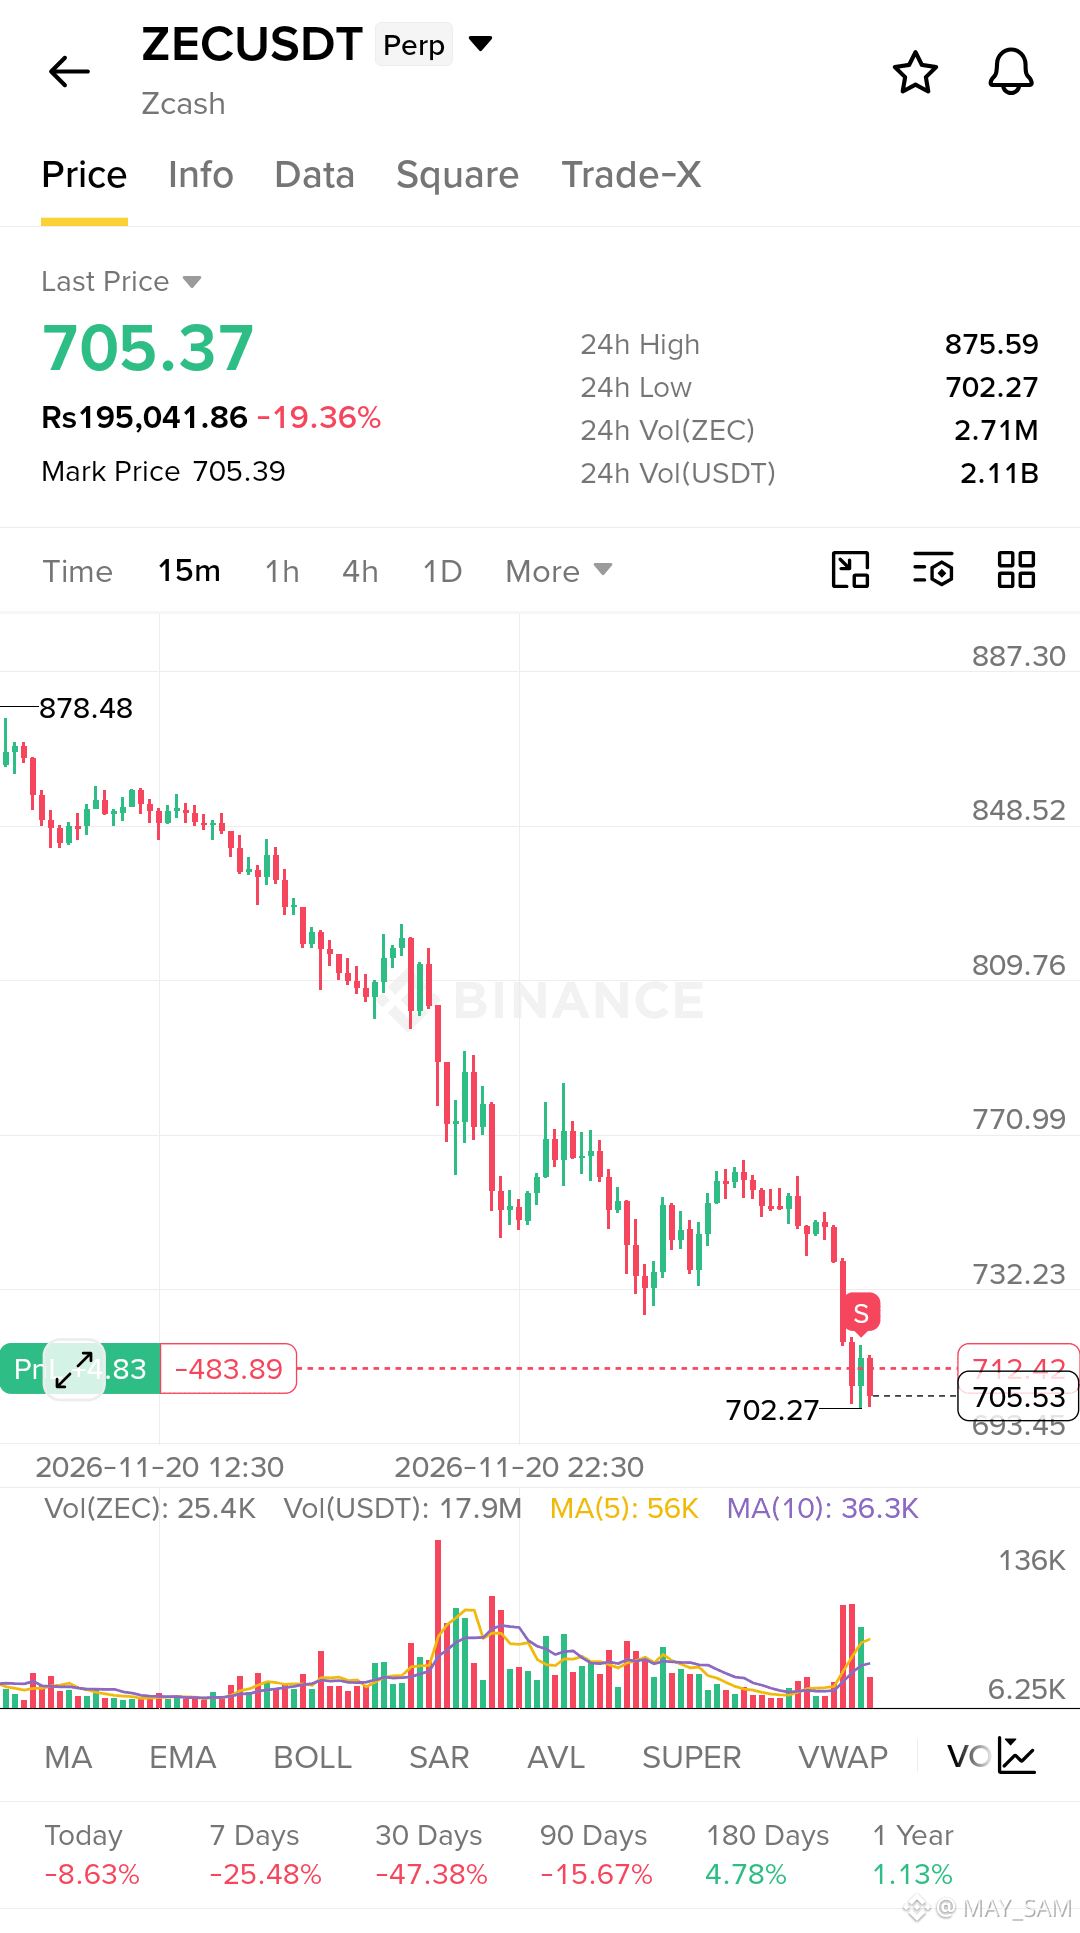
SHORT BIAS: ZEC continues to show strong bearish momentum after a significant decline. Price is trading near the 705.37 area, approaching the recent support at 702.27. A confirmed breakdown could open the door to further downside.
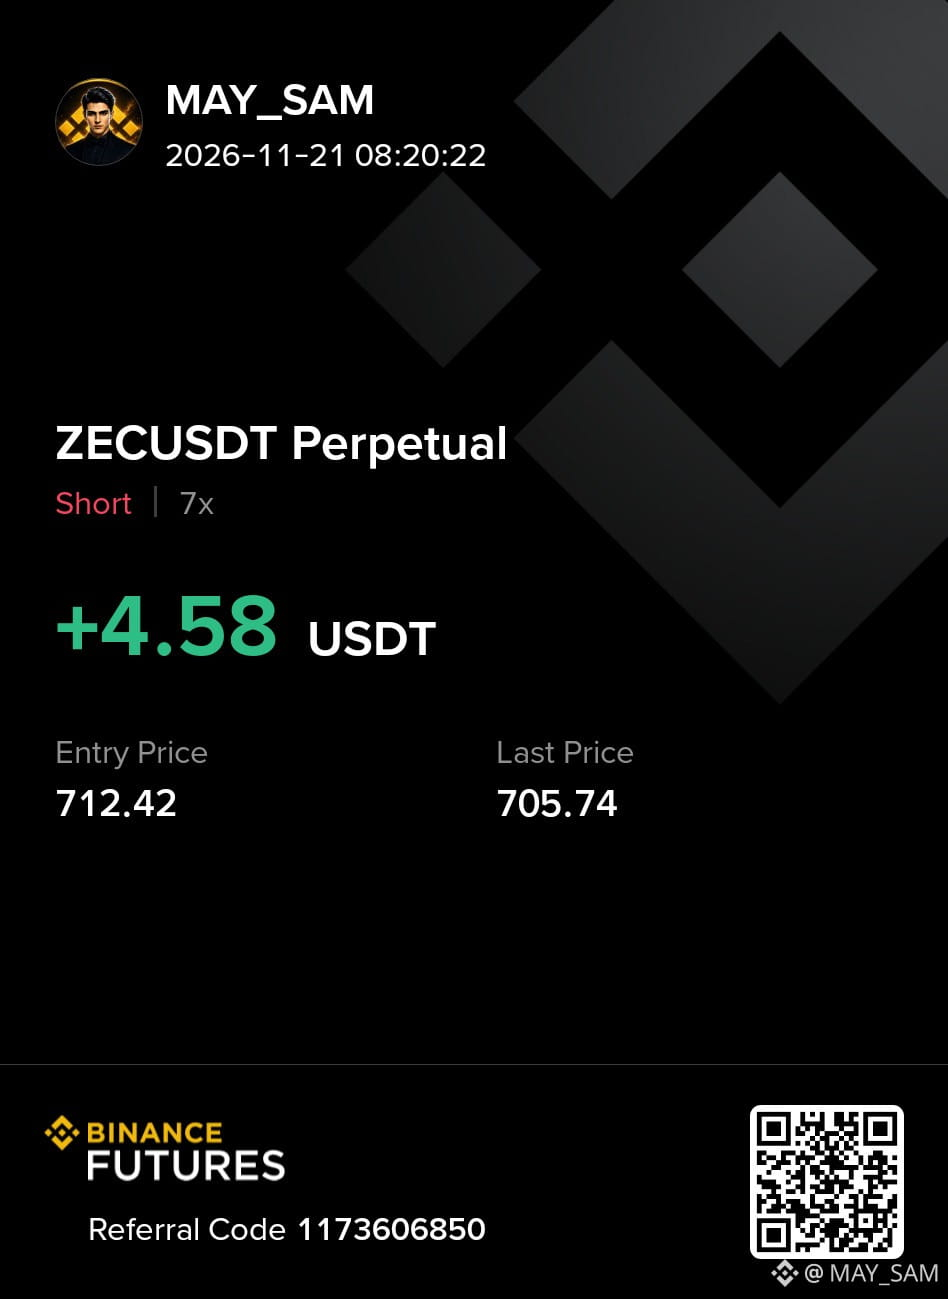
ZECUSDT Perpetual
705.37
-19.36%
🟢 Trade Update:
- Position: SHORT
- Leverage: 7x
- Entry Price: 712.42
- Position Last Price: 705.74
- Unrealized P&L: +4.58 USDT
📊 Key Market Levels:
- Immediate Support: 702.27
- Lower Support: 693.45
- Resistance 1: 732.23
- Resistance 2: 770.99
- 24H High: 875.59
- 24H Low: 702.27
Confirmation: Watch for a confirmed 15m candle close below 702.27 to signal potential bearish continuation. If support holds, a short-term recovery is possible.
⚠️ Avoid chasing after a sharp decline. Protect profits and manage risk carefully.
NFA. Manage Risk. Trade Smart.$EVAA $BNB
#ZECUSDT #BinanceFutures #CryptoTrading #ShortTrade #TechnicalAnalysis
📉 $ZEC Bears Remain in Control – Short Trade in Profit!
SHORT BIAS: ZEC continues to show strong bearish momentum after a significant decline. Price is trading near the 705.37 area, approaching the recent support at 702.27. A confirmed breakdown could open the door to further downside.
ZECUSDT Perpetual
705.37
-19.36%
🟢 Trade Update:
- Position: SHORT
- Leverage: 7x
- Entry Price: 712.42
- Position Last Price: 705.74
- Unrealized P&L: +4.58 USDT
📊 Key Market Levels:
- Immediate Support: 702.27
- Lower Support: 693.45
- Resistance 1: 732.23
- Resistance 2: 770.99
- 24H High: 875.59
- 24H Low: 702.27
Confirmation: Watch for a confirmed 15m candle close below 702.27 to signal potential bearish continuation. If support holds, a short-term recovery is possible.
⚠️ Avoid chasing after a sharp decline. Protect profits and manage risk carefully.
NFA. Manage Risk. Trade Smart.$EVAA $BNB
#ZECUSDT #BinanceFutures #CryptoTrading #ShortTrade #TechnicalAnalysis
SHORT BIAS: ZEC continues to show strong bearish momentum after a significant decline. Price is trading near the 705.37 area, approaching the recent support at 702.27. A confirmed breakdown could open the door to further downside.
ZECUSDT Perpetual
705.37
-19.36%
🟢 Trade Update:
- Position: SHORT
- Leverage: 7x
- Entry Price: 712.42
- Position Last Price: 705.74
- Unrealized P&L: +4.58 USDT
📊 Key Market Levels:
- Immediate Support: 702.27
- Lower Support: 693.45
- Resistance 1: 732.23
- Resistance 2: 770.99
- 24H High: 875.59
- 24H Low: 702.27
Confirmation: Watch for a confirmed 15m candle close below 702.27 to signal potential bearish continuation. If support holds, a short-term recovery is possible.
⚠️ Avoid chasing after a sharp decline. Protect profits and manage risk carefully.
NFA. Manage Risk. Trade Smart.$EVAA $BNB
#ZECUSDT #BinanceFutures #CryptoTrading #ShortTrade #TechnicalAnalysis
1
366

·
--
Bullish
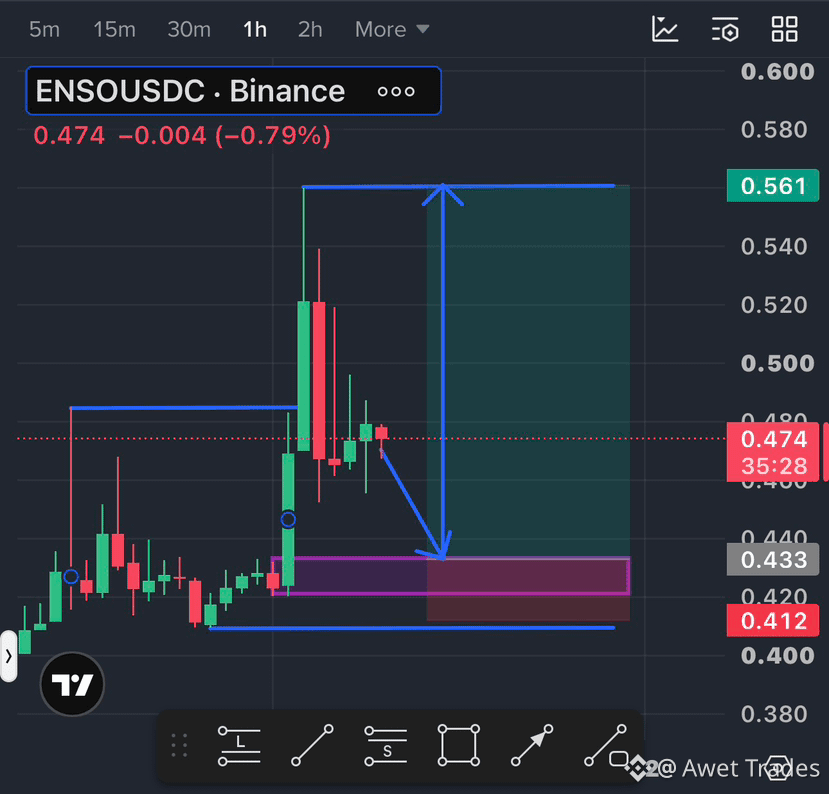
$ENSO Price rejected from the top and now pulling back to the demand zone.
Levels I'm watching:
Entry zone: 0.433 - 0.442
Invalidation: Below 0.412
Target: 0.561
If we hold the purple box, the move up is still valid. If we lose it, I'm out. No emotions.
Are you buying the dip or waiting for confirmation? 👇
#ENSO #trading #TechnicalAnalysis
$ENSO Price rejected from the top and now pulling back to the demand zone.
Levels I'm watching:
Entry zone: 0.433 - 0.442
Invalidation: Below 0.412
Target: 0.561
If we hold the purple box, the move up is still valid. If we lose it, I'm out. No emotions.
Are you buying the dip or waiting for confirmation? 👇
#ENSO #trading #TechnicalAnalysis
Levels I'm watching:
Entry zone: 0.433 - 0.442
Invalidation: Below 0.412
Target: 0.561
If we hold the purple box, the move up is still valid. If we lose it, I'm out. No emotions.
Are you buying the dip or waiting for confirmation? 👇
#ENSO #trading #TechnicalAnalysis
2
203
🚀 CYBER/USDT – What Will Be the Next Move?
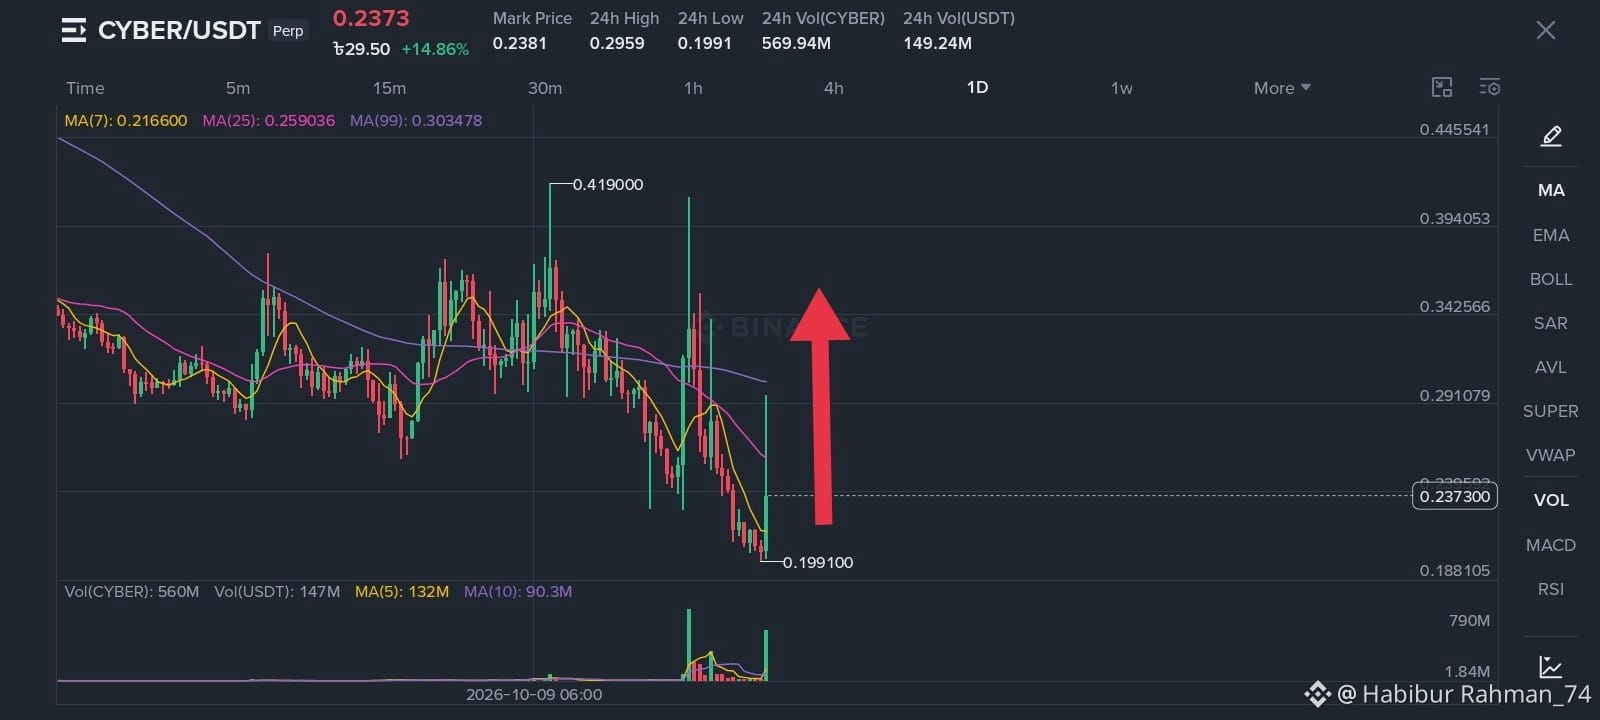
$CYBER is showing a strong recovery after dropping to the $0.1991 support zone.
📊 Technical Overview (1D Chart)
Current Price: $0.2373
24H High: $0.2959
24H Low: $0.1991
MA(7): $0.2166
MA(25): $0.2590
MA(99): $0.3035
🔍 Key Levels to Watch:
🟢 Support: $0.2160–$0.2200
🟢 Major Support: $0.1990
🔴 Resistance: $0.2500–$0.2600
🔴 Strong Resistance: $0.2900–$0.2960
📈 My Market Prediction:
If CYBER holds above $0.2160 and the next daily candle closes with bullish momentum, we may see a move toward $0.2500–$0.2600.
A breakout above $0.2600 could open the door toward $0.2900.
However, if the price loses the $0.2160 support, a retest of $0.1990 is possible.
⚠️ Important: Price is still below MA(25) and MA(99), so a full trend reversal is not confirmed yet. Watch the daily candle close and volume before making any trading decision.
🔥 What do you think?
Will the next CYBER candle be GREEN 🟢 or RED 🔴?
Share your prediction below!
#CYBER #CYBERUSDT #CryptoAnalysis #TechnicalAnalysis #CryptoTrading
🚀 CYBER/USDT – What Will Be the Next Move?
$CYBER is showing a strong recovery after dropping to the $0.1991 support zone.
📊 Technical Overview (1D Chart)
Current Price: $0.2373
24H High: $0.2959
24H Low: $0.1991
MA(7): $0.2166
MA(25): $0.2590
MA(99): $0.3035
🔍 Key Levels to Watch:
🟢 Support: $0.2160–$0.2200
🟢 Major Support: $0.1990
🔴 Resistance: $0.2500–$0.2600
🔴 Strong Resistance: $0.2900–$0.2960
📈 My Market Prediction:
If CYBER holds above $0.2160 and the next daily candle closes with bullish momentum, we may see a move toward $0.2500–$0.2600.
A breakout above $0.2600 could open the door toward $0.2900.
However, if the price loses the $0.2160 support, a retest of $0.1990 is possible.
⚠️ Important: Price is still below MA(25) and MA(99), so a full trend reversal is not confirmed yet. Watch the daily candle close and volume before making any trading decision.
🔥 What do you think?
Will the next CYBER candle be GREEN 🟢 or RED 🔴?
Share your prediction below!
#CYBER #CYBERUSDT #CryptoAnalysis #TechnicalAnalysis #CryptoTrading
$CYBER is showing a strong recovery after dropping to the $0.1991 support zone.
📊 Technical Overview (1D Chart)
Current Price: $0.2373
24H High: $0.2959
24H Low: $0.1991
MA(7): $0.2166
MA(25): $0.2590
MA(99): $0.3035
🔍 Key Levels to Watch:
🟢 Support: $0.2160–$0.2200
🟢 Major Support: $0.1990
🔴 Resistance: $0.2500–$0.2600
🔴 Strong Resistance: $0.2900–$0.2960
📈 My Market Prediction:
If CYBER holds above $0.2160 and the next daily candle closes with bullish momentum, we may see a move toward $0.2500–$0.2600.
A breakout above $0.2600 could open the door toward $0.2900.
However, if the price loses the $0.2160 support, a retest of $0.1990 is possible.
⚠️ Important: Price is still below MA(25) and MA(99), so a full trend reversal is not confirmed yet. Watch the daily candle close and volume before making any trading decision.
🔥 What do you think?
Will the next CYBER candle be GREEN 🟢 or RED 🔴?
Share your prediction below!
#CYBER #CYBERUSDT #CryptoAnalysis #TechnicalAnalysis #CryptoTrading
2
562

🔶 BNB DROPS BELOW $540! What Is Happening in the Market?
BNB is facing a significant correction as selling pressure continues across major cryptocurrencies.
📊 BNB Market Overview
• Price: $538.87
• 24H Change: -5.69%
• 24H High: $576.80
• 24H Low: $530.00
• Market Structure: Bearish
🔍 Market Analysis
BNB has experienced a notable decline over the last 24 hours.
The current market structure suggests that sellers remain active.
However, a price decline alone does not tell us whether the market has reached a bottom.
We need to monitor price stability, trading volume and buyer participation.
📌 Possible Market Scenarios
🐻 Bearish Scenario:
If BNB loses its recent low and selling volume increases, further weakness could develop.
🐂 Bullish Scenario:
A recovery above the recent trading range, supported by stronger buying activity, could improve market sentiment.
👀 Things to Watch
The $530 recent low.
Recovery attempts toward $550.
Daily trading volume.
Bitcoin's market direction.
TRADE NOW $BNB
{future}(BNBUSDT)
💬 Your Opinion:
Is BNB showing a potential recovery opportunity, or does the bearish trend remain dominant?
#BNB #BinanceCoin #CryptoMarket #TechnicalAnalysis
🔶 BNB DROPS BELOW $540! What Is Happening in the Market?
BNB is facing a significant correction as selling pressure continues across major cryptocurrencies.
📊 BNB Market Overview
• Price: $538.87
• 24H Change: -5.69%
• 24H High: $576.80
• 24H Low: $530.00
• Market Structure: Bearish
🔍 Market Analysis
BNB has experienced a notable decline over the last 24 hours.
The current market structure suggests that sellers remain active.
However, a price decline alone does not tell us whether the market has reached a bottom.
We need to monitor price stability, trading volume and buyer participation.
📌 Possible Market Scenarios
🐻 Bearish Scenario:
If BNB loses its recent low and selling volume increases, further weakness could develop.
🐂 Bullish Scenario:
A recovery above the recent trading range, supported by stronger buying activity, could improve market sentiment.
👀 Things to Watch
The $530 recent low.
Recovery attempts toward $550.
Daily trading volume.
Bitcoin's market direction.
TRADE NOW $BNB
💬 Your Opinion:
Is BNB showing a potential recovery opportunity, or does the bearish trend remain dominant?
#BNB #BinanceCoin #CryptoMarket #TechnicalAnalysis
BNB is facing a significant correction as selling pressure continues across major cryptocurrencies.
📊 BNB Market Overview
• Price: $538.87
• 24H Change: -5.69%
• 24H High: $576.80
• 24H Low: $530.00
• Market Structure: Bearish
🔍 Market Analysis
BNB has experienced a notable decline over the last 24 hours.
The current market structure suggests that sellers remain active.
However, a price decline alone does not tell us whether the market has reached a bottom.
We need to monitor price stability, trading volume and buyer participation.
📌 Possible Market Scenarios
🐻 Bearish Scenario:
If BNB loses its recent low and selling volume increases, further weakness could develop.
🐂 Bullish Scenario:
A recovery above the recent trading range, supported by stronger buying activity, could improve market sentiment.
👀 Things to Watch
The $530 recent low.
Recovery attempts toward $550.
Daily trading volume.
Bitcoin's market direction.
TRADE NOW $BNB
💬 Your Opinion:
Is BNB showing a potential recovery opportunity, or does the bearish trend remain dominant?
#BNB #BinanceCoin #CryptoMarket #TechnicalAnalysis
60

·
--
Bearish
📉 $AKE Technical Analysis & Trade Signal 📉
Signal Details:
🎯 Direction: SHORT 🔴
⚙️ Leverage: 5x (Isolated)
📍 Entry Zone: 0.00620 – 0.00650
💰 Target 1 (TP1): 0.00550
💰 Target 2 (TP2): 0.00510
🛑 Stop Loss (SL): 0.00685
📊 Estimated Directional Probability:
🔴 SHORT: 68% | 🟢 LONG: 32%
🔍 Technical Analysis Breakdown:
1️⃣ Price Action: The chart shows a catastrophic drop with a massive red candle. While the price is currently printing a small green candle (bouncing from ~0.0050), this is a classic weak reaction after an extreme oversold condition.
2️⃣ Indicators (SAR & SuperTrend): Both the Parabolic SAR (dots) and the SuperTrend line are positioned well above the current price (around 0.0067). This confirms a strong, dominant downtrend.
3️⃣ Moving Averages: The price is severely detached from all moving averages (MA, EMA, WMA). The short-term EMAs are acting as heavy dynamic resistance above the current price.
4️⃣ Volume: The volume on the way down was colossal. The current bounce has significantly less volume, indicating a lack of genuine buying interest to reverse the trend.
⚠️ Strategy Note & Risk Management:
Do not try to catch a falling knife: Trying to Long this setup is extremely high-risk. The safest play is to wait for a small bounce and Short the resistance.
Invalidation: If the price reclaims the 0.00685 level with high volume, this short setup is invalidated.
Always apply strict risk management, use isolated margin when possible, and avoid over-leveraging during volatile market conditions. DYOR & NFA (Do Your Own Research & Not Financial Advice).
#AKEUSDT #ShortSignal #CryptoTrading #TechnicalAnalysis
📉 $AKE Technical Analysis & Trade Signal 📉
Signal Details:
🎯 Direction: SHORT 🔴
⚙️ Leverage: 5x (Isolated)
📍 Entry Zone: 0.00620 – 0.00650
💰 Target 1 (TP1): 0.00550
💰 Target 2 (TP2): 0.00510
🛑 Stop Loss (SL): 0.00685
📊 Estimated Directional Probability:
🔴 SHORT: 68% | 🟢 LONG: 32%
🔍 Technical Analysis Breakdown:
1️⃣ Price Action: The chart shows a catastrophic drop with a massive red candle. While the price is currently printing a small green candle (bouncing from ~0.0050), this is a classic weak reaction after an extreme oversold condition.
2️⃣ Indicators (SAR & SuperTrend): Both the Parabolic SAR (dots) and the SuperTrend line are positioned well above the current price (around 0.0067). This confirms a strong, dominant downtrend.
3️⃣ Moving Averages: The price is severely detached from all moving averages (MA, EMA, WMA). The short-term EMAs are acting as heavy dynamic resistance above the current price.
4️⃣ Volume: The volume on the way down was colossal. The current bounce has significantly less volume, indicating a lack of genuine buying interest to reverse the trend.
⚠️ Strategy Note & Risk Management:
Do not try to catch a falling knife: Trying to Long this setup is extremely high-risk. The safest play is to wait for a small bounce and Short the resistance.
Invalidation: If the price reclaims the 0.00685 level with high volume, this short setup is invalidated.
Always apply strict risk management, use isolated margin when possible, and avoid over-leveraging during volatile market conditions. DYOR & NFA (Do Your Own Research & Not Financial Advice).
#AKEUSDT #ShortSignal #CryptoTrading #TechnicalAnalysis
Signal Details:
🎯 Direction: SHORT 🔴
⚙️ Leverage: 5x (Isolated)
📍 Entry Zone: 0.00620 – 0.00650
💰 Target 1 (TP1): 0.00550
💰 Target 2 (TP2): 0.00510
🛑 Stop Loss (SL): 0.00685
📊 Estimated Directional Probability:
🔴 SHORT: 68% | 🟢 LONG: 32%
🔍 Technical Analysis Breakdown:
1️⃣ Price Action: The chart shows a catastrophic drop with a massive red candle. While the price is currently printing a small green candle (bouncing from ~0.0050), this is a classic weak reaction after an extreme oversold condition.
2️⃣ Indicators (SAR & SuperTrend): Both the Parabolic SAR (dots) and the SuperTrend line are positioned well above the current price (around 0.0067). This confirms a strong, dominant downtrend.
3️⃣ Moving Averages: The price is severely detached from all moving averages (MA, EMA, WMA). The short-term EMAs are acting as heavy dynamic resistance above the current price.
4️⃣ Volume: The volume on the way down was colossal. The current bounce has significantly less volume, indicating a lack of genuine buying interest to reverse the trend.
⚠️ Strategy Note & Risk Management:
Do not try to catch a falling knife: Trying to Long this setup is extremely high-risk. The safest play is to wait for a small bounce and Short the resistance.
Invalidation: If the price reclaims the 0.00685 level with high volume, this short setup is invalidated.
Always apply strict risk management, use isolated margin when possible, and avoid over-leveraging during volatile market conditions. DYOR & NFA (Do Your Own Research & Not Financial Advice).
#AKEUSDT #ShortSignal #CryptoTrading #TechnicalAnalysis
1
1.1k

🚨 $ETH TESTS $1,553 SUPPORT — BREAKDOWN RISK RISING!
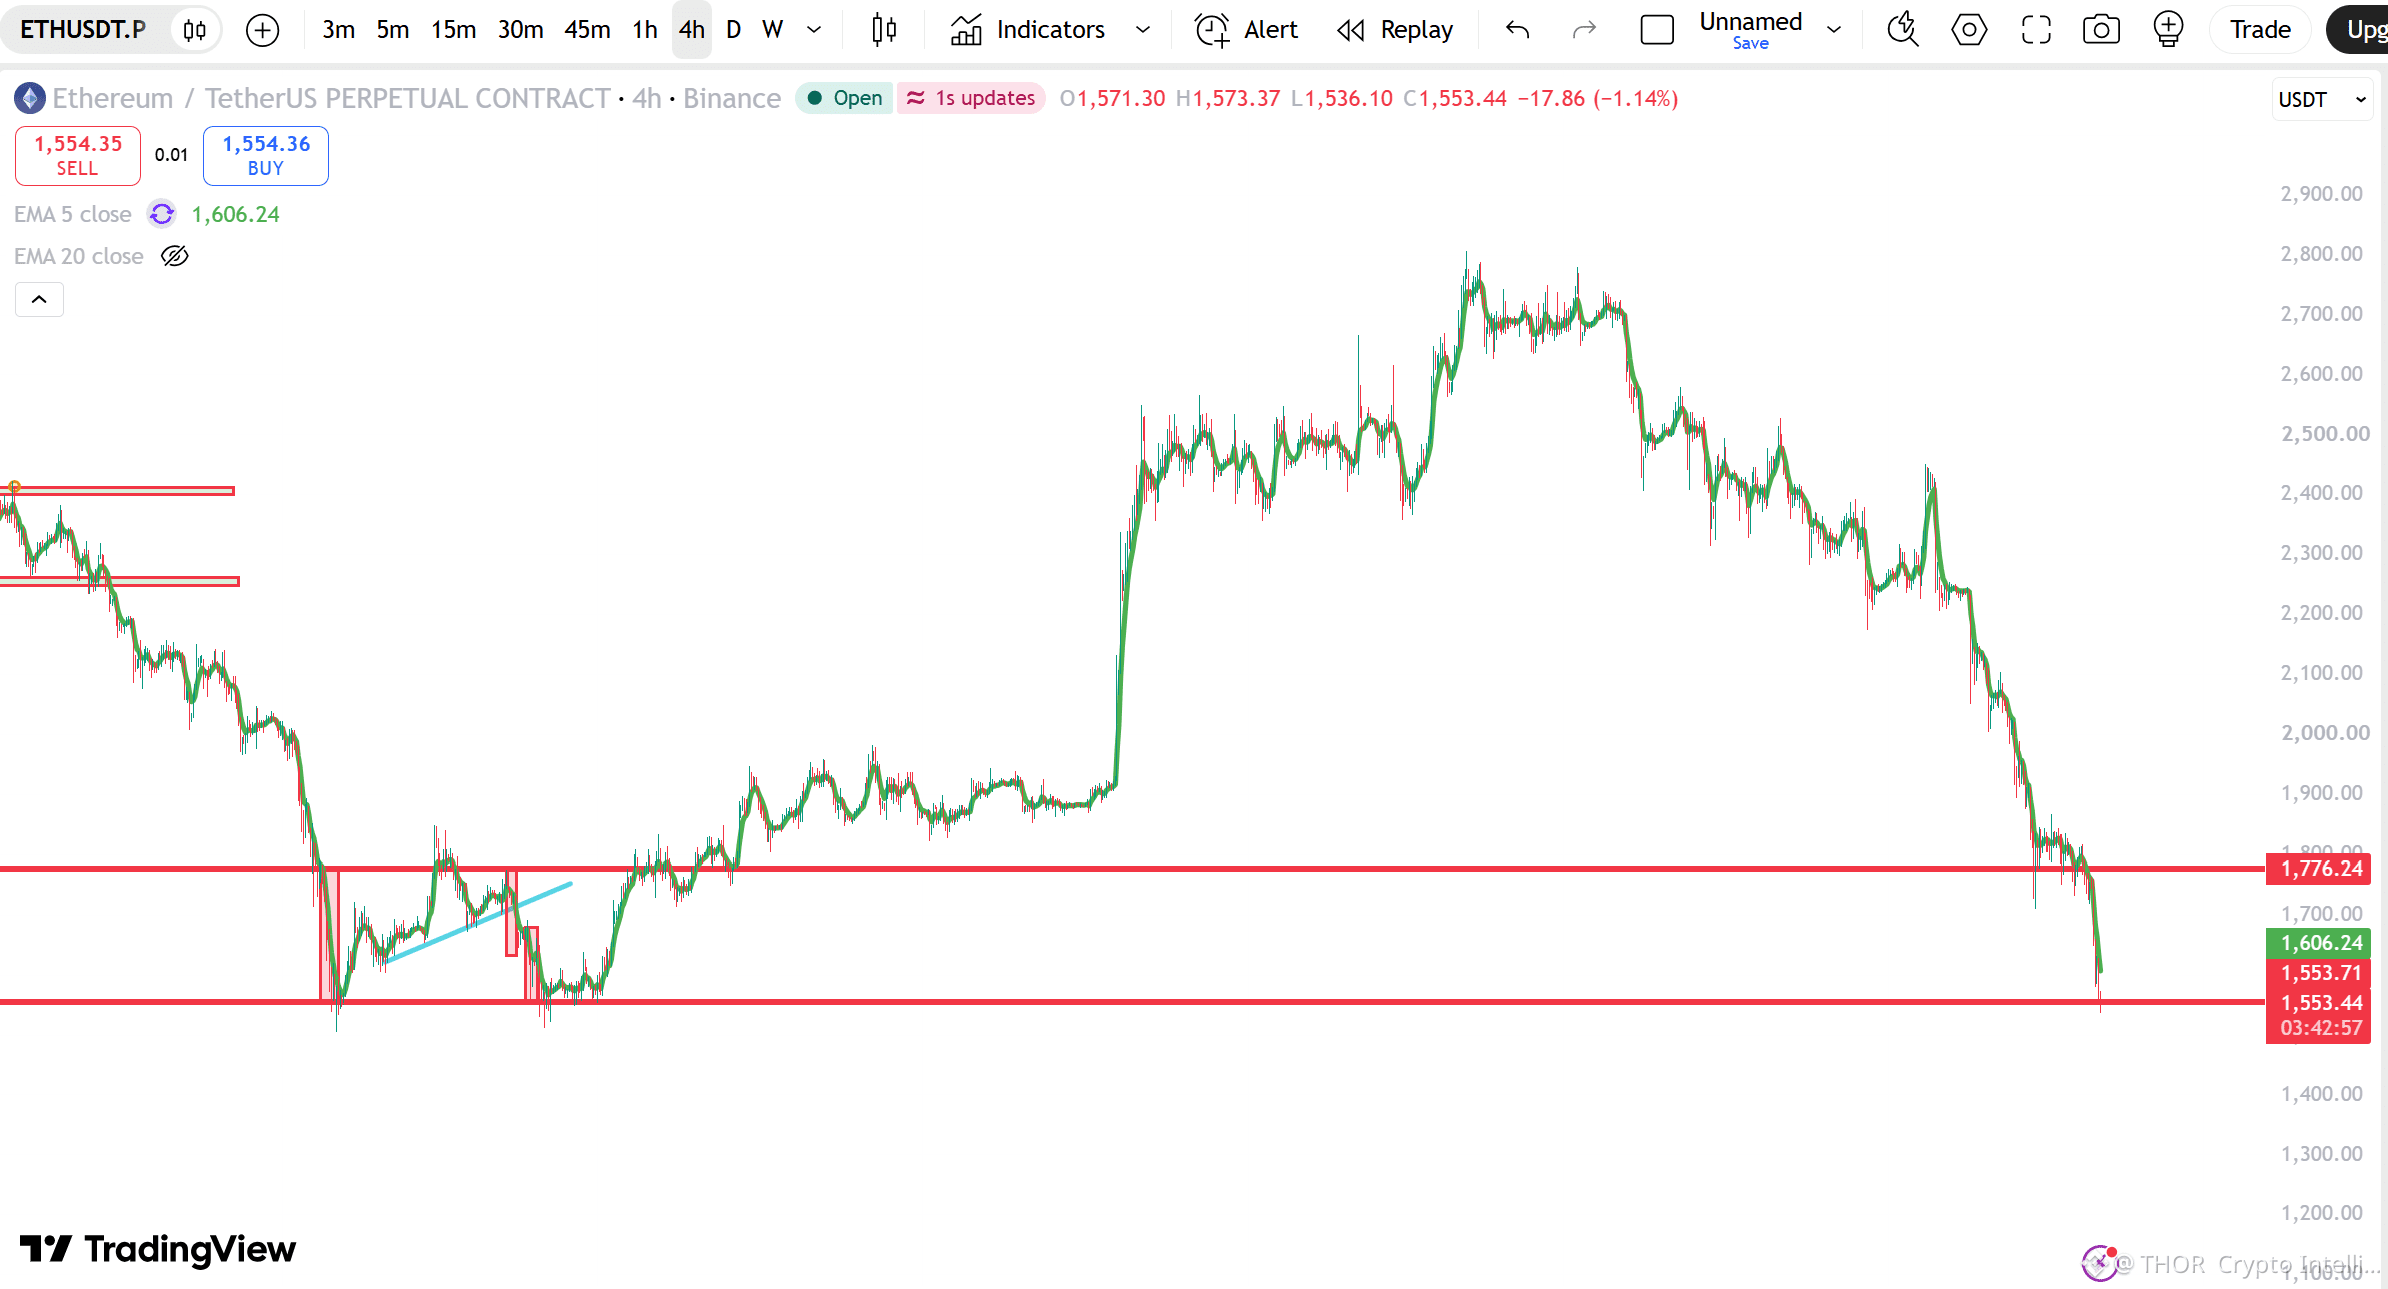
#Ethereum continues to face heavy selling pressure, dropping toward a critical 4H support level.
⚡ THOR Levels
📍 Current: $1,553.44
🔴 EMA 5: $1,606.24
🛡️ Key support: $1,553
🔴 Major resistance: $1,776
📉 4H low: $1,536.10
🟢 Bull case: Reclaim $1,606 and stabilize above support.
🔴 Bear case: Confirmed breakdown below $1,536 could accelerate selling.
⚠️ THOR Risk Alert: ETH remains below EMA 5, with bearish momentum intact.
⚡ THOR Signal: The $1,553 level is the immediate decision point. Watch the 4H close.
👇 What's next?
🟢 Support holds
🟡 Relief bounce
🔴 Breakdown continues
#ETH #TechnicalAnalysis #THORCryptoIntelligence
{future}(ETHUSDT)
$SOL
{future}(SOLUSDT)
$EVAA
{future}(EVAAUSDT)
🚨 $ETH TESTS $1,553 SUPPORT — BREAKDOWN RISK RISING!
#Ethereum continues to face heavy selling pressure, dropping toward a critical 4H support level.
⚡ THOR Levels
📍 Current: $1,553.44
🔴 EMA 5: $1,606.24
🛡️ Key support: $1,553
🔴 Major resistance: $1,776
📉 4H low: $1,536.10
🟢 Bull case: Reclaim $1,606 and stabilize above support.
🔴 Bear case: Confirmed breakdown below $1,536 could accelerate selling.
⚠️ THOR Risk Alert: ETH remains below EMA 5, with bearish momentum intact.
⚡ THOR Signal: The $1,553 level is the immediate decision point. Watch the 4H close.
👇 What's next?
🟢 Support holds
🟡 Relief bounce
🔴 Breakdown continues
#ETH #TechnicalAnalysis #THORCryptoIntelligence
$SOL
$EVAA
#Ethereum continues to face heavy selling pressure, dropping toward a critical 4H support level.
⚡ THOR Levels
📍 Current: $1,553.44
🔴 EMA 5: $1,606.24
🛡️ Key support: $1,553
🔴 Major resistance: $1,776
📉 4H low: $1,536.10
🟢 Bull case: Reclaim $1,606 and stabilize above support.
🔴 Bear case: Confirmed breakdown below $1,536 could accelerate selling.
⚠️ THOR Risk Alert: ETH remains below EMA 5, with bearish momentum intact.
⚡ THOR Signal: The $1,553 level is the immediate decision point. Watch the 4H close.
👇 What's next?
🟢 Support holds
🟡 Relief bounce
🔴 Breakdown continues
#ETH #TechnicalAnalysis #THORCryptoIntelligence
$SOL
$EVAA
624

$ZEC Alert! Oversold conditions near key support—Rebound incoming? 🚀
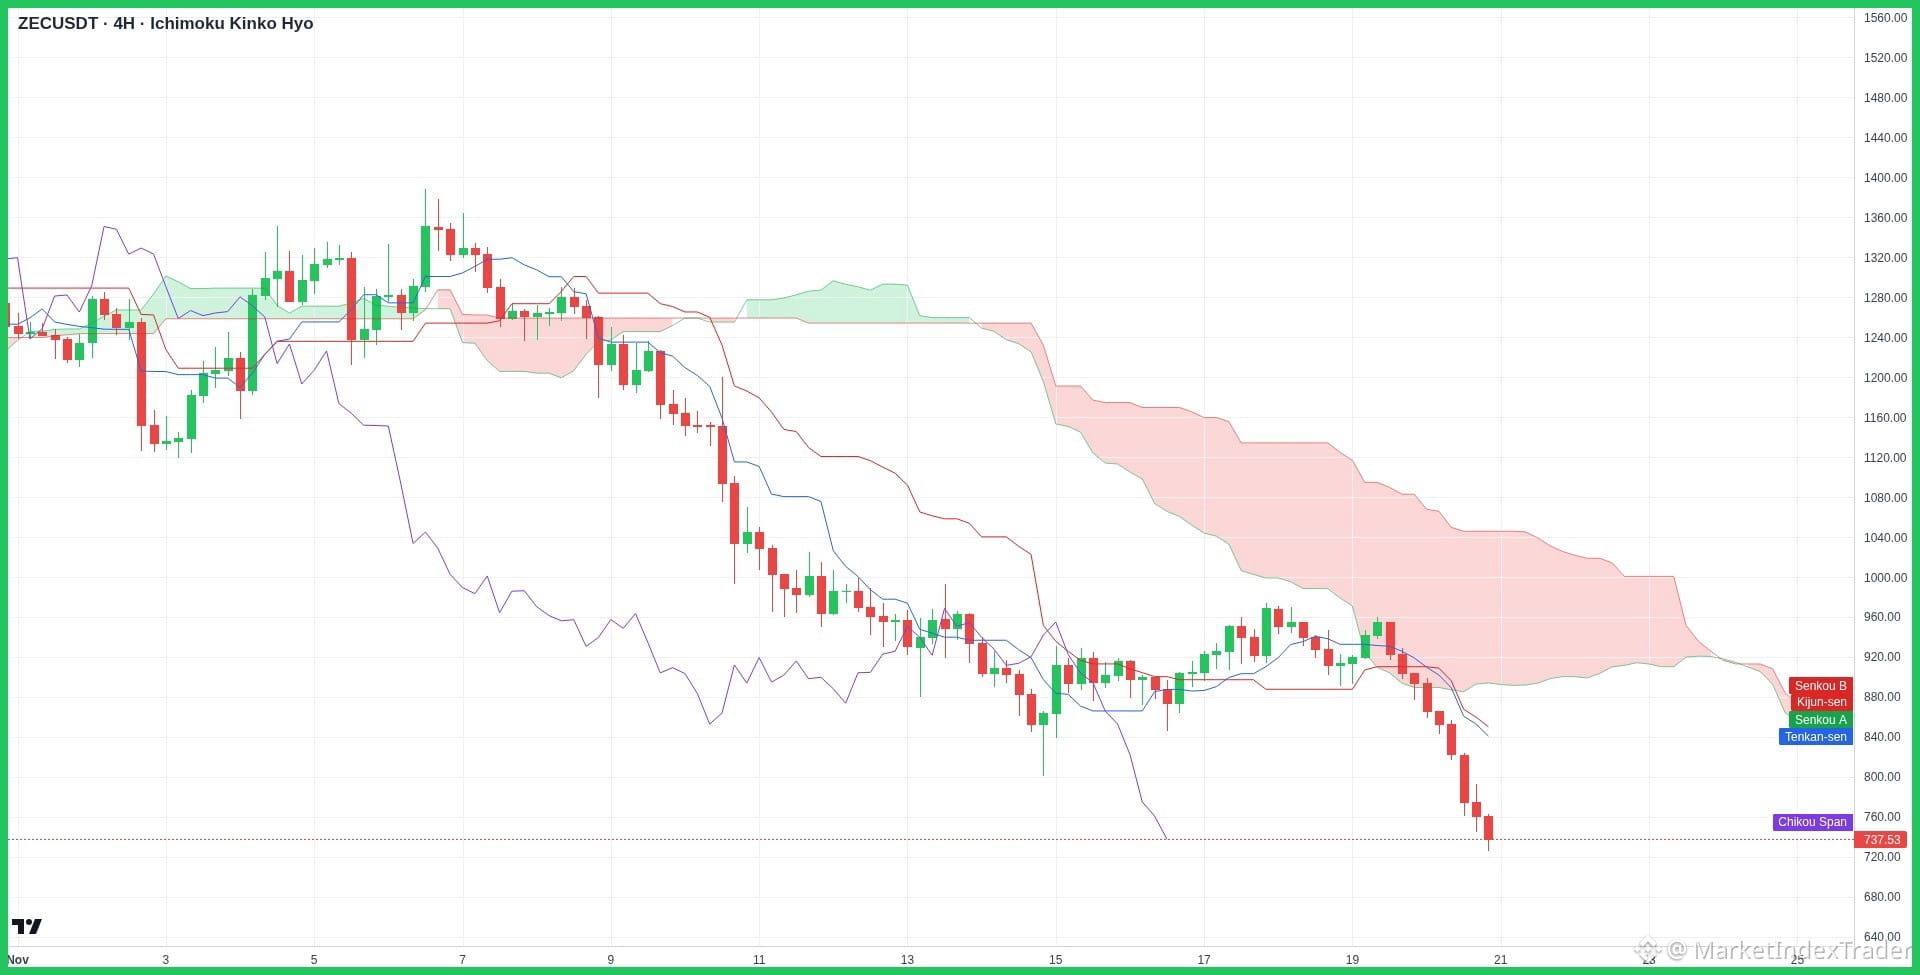
$ZEC's 4H chart shows price breaking below the Ichimoku Cloud, reaching oversold conditions near key support around $737.
Alright team, let's break down this $ZEC chart and see what's cooking on the 4-hour timeframe!
$ZEC has recently faced strong selling pressure, falling below the Ichimoku Cloud down to the $737 area. However, momentum indicators suggest we are reaching heavily oversold territory. Immediate support is established around $720 - $740, where buyers are expected to step in. On the upside, initial resistance sits at $840 - $880 (Tenkan/Kijun-sen), followed by major resistance near $920 - $960 at the cloud base.
On the fundamental side, Zcash continues to strengthen its position as a privacy leader through continuous zero-knowledge proof enhancements and wallet ecosystem upgrades like Zashi. Growing interest in decentralized financial privacy provides a solid long-term thesis for $ZEC despite short-term market volatility.
My strategy here is to watch for stabilization around the $720 support zone for a potential relief bounce toward resistance.
Highly recommend HOLD and Stacking $ZEC at Binance
Feel free to comment the altcoin you are holding and we will check it for you!
ZEC #TechnicalAnalysis #Crypto #BinanceSquare #Bitcoin #Zcash
$ZEC Alert! Oversold conditions near key support—Rebound incoming? 🚀
$ZEC 's 4H chart shows price breaking below the Ichimoku Cloud, reaching oversold conditions near key support around $737.
Alright team, let's break down this $ZEC chart and see what's cooking on the 4-hour timeframe!
$ZEC has recently faced strong selling pressure, falling below the Ichimoku Cloud down to the $737 area. However, momentum indicators suggest we are reaching heavily oversold territory. Immediate support is established around $720 - $740, where buyers are expected to step in. On the upside, initial resistance sits at $840 - $880 (Tenkan/Kijun-sen), followed by major resistance near $920 - $960 at the cloud base.
On the fundamental side, Zcash continues to strengthen its position as a privacy leader through continuous zero-knowledge proof enhancements and wallet ecosystem upgrades like Zashi. Growing interest in decentralized financial privacy provides a solid long-term thesis for $ZEC despite short-term market volatility.
My strategy here is to watch for stabilization around the $720 support zone for a potential relief bounce toward resistance.
Highly recommend HOLD and Stacking $ZEC at Binance
Feel free to comment the altcoin you are holding and we will check it for you!
ZEC #TechnicalAnalysis #Crypto #BinanceSquare #Bitcoin #Zcash
$ZEC 's 4H chart shows price breaking below the Ichimoku Cloud, reaching oversold conditions near key support around $737.
Alright team, let's break down this $ZEC chart and see what's cooking on the 4-hour timeframe!
$ZEC has recently faced strong selling pressure, falling below the Ichimoku Cloud down to the $737 area. However, momentum indicators suggest we are reaching heavily oversold territory. Immediate support is established around $720 - $740, where buyers are expected to step in. On the upside, initial resistance sits at $840 - $880 (Tenkan/Kijun-sen), followed by major resistance near $920 - $960 at the cloud base.
On the fundamental side, Zcash continues to strengthen its position as a privacy leader through continuous zero-knowledge proof enhancements and wallet ecosystem upgrades like Zashi. Growing interest in decentralized financial privacy provides a solid long-term thesis for $ZEC despite short-term market volatility.
My strategy here is to watch for stabilization around the $720 support zone for a potential relief bounce toward resistance.
Highly recommend HOLD and Stacking $ZEC at Binance
Feel free to comment the altcoin you are holding and we will check it for you!
ZEC #TechnicalAnalysis #Crypto #BinanceSquare #Bitcoin #Zcash
315

·
--
Bearish
{future}(EVAAUSDT)
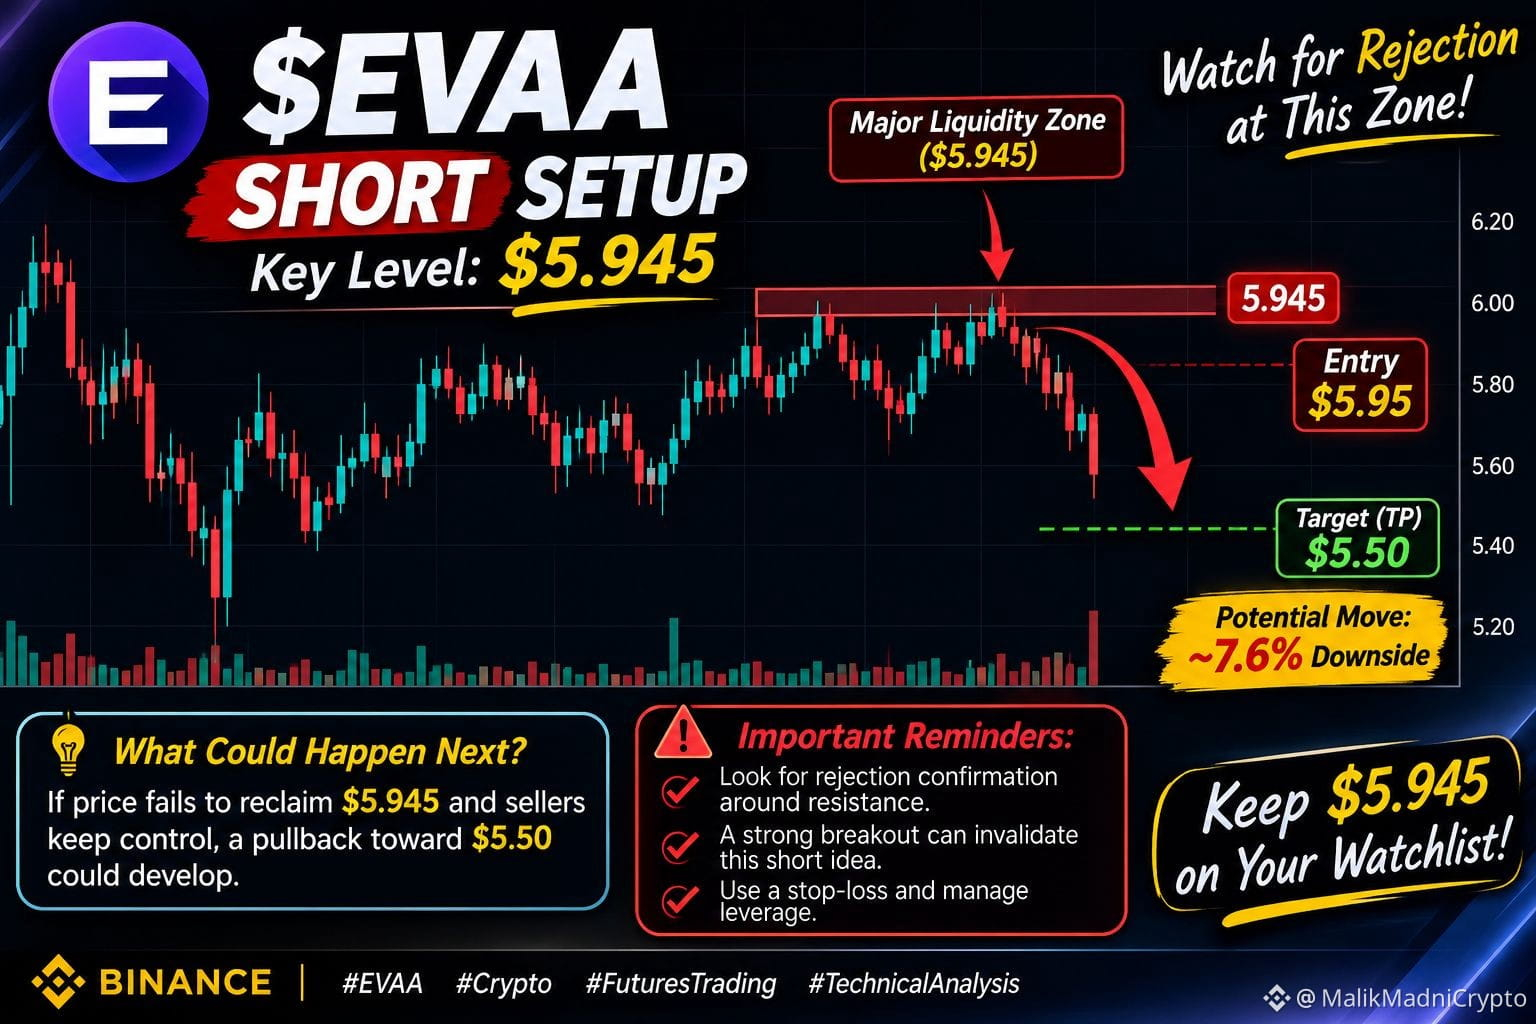
🚨 $EVAA : SELLERS ARE DEFENDING THE $5.945 ZONE!
EVAA recently showed a major liquidity reaction around $5.945, where significant short-side liquidity activity was observed.
This level is now worth watching closely.
📍 Potential Entry: $5.95
🎯 Target: $5.50
📉 Potential Downside: Around 7.6%
What could happen next?
If price fails to reclaim $5.945 and sellers maintain control, a move toward $5.50 could become possible.
⚠️ Important Risk Factors:
- Watch for rejection confirmation around resistance.
- A strong breakout above the recent high could invalidate this short idea.
- Avoid entering without confirmation.
- Always use a stop-loss and control leverage.
The key is not to predict every move, but to wait for price action to confirm the setup.
👀 Keep $5.945 on your watchlist!
#EVAA #BinanceHerYerde #CryptoTrading #FuturesTrading #TechnicalAnalysis @MalikMadniCrypto
🚨 $EVAA : SELLERS ARE DEFENDING THE $5.945 ZONE!
EVAA recently showed a major liquidity reaction around $5.945, where significant short-side liquidity activity was observed.
This level is now worth watching closely.
📍 Potential Entry: $5.95
🎯 Target: $5.50
📉 Potential Downside: Around 7.6%
What could happen next?
If price fails to reclaim $5.945 and sellers maintain control, a move toward $5.50 could become possible.
⚠️ Important Risk Factors:
- Watch for rejection confirmation around resistance.
- A strong breakout above the recent high could invalidate this short idea.
- Avoid entering without confirmation.
- Always use a stop-loss and control leverage.
The key is not to predict every move, but to wait for price action to confirm the setup.
👀 Keep $5.945 on your watchlist!
#EVAA #BinanceHerYerde #CryptoTrading #FuturesTrading #TechnicalAnalysis @MalikMadniCrypto
🚨 $EVAA : SELLERS ARE DEFENDING THE $5.945 ZONE!
EVAA recently showed a major liquidity reaction around $5.945, where significant short-side liquidity activity was observed.
This level is now worth watching closely.
📍 Potential Entry: $5.95
🎯 Target: $5.50
📉 Potential Downside: Around 7.6%
What could happen next?
If price fails to reclaim $5.945 and sellers maintain control, a move toward $5.50 could become possible.
⚠️ Important Risk Factors:
- Watch for rejection confirmation around resistance.
- A strong breakout above the recent high could invalidate this short idea.
- Avoid entering without confirmation.
- Always use a stop-loss and control leverage.
The key is not to predict every move, but to wait for price action to confirm the setup.
👀 Keep $5.945 on your watchlist!
#EVAA #BinanceHerYerde #CryptoTrading #FuturesTrading #TechnicalAnalysis @MalikMadniCrypto
424
Is $HYPE gearing up for a massive reversal or a deeper dip? 👀
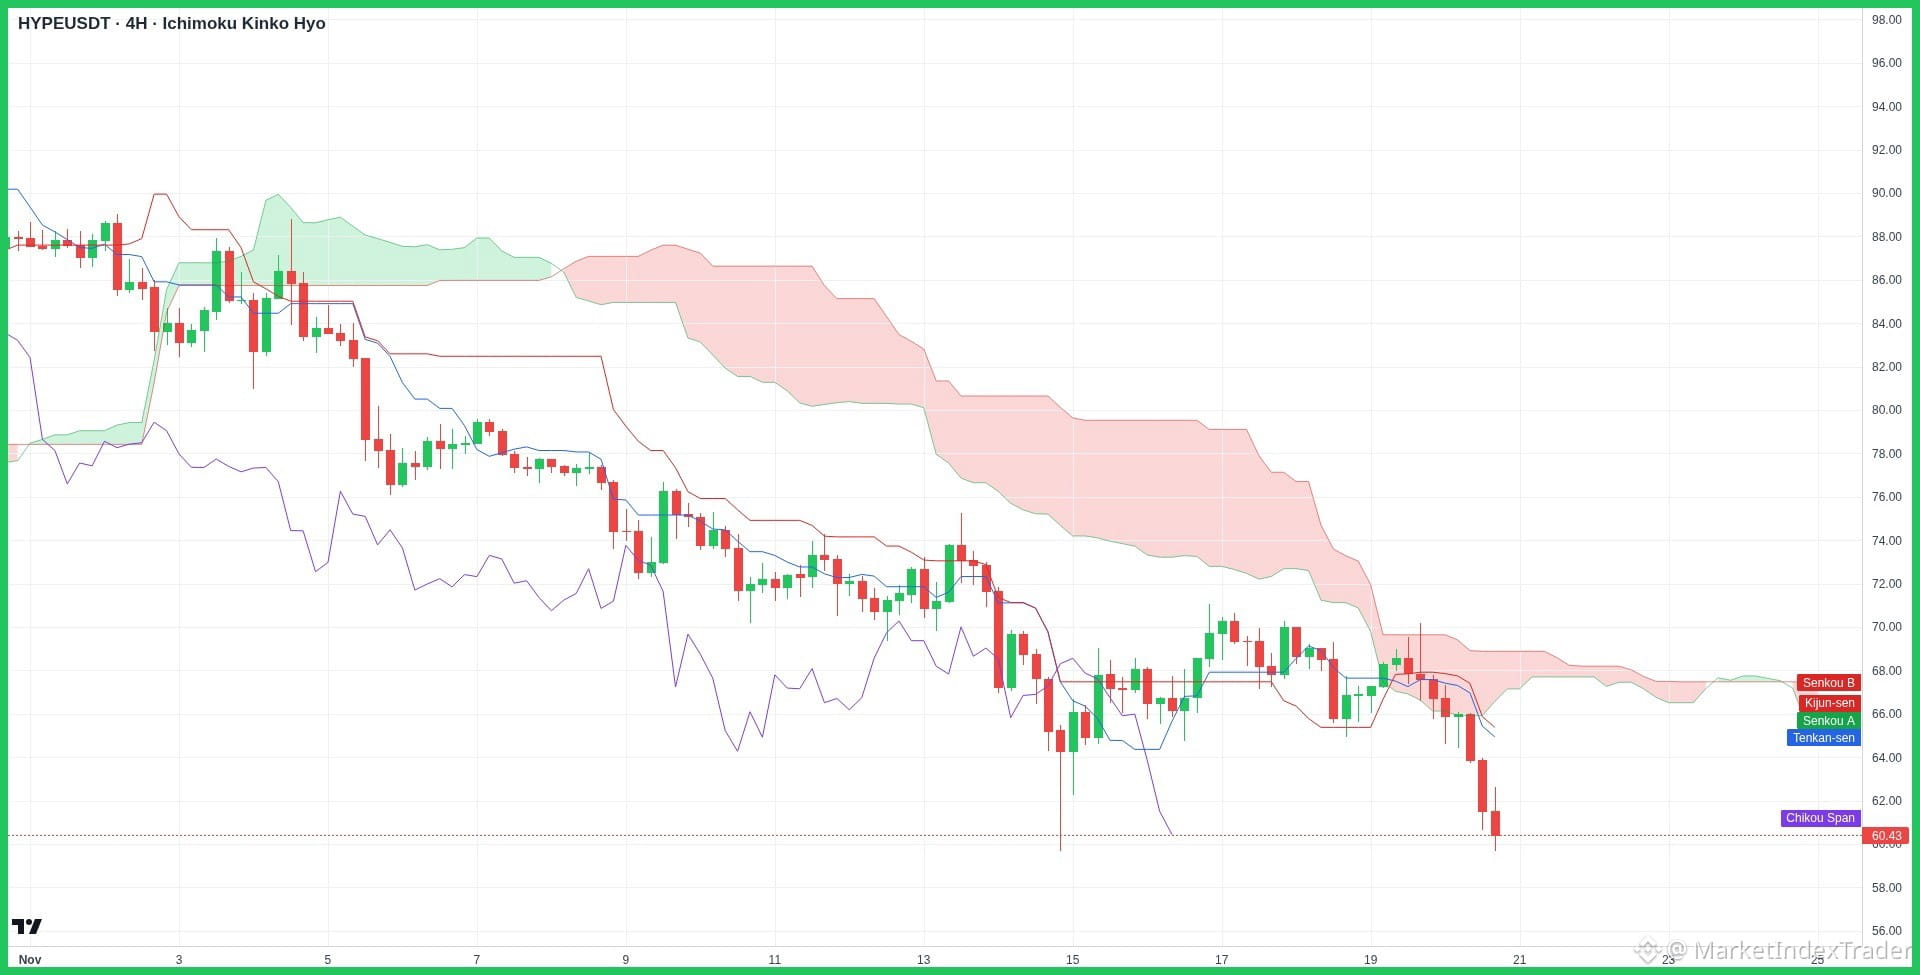
$HYPE's H4 chart shows a sharp breakdown below the $65 support level, testing the $60 demand zone.
Alright team, let's break down this spicy $HYPE chart and see where the next big move is heading!
Looking at the 4H Ichimoku Kinko Hyo chart, $HYPE has experienced a sharp sell-off, breaking past the $65.00 baseline down into the critical $58.00 - $60.00 demand zone. The red Cloud overhead presents clear resistance near $65.00 and $68.00. However, with price pushing into key support, momentum indicators hint at potential seller exhaustion and a strong bounce scenario.
On the fundamental front, Hyperliquid continues to show impressive DEX volume growth and user adoption. Ongoing platform upgrades and expanding liquidity make $HYPE a strong performer for long-term holders despite temporary market pullbacks.
My action plan is to watch the $58.00 - $60.00 support level closely for a bullish confirmation signal before looking for a recovery target back toward $68.00.
Highly recommend HOLD and Stacking $HYPE at Binance
Feel free to comment the altcoin you are holding and we will check it for you!
HYPE #TechnicalAnalysis #Crypto #BinanceSquare #Bitcoin
Is $HYPE gearing up for a massive reversal or a deeper dip? 👀
$HYPE 's H4 chart shows a sharp breakdown below the $65 support level, testing the $60 demand zone.
Alright team, let's break down this spicy $HYPE chart and see where the next big move is heading!
Looking at the 4H Ichimoku Kinko Hyo chart, $HYPE has experienced a sharp sell-off, breaking past the $65.00 baseline down into the critical $58.00 - $60.00 demand zone. The red Cloud overhead presents clear resistance near $65.00 and $68.00. However, with price pushing into key support, momentum indicators hint at potential seller exhaustion and a strong bounce scenario.
On the fundamental front, Hyperliquid continues to show impressive DEX volume growth and user adoption. Ongoing platform upgrades and expanding liquidity make $HYPE a strong performer for long-term holders despite temporary market pullbacks.
My action plan is to watch the $58.00 - $60.00 support level closely for a bullish confirmation signal before looking for a recovery target back toward $68.00.
Highly recommend HOLD and Stacking $HYPE at Binance
Feel free to comment the altcoin you are holding and we will check it for you!
HYPE #TechnicalAnalysis #Crypto #BinanceSquare #Bitcoin
$HYPE 's H4 chart shows a sharp breakdown below the $65 support level, testing the $60 demand zone.
Alright team, let's break down this spicy $HYPE chart and see where the next big move is heading!
Looking at the 4H Ichimoku Kinko Hyo chart, $HYPE has experienced a sharp sell-off, breaking past the $65.00 baseline down into the critical $58.00 - $60.00 demand zone. The red Cloud overhead presents clear resistance near $65.00 and $68.00. However, with price pushing into key support, momentum indicators hint at potential seller exhaustion and a strong bounce scenario.
On the fundamental front, Hyperliquid continues to show impressive DEX volume growth and user adoption. Ongoing platform upgrades and expanding liquidity make $HYPE a strong performer for long-term holders despite temporary market pullbacks.
My action plan is to watch the $58.00 - $60.00 support level closely for a bullish confirmation signal before looking for a recovery target back toward $68.00.
Highly recommend HOLD and Stacking $HYPE at Binance
Feel free to comment the altcoin you are holding and we will check it for you!
HYPE #TechnicalAnalysis #Crypto #BinanceSquare #Bitcoin
220

The Money Flow Index corroborates the bearish directional bias, indicating that momentum aligns with the anticipated downward movement in price.
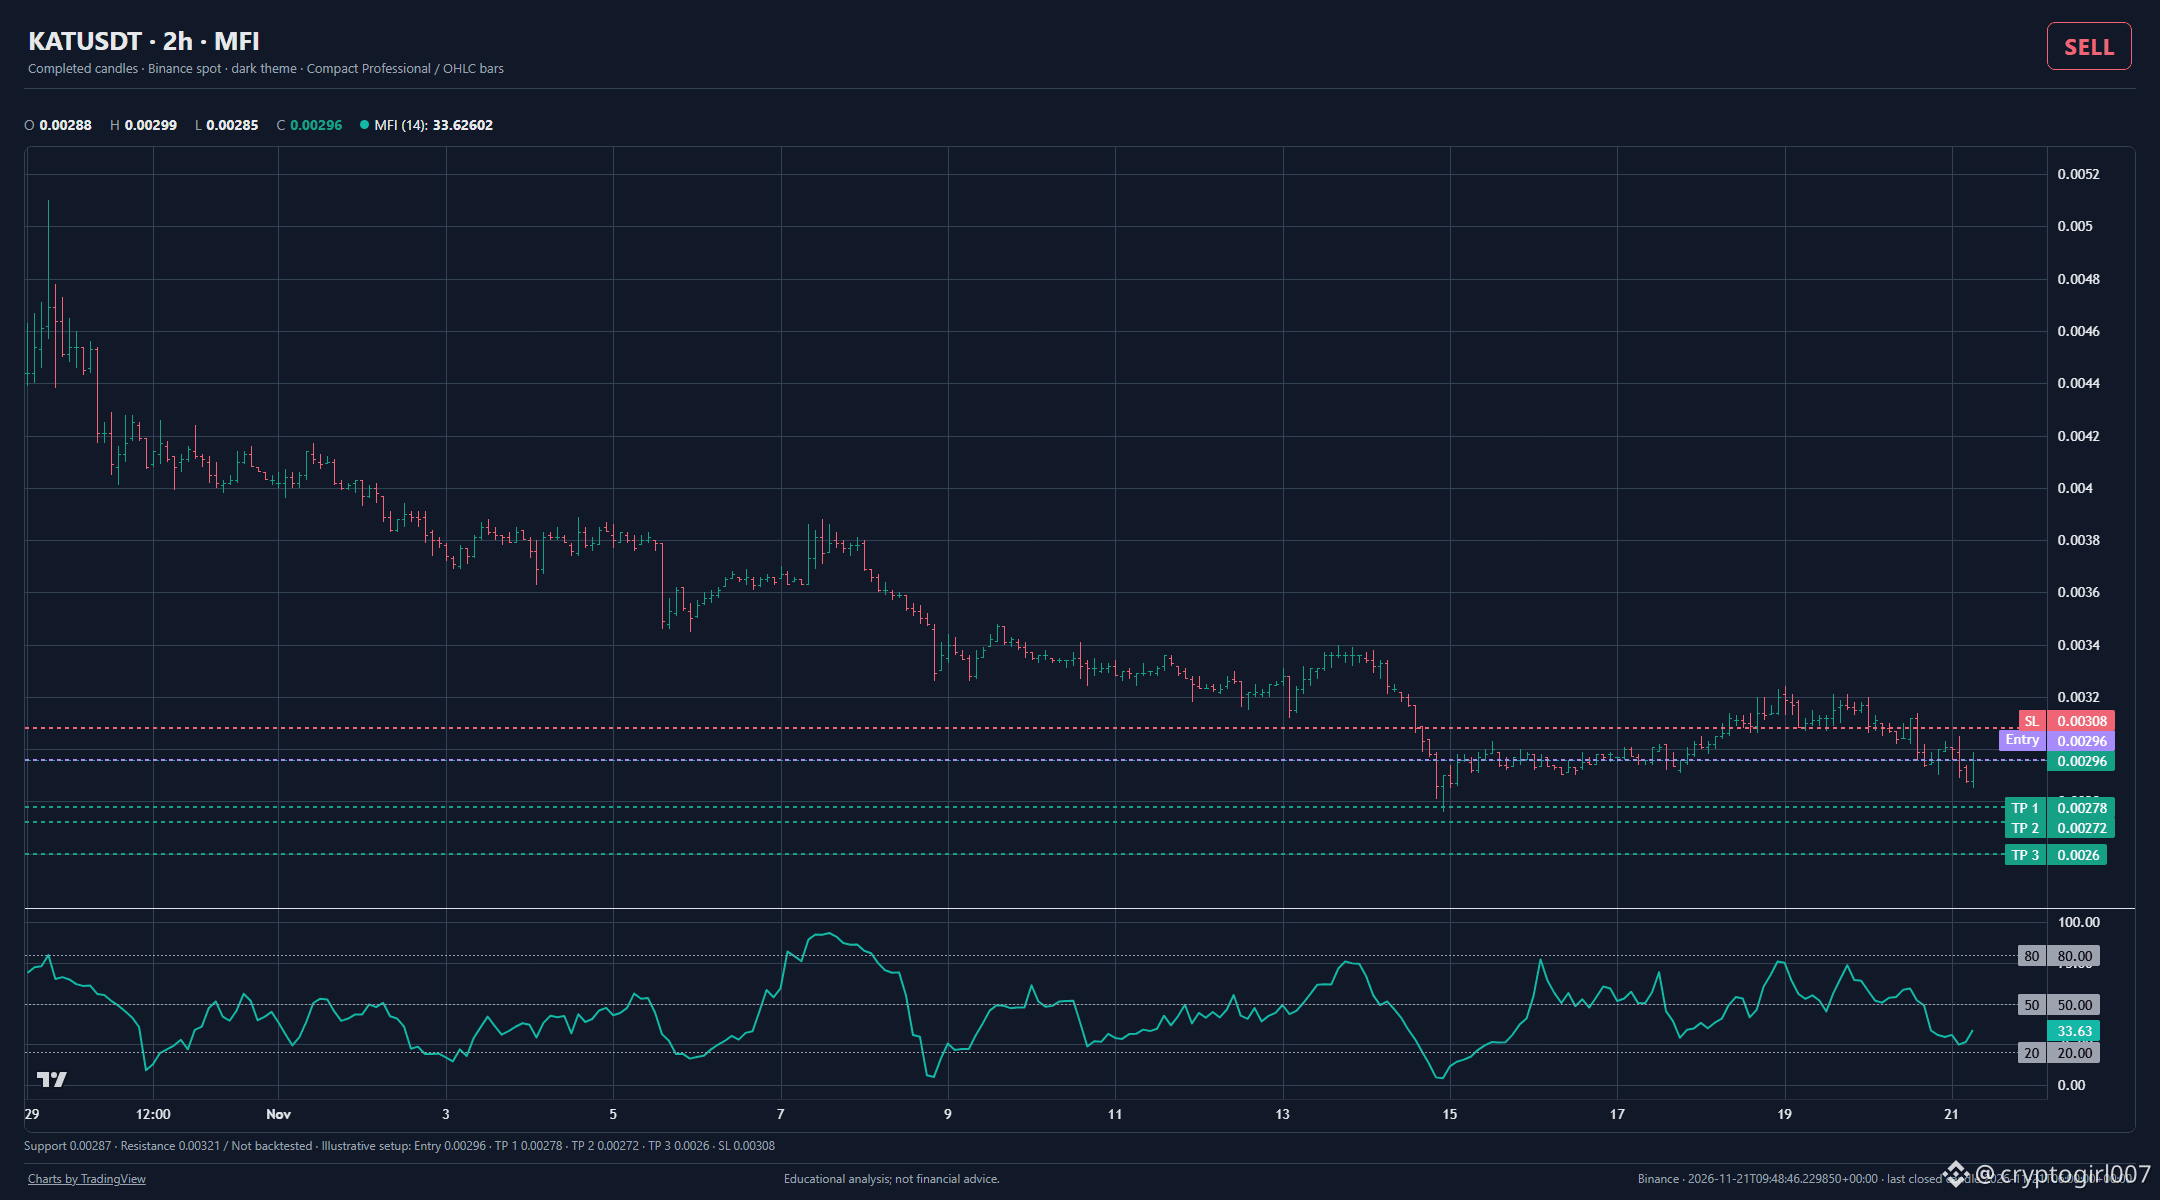
$KAT is showing a bearish setup on the two-hour chart.
MFI supports the bearish reading. This supports the Sell signal. The last closed candle was around 0.00296 USDT. Support sits near 0.00287, with resistance around 0.00321.
SELL · illustrative short setup (USDT)
Entry ≈ 0.00296
TP1 ≈ 0.00278
TP2 ≈ 0.00272
TP3 ≈ 0.0026
SL ≈ 0.00308
Closed-candle analysis, not a live quote or trade instruction; not backtested.
#TechnicalAnalysis #DYOR
Educational analysis; not financial advice.
{spot}(KATUSDT)
The Money Flow Index corroborates the bearish directional bias, indicating that momentum aligns with the anticipated downward movement in price.
$KAT is showing a bearish setup on the two-hour chart.
MFI supports the bearish reading. This supports the Sell signal. The last closed candle was around 0.00296 USDT. Support sits near 0.00287, with resistance around 0.00321.
SELL · illustrative short setup (USDT)
Entry ≈ 0.00296
TP1 ≈ 0.00278
TP2 ≈ 0.00272
TP3 ≈ 0.0026
SL ≈ 0.00308
Closed-candle analysis, not a live quote or trade instruction; not backtested.
#TechnicalAnalysis #DYOR
Educational analysis; not financial advice.
$KAT is showing a bearish setup on the two-hour chart.
MFI supports the bearish reading. This supports the Sell signal. The last closed candle was around 0.00296 USDT. Support sits near 0.00287, with resistance around 0.00321.
SELL · illustrative short setup (USDT)
Entry ≈ 0.00296
TP1 ≈ 0.00278
TP2 ≈ 0.00272
TP3 ≈ 0.0026
SL ≈ 0.00308
Closed-candle analysis, not a live quote or trade instruction; not backtested.
#TechnicalAnalysis #DYOR
Educational analysis; not financial advice.
1
1

🦈 $DEXE TESTS INSTITUTIONAL LIQUIDITY AT KEY SUPPORT BEFORE THE NEXT EXPANSIVE SWING ⚡
Entry: 1.10 ⚡
Target: 1.234 🚀
Stop Loss: 1.017 ⚠️
Smart money is currently auditing order flow around this critical demand floor to gauge whether institutional accumulation can outpace lingering sell-side pressure. 📊
Volume expansion on any sustained retest of the pivot zone will be the ultimate tell for whether buyers are preparing to engineer a liquidity sweep toward overhead resistance. 💡
💬 Are you positioning for the range reclaim here, or waiting for confirmation below the threshold? 👇
⚠️ Not financial advice. Always manage your risk. 🛡️
🏷️ #DEXE #SmartMoney #Altcoins #TechnicalAnalysis
🦈 ⚖️
🦈 $DEXE TESTS INSTITUTIONAL LIQUIDITY AT KEY SUPPORT BEFORE THE NEXT EXPANSIVE SWING ⚡
Entry: 1.10 ⚡
Target: 1.234 🚀
Stop Loss: 1.017 ⚠️
Smart money is currently auditing order flow around this critical demand floor to gauge whether institutional accumulation can outpace lingering sell-side pressure. 📊
Volume expansion on any sustained retest of the pivot zone will be the ultimate tell for whether buyers are preparing to engineer a liquidity sweep toward overhead resistance. 💡
💬 Are you positioning for the range reclaim here, or waiting for confirmation below the threshold? 👇
⚠️ Not financial advice. Always manage your risk. 🛡️
🏷️ #DEXE #SmartMoney #Altcoins #TechnicalAnalysis
🦈 ⚖️
Entry: 1.10 ⚡
Target: 1.234 🚀
Stop Loss: 1.017 ⚠️
Smart money is currently auditing order flow around this critical demand floor to gauge whether institutional accumulation can outpace lingering sell-side pressure. 📊
Volume expansion on any sustained retest of the pivot zone will be the ultimate tell for whether buyers are preparing to engineer a liquidity sweep toward overhead resistance. 💡
💬 Are you positioning for the range reclaim here, or waiting for confirmation below the threshold? 👇
⚠️ Not financial advice. Always manage your risk. 🛡️
🏷️ #DEXE #SmartMoney #Altcoins #TechnicalAnalysis
🦈 ⚖️

10

·
--
$WLD 1D TECHNICAL SETUP TO WATCH 👀
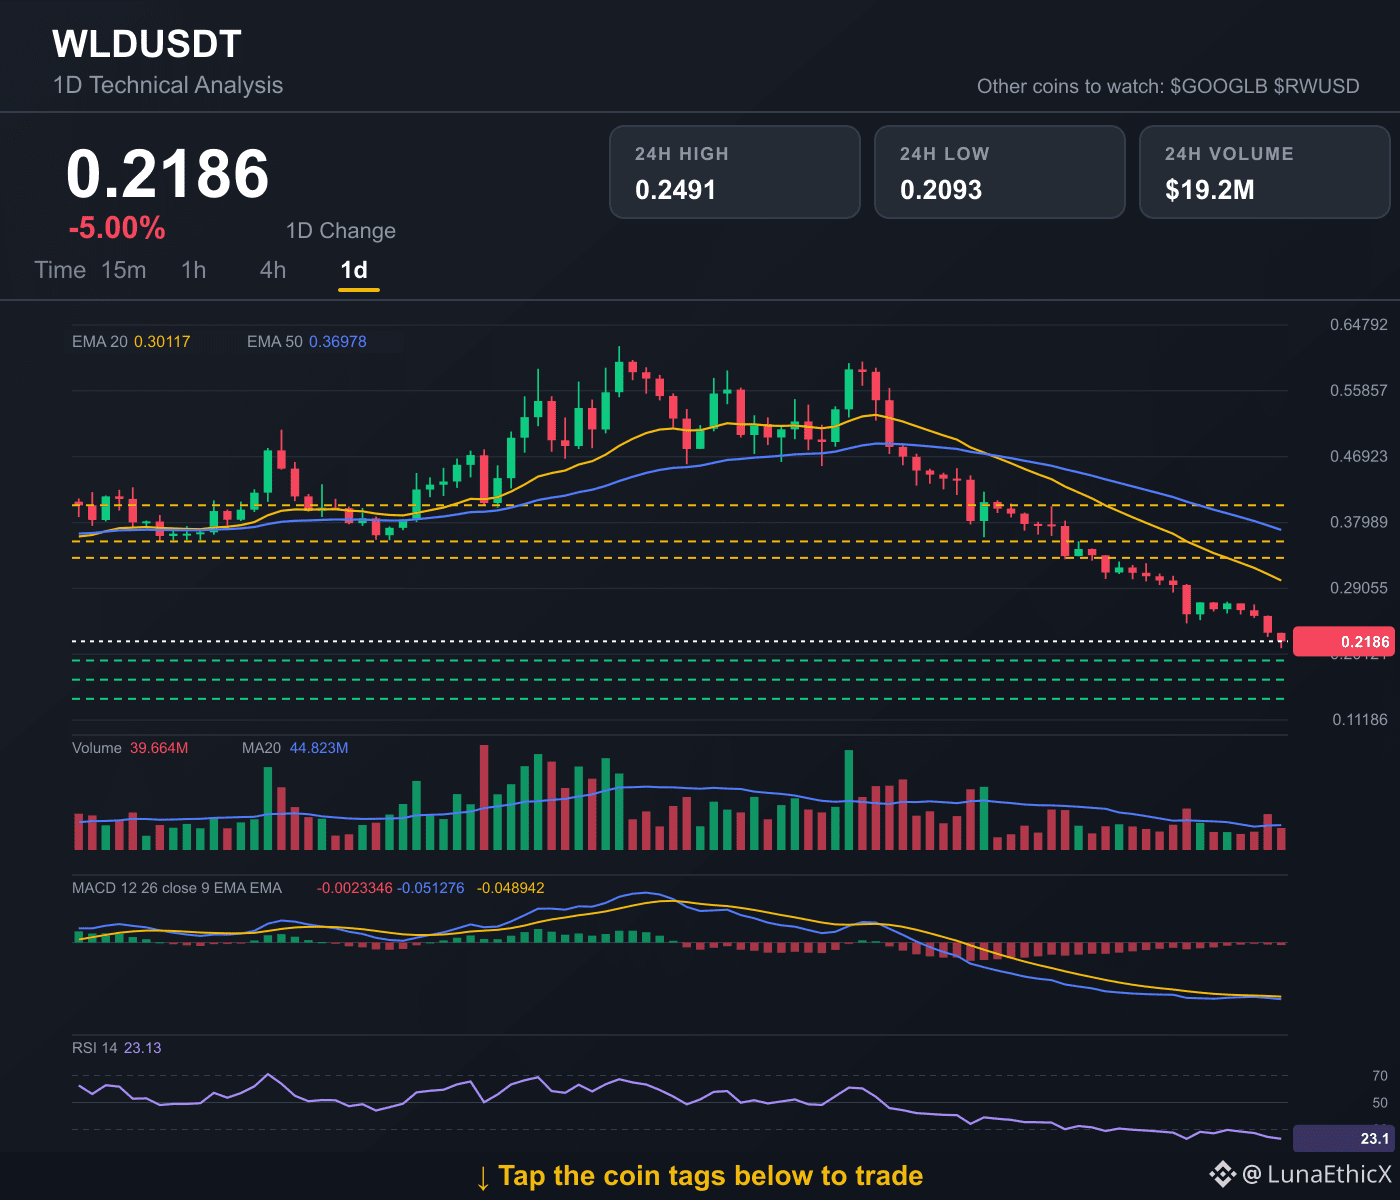
The chart stays technically pressured as 0.2186 holds beneath EMA20 0.3012 and EMA50 0.3698. RSI at 23.13 shows an oversold condition, while MACD -0.05128 versus signal -0.04894 remains weak, though histogram momentum is fading. Bulls may meet resistance around 0.3319, 0.3542 and 0.4033. The main support levels sit at 0.1926, 0.1666 and 0.1406.
Two more names on the radar: $GOOGLB and $RWUSD. 🔍
💰 Your next market check could start below. Tap a coin to explore.
#TechnicalAnalysis #CryptoAnalysis #BinanceSquare
$WLD $GOOGLB $RWUSD
$WLD 1D TECHNICAL SETUP TO WATCH 👀
The chart stays technically pressured as 0.2186 holds beneath EMA20 0.3012 and EMA50 0.3698. RSI at 23.13 shows an oversold condition, while MACD -0.05128 versus signal -0.04894 remains weak, though histogram momentum is fading. Bulls may meet resistance around 0.3319, 0.3542 and 0.4033. The main support levels sit at 0.1926, 0.1666 and 0.1406.
Two more names on the radar: $GOOGLB and $RWUSD . 🔍
💰 Your next market check could start below. Tap a coin to explore.
#TechnicalAnalysis #CryptoAnalysis #BinanceSquare
$WLD $GOOGLB $RWUSD
The chart stays technically pressured as 0.2186 holds beneath EMA20 0.3012 and EMA50 0.3698. RSI at 23.13 shows an oversold condition, while MACD -0.05128 versus signal -0.04894 remains weak, though histogram momentum is fading. Bulls may meet resistance around 0.3319, 0.3542 and 0.4033. The main support levels sit at 0.1926, 0.1666 and 0.1406.
Two more names on the radar: $GOOGLB and $RWUSD . 🔍
💰 Your next market check could start below. Tap a coin to explore.
#TechnicalAnalysis #CryptoAnalysis #BinanceSquare
$WLD $GOOGLB $RWUSD
1

·
--
$HYPE is fighting for air. 🔥
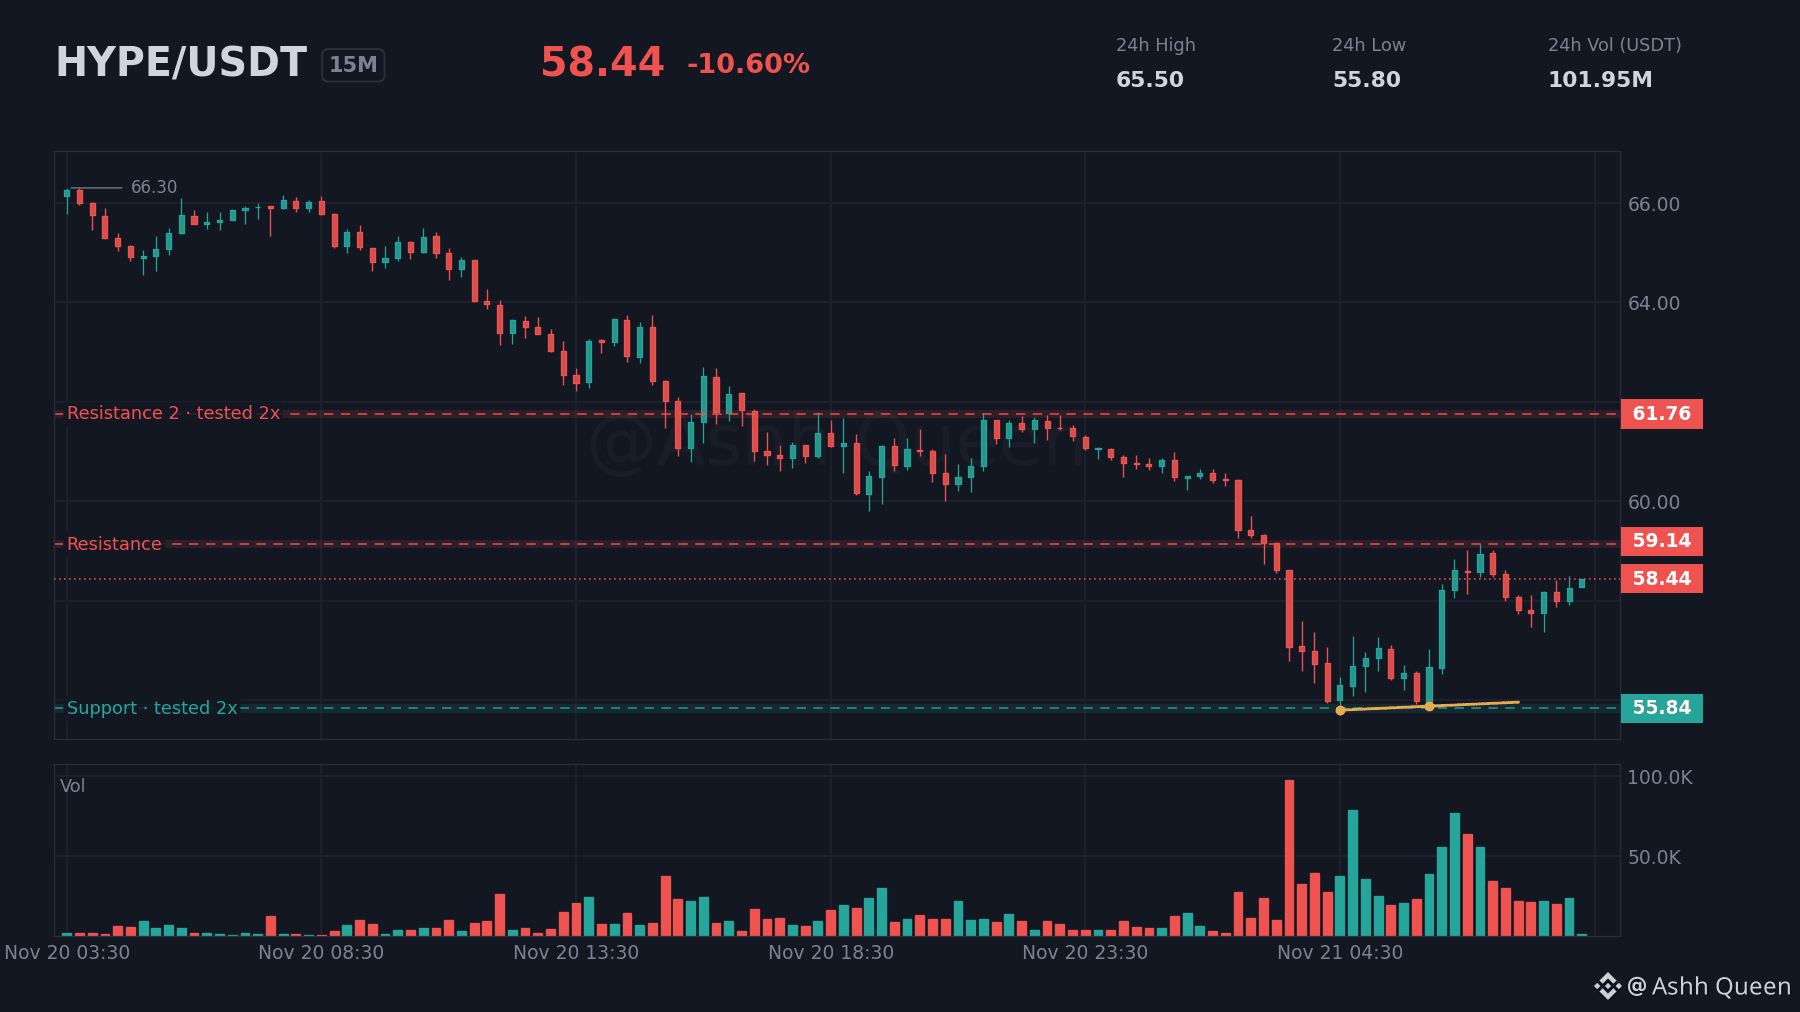
Price is at 58.44 with a -10.60% drop over the day.
Bulls need a push through resistance at 59.14 to regain momentum. Bears are pushing hard to break support at 55.84 and continue the slide. ⚡
The trend is neutral for now. I am watching if the current bounce holds or if it fades back down. 🚀
How have you handled a similar tight range setup in the past?
#HYPE #DeFi #TechnicalAnalysis #Altcoins
This is analysis, not a recommendation. Manage risk first, profit second.
$HYPE is fighting for air. 🔥
Price is at 58.44 with a -10.60% drop over the day.
Bulls need a push through resistance at 59.14 to regain momentum. Bears are pushing hard to break support at 55.84 and continue the slide. ⚡
The trend is neutral for now. I am watching if the current bounce holds or if it fades back down. 🚀
How have you handled a similar tight range setup in the past?
#HYPE #DeFi #TechnicalAnalysis #Altcoins
This is analysis, not a recommendation. Manage risk first, profit second.
Price is at 58.44 with a -10.60% drop over the day.
Bulls need a push through resistance at 59.14 to regain momentum. Bears are pushing hard to break support at 55.84 and continue the slide. ⚡
The trend is neutral for now. I am watching if the current bounce holds or if it fades back down. 🚀
How have you handled a similar tight range setup in the past?
#HYPE #DeFi #TechnicalAnalysis #Altcoins
This is analysis, not a recommendation. Manage risk first, profit second.
5

🔴 $PROM · 1D
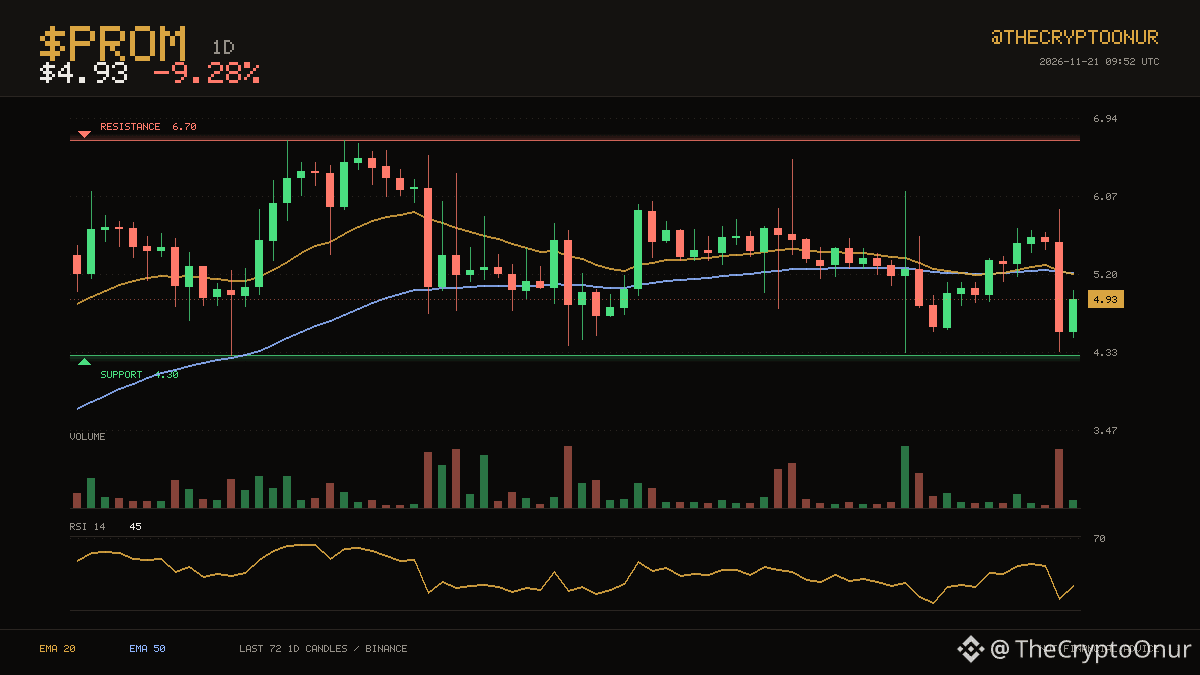
Price is $4.93 and $PROM remains below the averages that capped it earlier. $4.30 on the low side and $6.70 on the high side have contained the last two months. Price is down in the lower third of that range. The floor is 12.8% away and the ceiling is nowhere close. The 20 crossed below the 50 recently, for only 1 candles, so this leg is still young. RSI at 45 is neutral, so momentum is not blocking a move either way. Over the past day it has traded between $4.35 and $5.93, sitting around the middle of it now. Participation is light at about 0.4x average volume. Down 9.3% over 24 hours.
DYOR
$PROM #TechnicalAnalysis
🔴 $PROM · 1D
Price is $4.93 and $PROM remains below the averages that capped it earlier. $4.30 on the low side and $6.70 on the high side have contained the last two months. Price is down in the lower third of that range. The floor is 12.8% away and the ceiling is nowhere close. The 20 crossed below the 50 recently, for only 1 candles, so this leg is still young. RSI at 45 is neutral, so momentum is not blocking a move either way. Over the past day it has traded between $4.35 and $5.93, sitting around the middle of it now. Participation is light at about 0.4x average volume. Down 9.3% over 24 hours.
DYOR
$PROM #TechnicalAnalysis
Price is $4.93 and $PROM remains below the averages that capped it earlier. $4.30 on the low side and $6.70 on the high side have contained the last two months. Price is down in the lower third of that range. The floor is 12.8% away and the ceiling is nowhere close. The 20 crossed below the 50 recently, for only 1 candles, so this leg is still young. RSI at 45 is neutral, so momentum is not blocking a move either way. Over the past day it has traded between $4.35 and $5.93, sitting around the middle of it now. Participation is light at about 0.4x average volume. Down 9.3% over 24 hours.
DYOR
$PROM #TechnicalAnalysis
9

·
--
$PEPE - clean structure into today's session
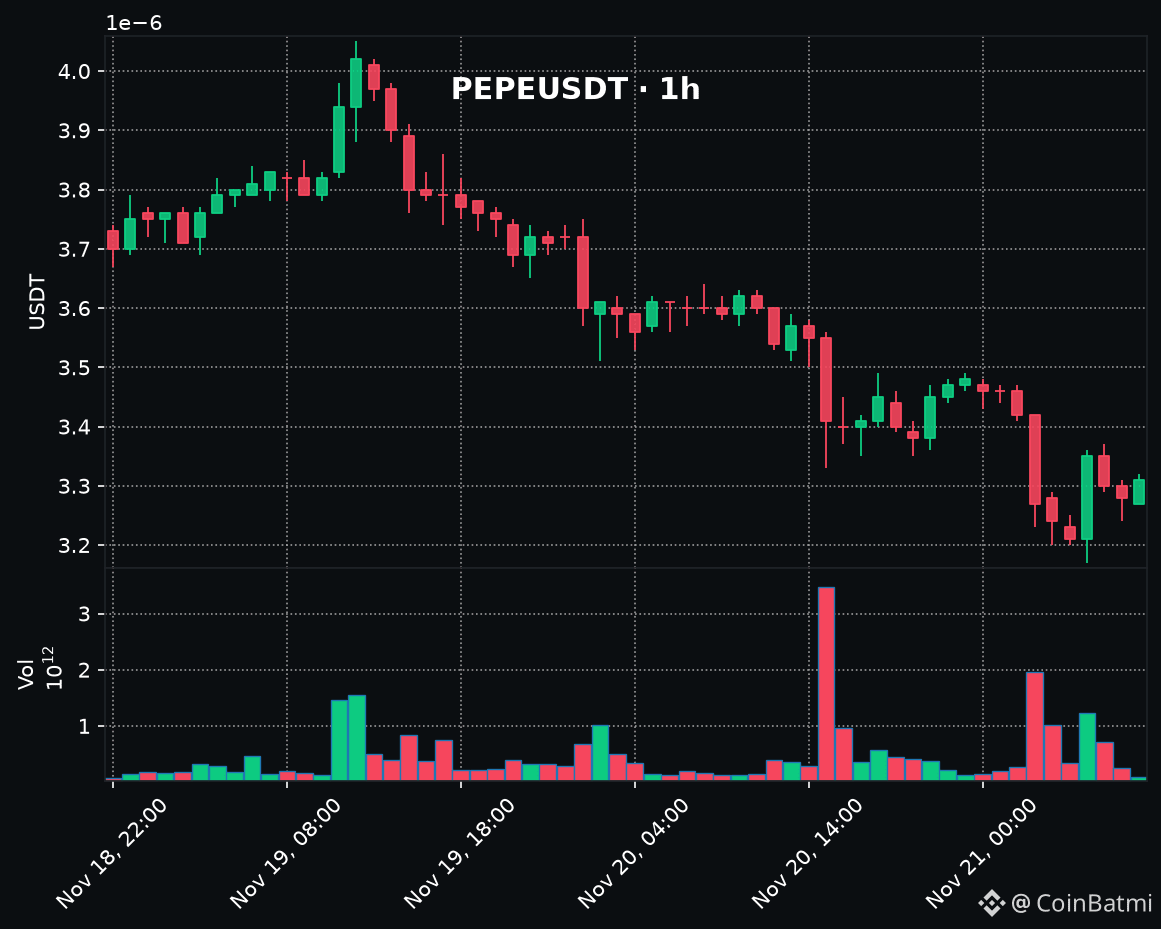
1h · RSI 44 · price 0.00000332 USDT (-7.5%)
Support: 0.00000317 USDT
Resistance: 0.00000349 USDT
24h range: 0.00000317 USDT - 0.00000363 USDT
Invalidation: a 1h close above 0.00000349 USDT.
Hold of 0.00000317 USDT keeps the bias intact. Lose it and the picture flips.
Which level are you watching closest on PEPE today?
#TechnicalAnalysis #PEPE
$PEPE - clean structure into today's session
1h · RSI 44 · price 0.00000332 USDT (-7.5%)
Support: 0.00000317 USDT
Resistance: 0.00000349 USDT
24h range: 0.00000317 USDT - 0.00000363 USDT
Invalidation: a 1h close above 0.00000349 USDT.
Hold of 0.00000317 USDT keeps the bias intact. Lose it and the picture flips.
Which level are you watching closest on PEPE today?
#TechnicalAnalysis #PEPE
1h · RSI 44 · price 0.00000332 USDT (-7.5%)
Support: 0.00000317 USDT
Resistance: 0.00000349 USDT
24h range: 0.00000317 USDT - 0.00000363 USDT
Invalidation: a 1h close above 0.00000349 USDT.
Hold of 0.00000317 USDT keeps the bias intact. Lose it and the picture flips.
Which level are you watching closest on PEPE today?
#TechnicalAnalysis #PEPE
14
·
--
Why is $SUI failing to reclaim its previous momentum? 🧐
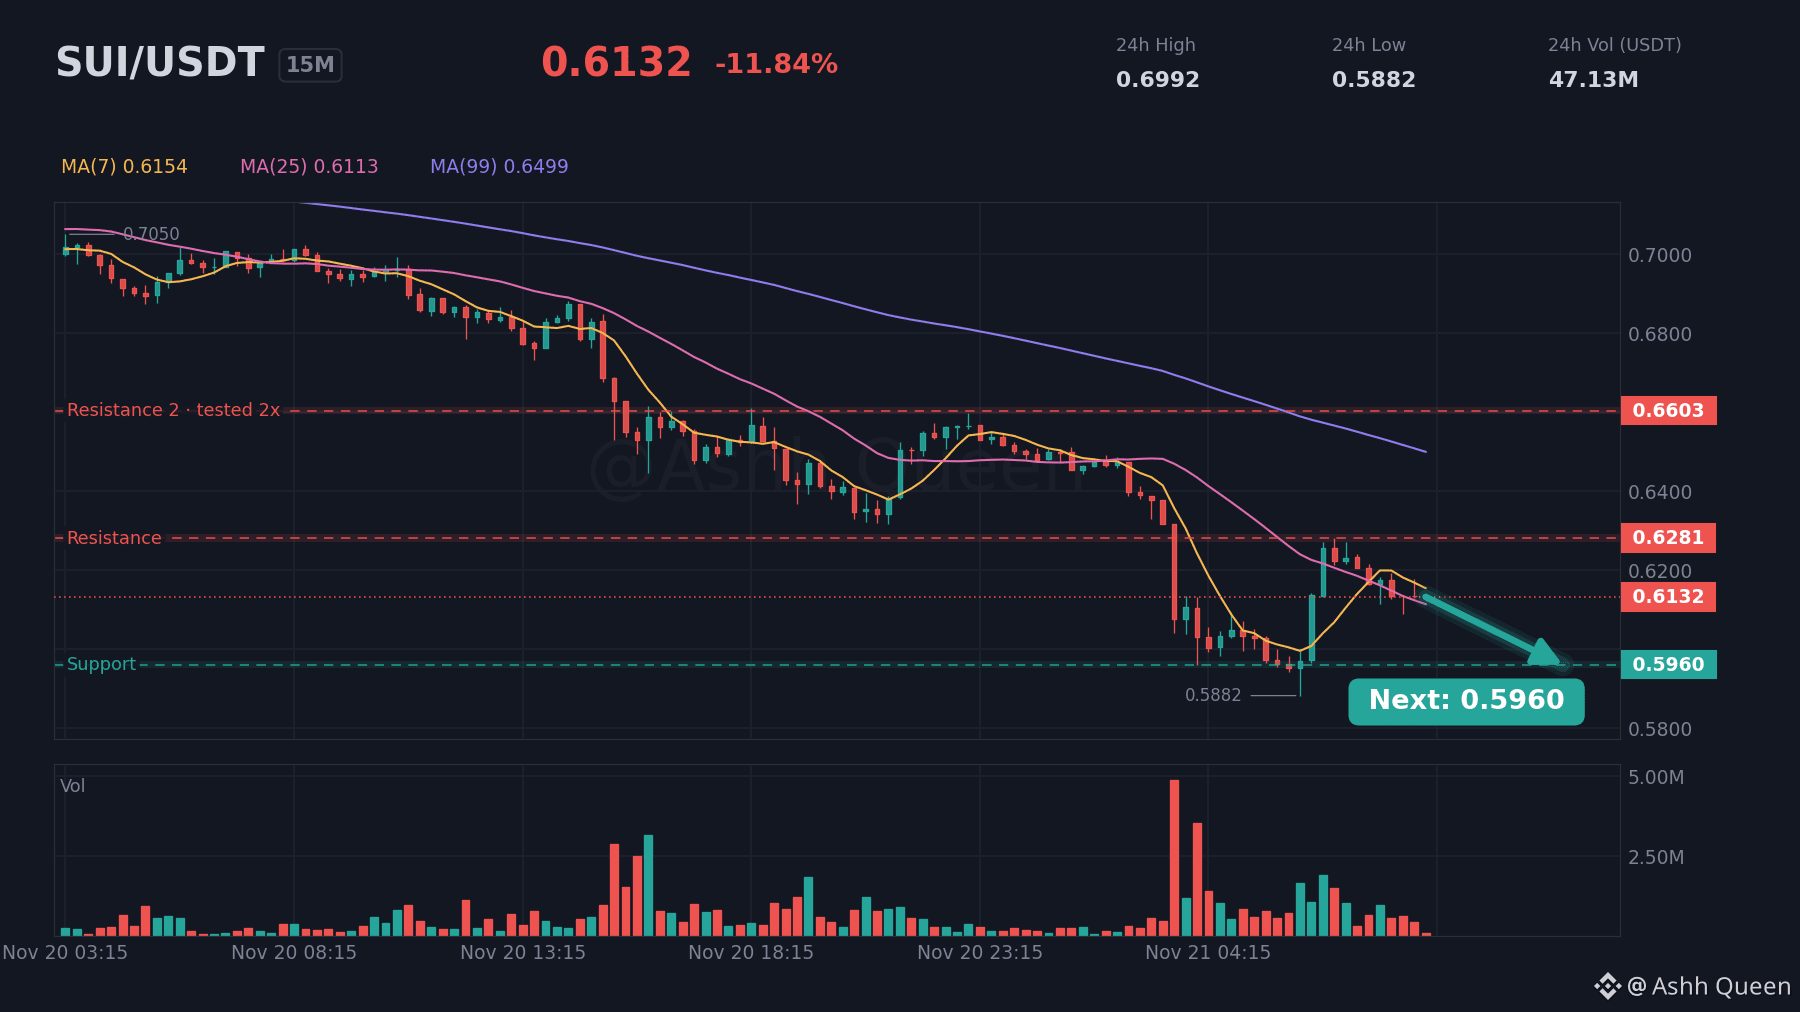
The market is showing a mild bearish lean as the price struggles under key hurdles. I am watching how the price interacts with these specific levels to determine if the current downward pressure will hold.
- Next resistance at 0.6603
- Resistance at 0.6281
- Price now at 0.6133
- Support at 0.5960
The data leans toward the sellers. A break below support at 0.5960 would confirm the bearish bias. ⚠️
Are you expecting a recovery or a deeper test? 🛡️
#SUI #Layer1 #TechnicalAnalysis #BinanceSquare
DYOR. Size positions carefully and never trade with money you cannot afford to lose.
Why is $SUI failing to reclaim its previous momentum? 🧐
The market is showing a mild bearish lean as the price struggles under key hurdles. I am watching how the price interacts with these specific levels to determine if the current downward pressure will hold.
- Next resistance at 0.6603
- Resistance at 0.6281
- Price now at 0.6133
- Support at 0.5960
The data leans toward the sellers. A break below support at 0.5960 would confirm the bearish bias. ⚠️
Are you expecting a recovery or a deeper test? 🛡️
#SUI #Layer1 #TechnicalAnalysis #BinanceSquare
DYOR. Size positions carefully and never trade with money you cannot afford to lose.
The market is showing a mild bearish lean as the price struggles under key hurdles. I am watching how the price interacts with these specific levels to determine if the current downward pressure will hold.
- Next resistance at 0.6603
- Resistance at 0.6281
- Price now at 0.6133
- Support at 0.5960
The data leans toward the sellers. A break below support at 0.5960 would confirm the bearish bias. ⚠️
Are you expecting a recovery or a deeper test? 🛡️
#SUI #Layer1 #TechnicalAnalysis #BinanceSquare
DYOR. Size positions carefully and never trade with money you cannot afford to lose.
8

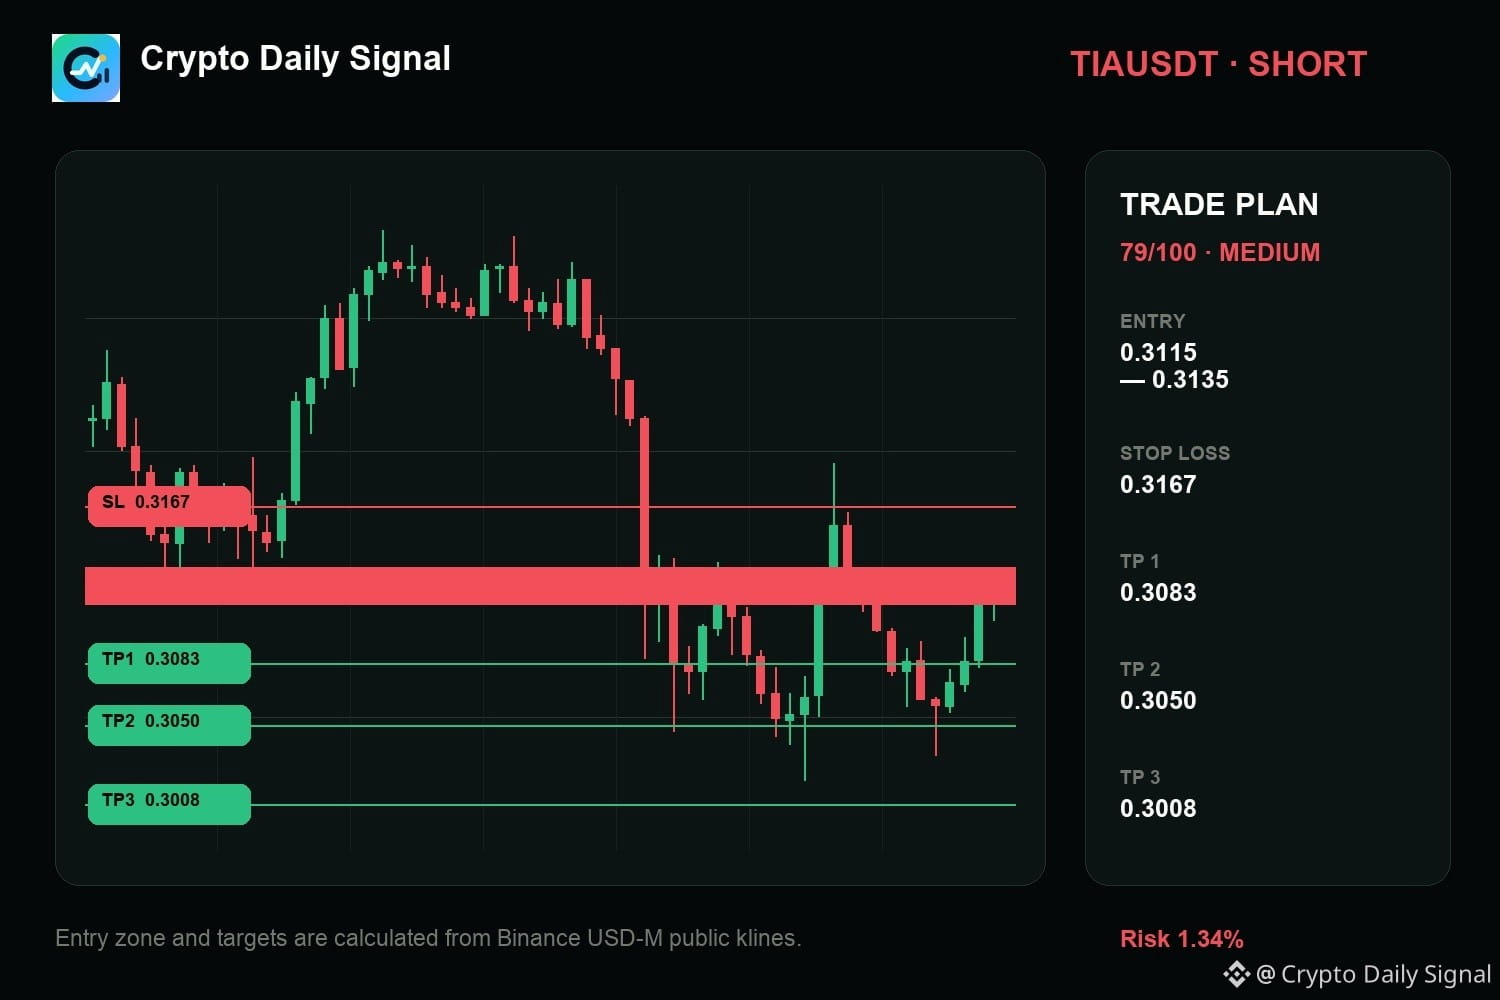
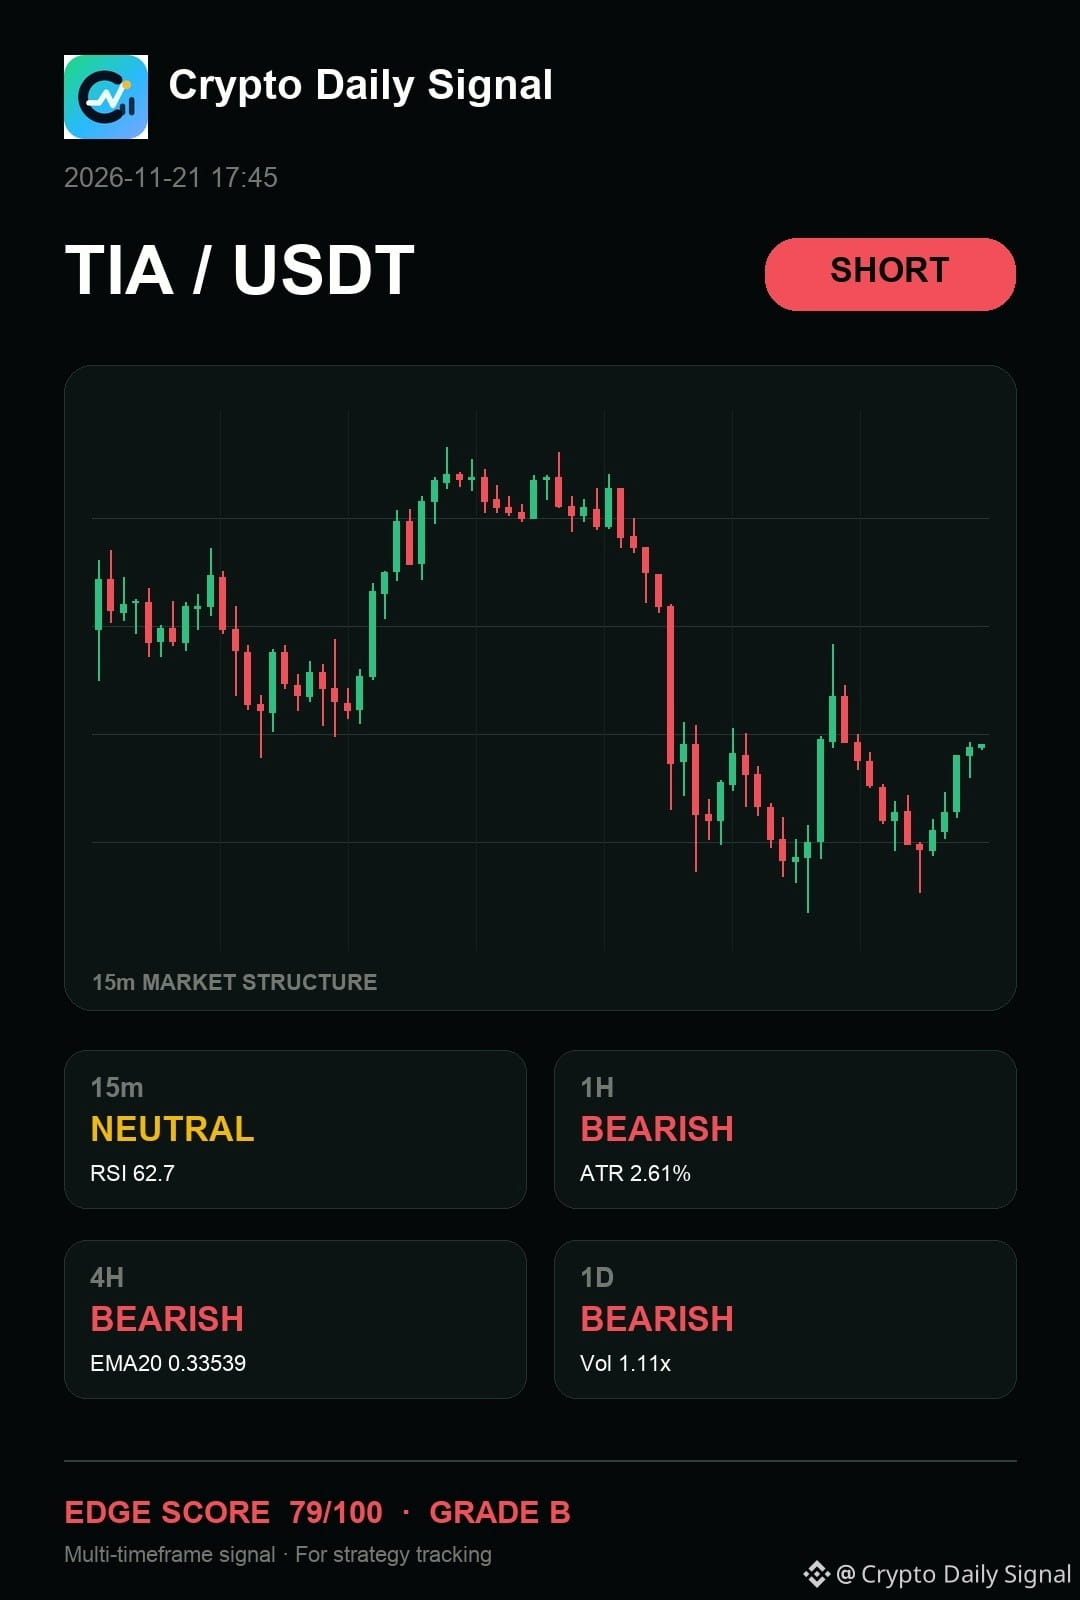
$TIA — right now, I would say it is still tilted toward sellers as the price stays boxed in by a descending channel across higher timeframes. The bearish structure holds up because the lower timeframe momentum isn't strong enough to break out. A confirmation of the downside needs a decisive break below the recent low point.
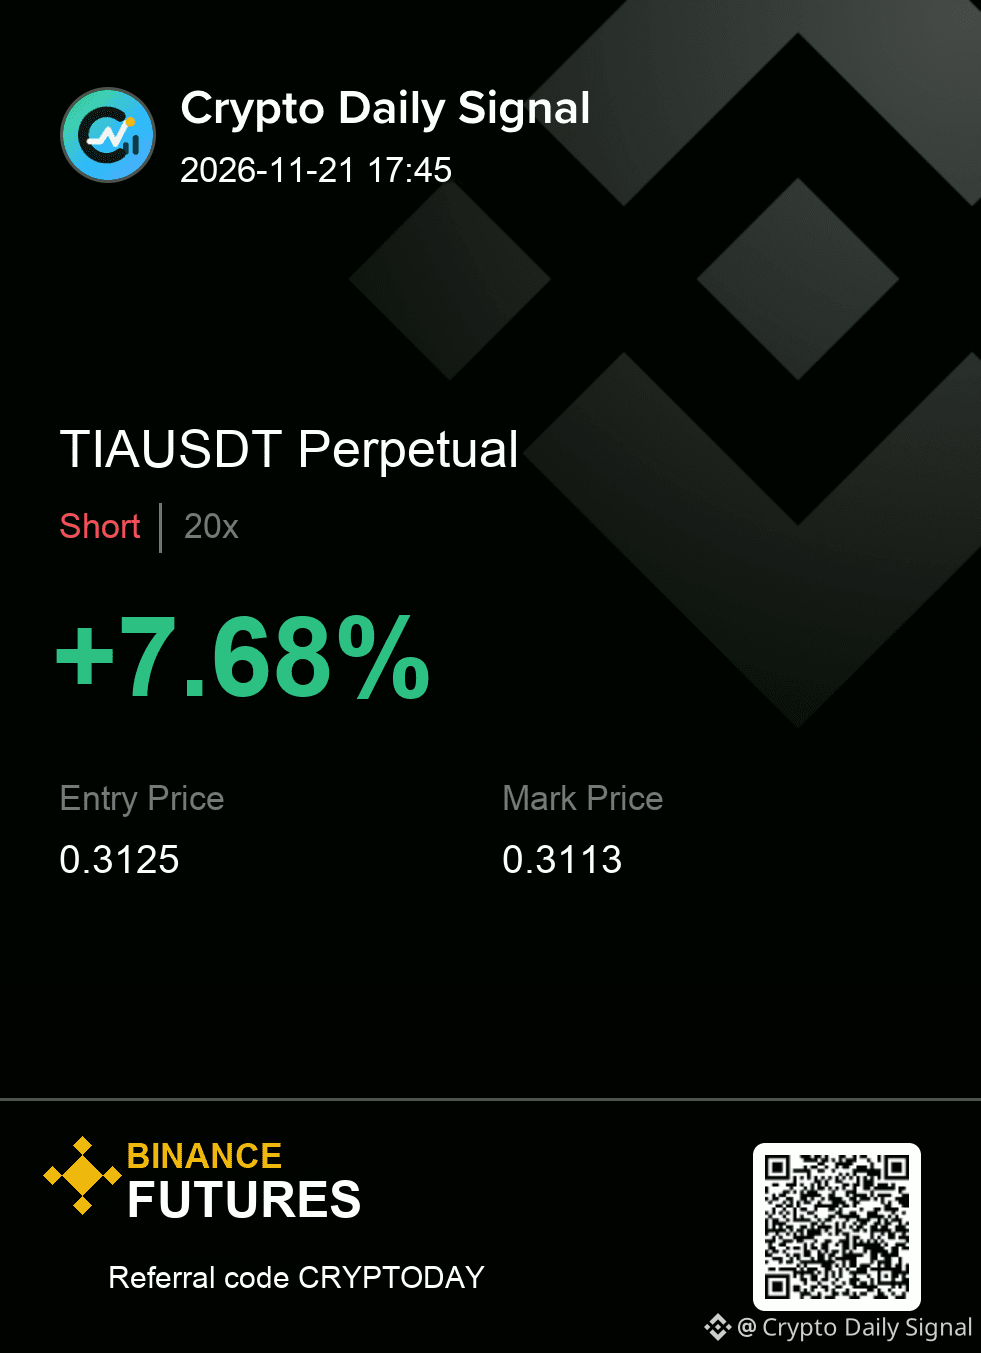
Trade Plan — TIAUSDT SHORT
Entry: 0.3115 - 0.3135
Stop Loss: 0.3167
TP1: 0.3083 | TP2: 0.3050 | TP3: 0.3008
Confirmation first or early entry — which side of that trade-off are you on?
#TechnicalAnalysis
{future}(TIAUSDT)
$TIA — right now, I would say it is still tilted toward sellers as the price stays boxed in by a descending channel across higher timeframes. The bearish structure holds up because the lower timeframe momentum isn't strong enough to break out. A confirmation of the downside needs a decisive break below the recent low point.
Trade Plan — TIAUSDT SHORT
Entry: 0.3115 - 0.3135
Stop Loss: 0.3167
TP1: 0.3083 | TP2: 0.3050 | TP3: 0.3008
Confirmation first or early entry — which side of that trade-off are you on?
#TechnicalAnalysis
Trade Plan — TIAUSDT SHORT
Entry: 0.3115 - 0.3135
Stop Loss: 0.3167
TP1: 0.3083 | TP2: 0.3050 | TP3: 0.3008
Confirmation first or early entry — which side of that trade-off are you on?
#TechnicalAnalysis
3

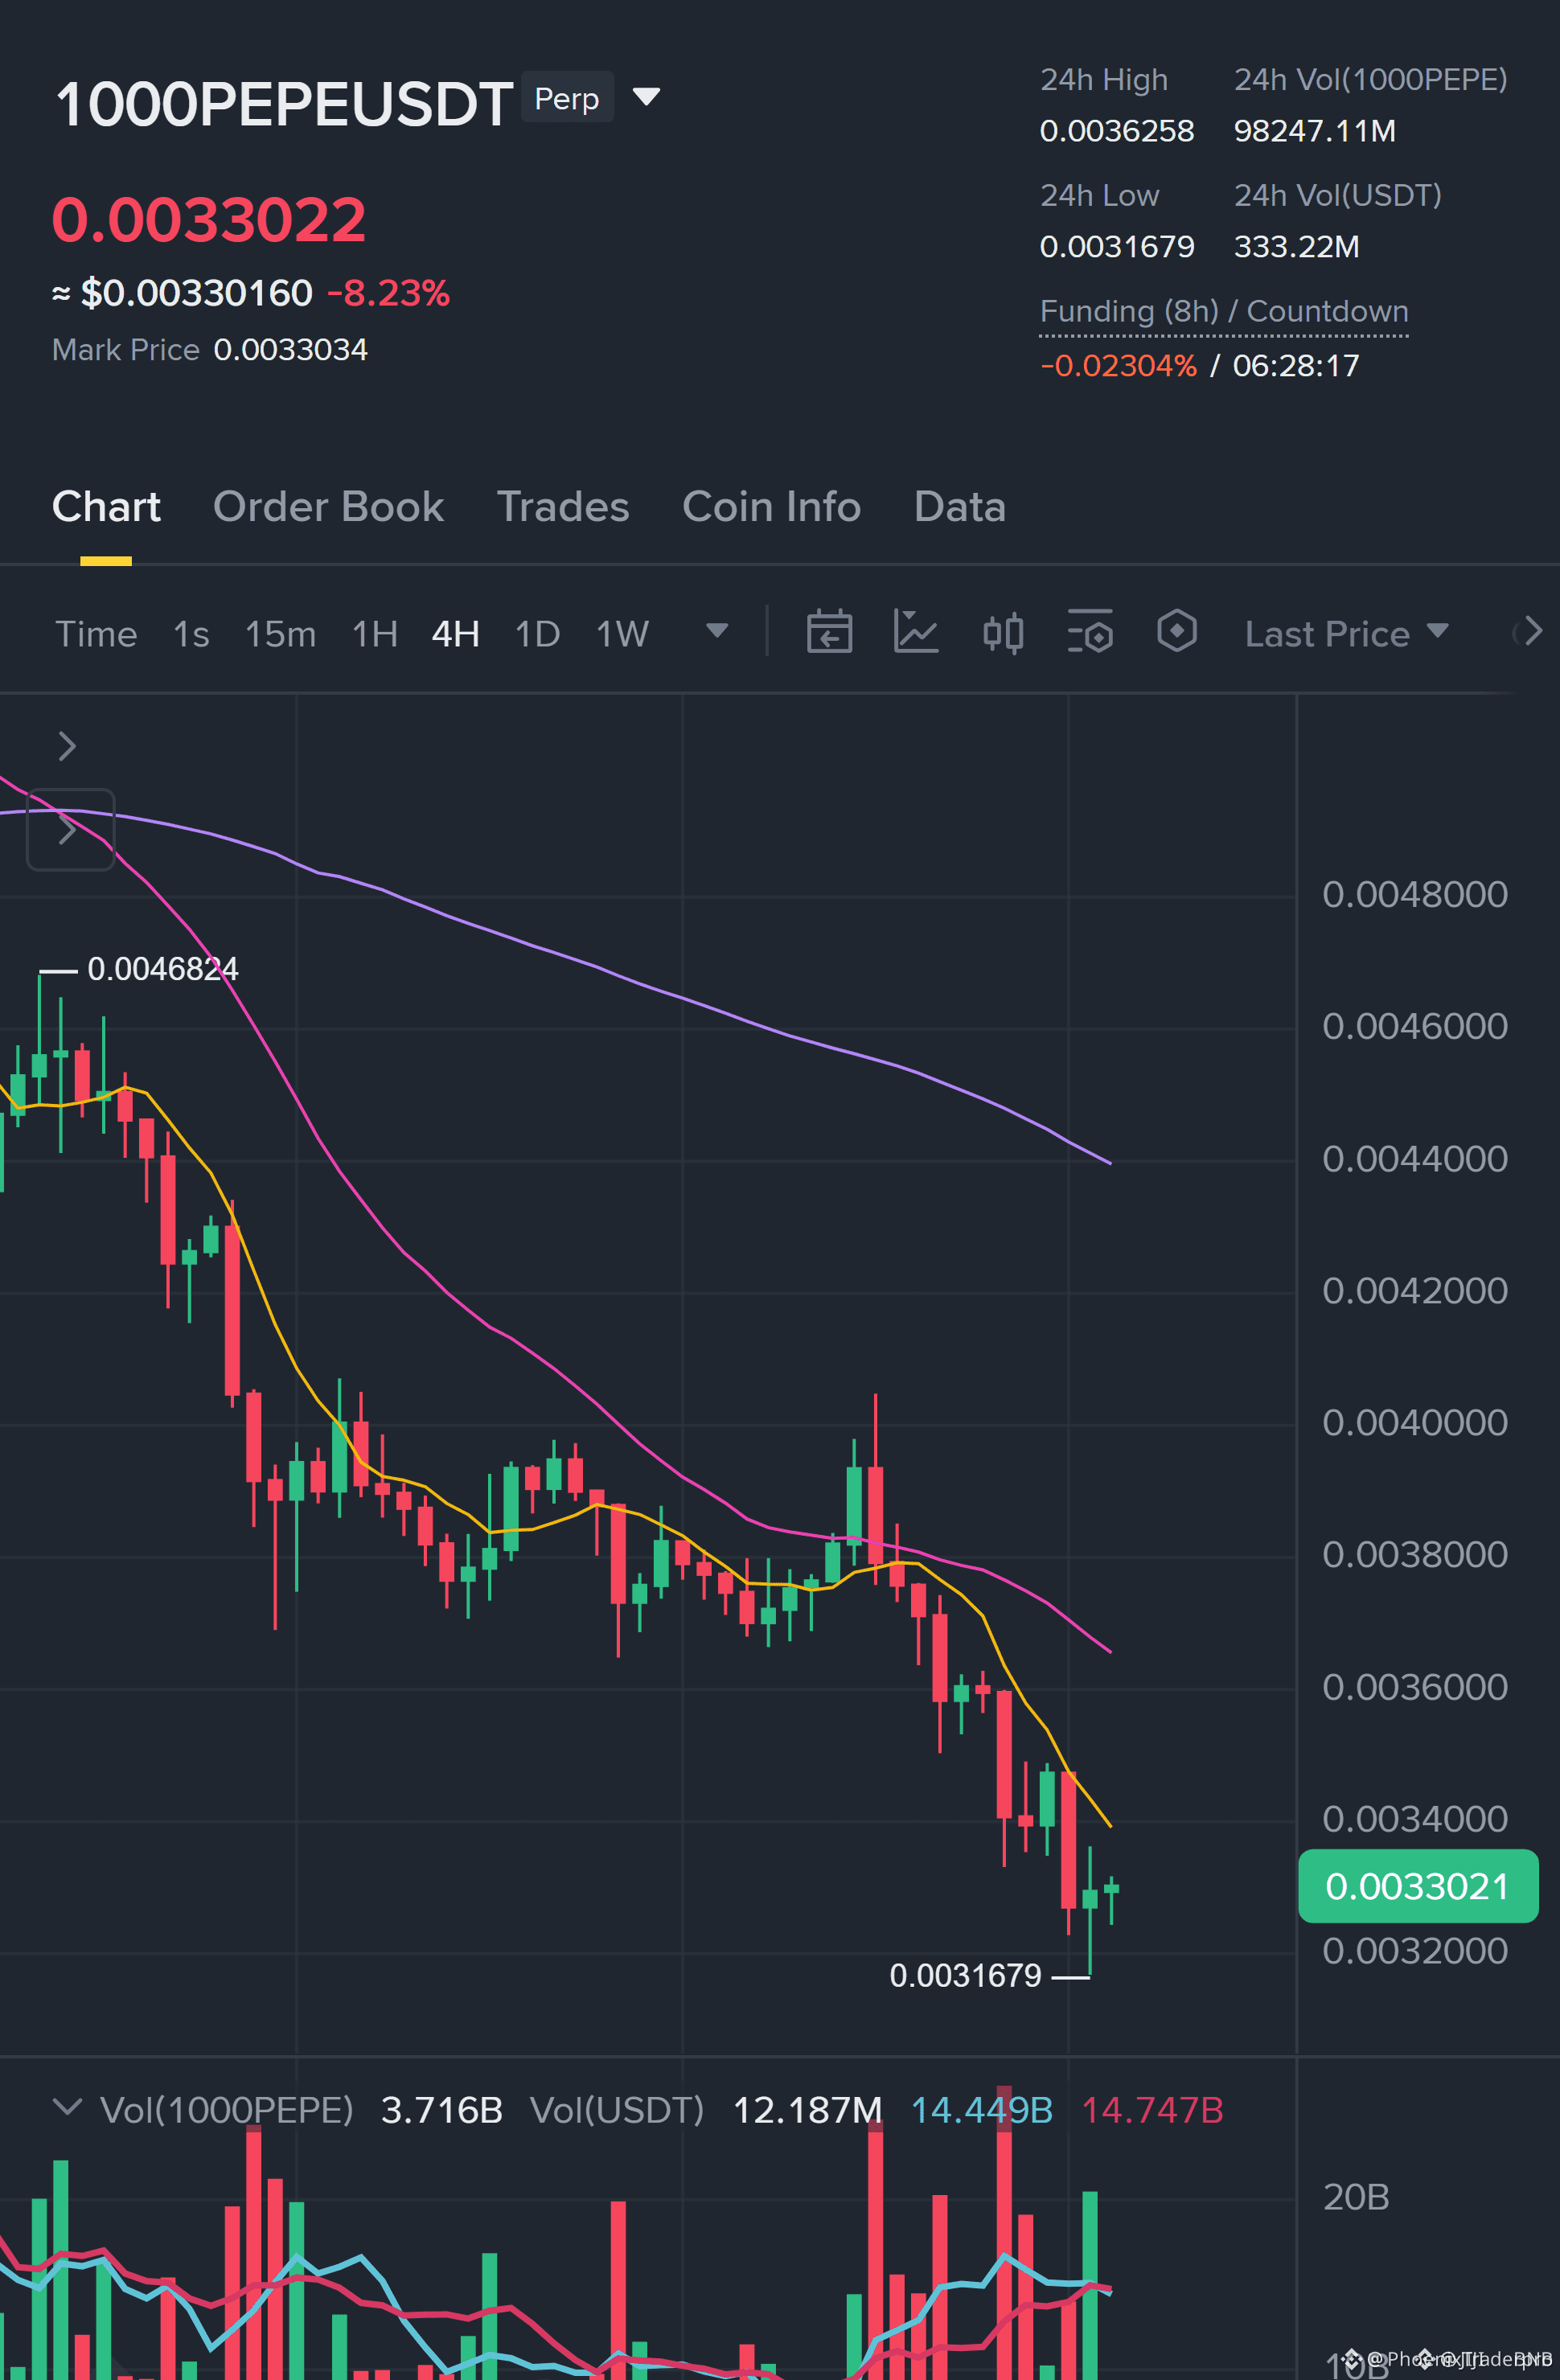
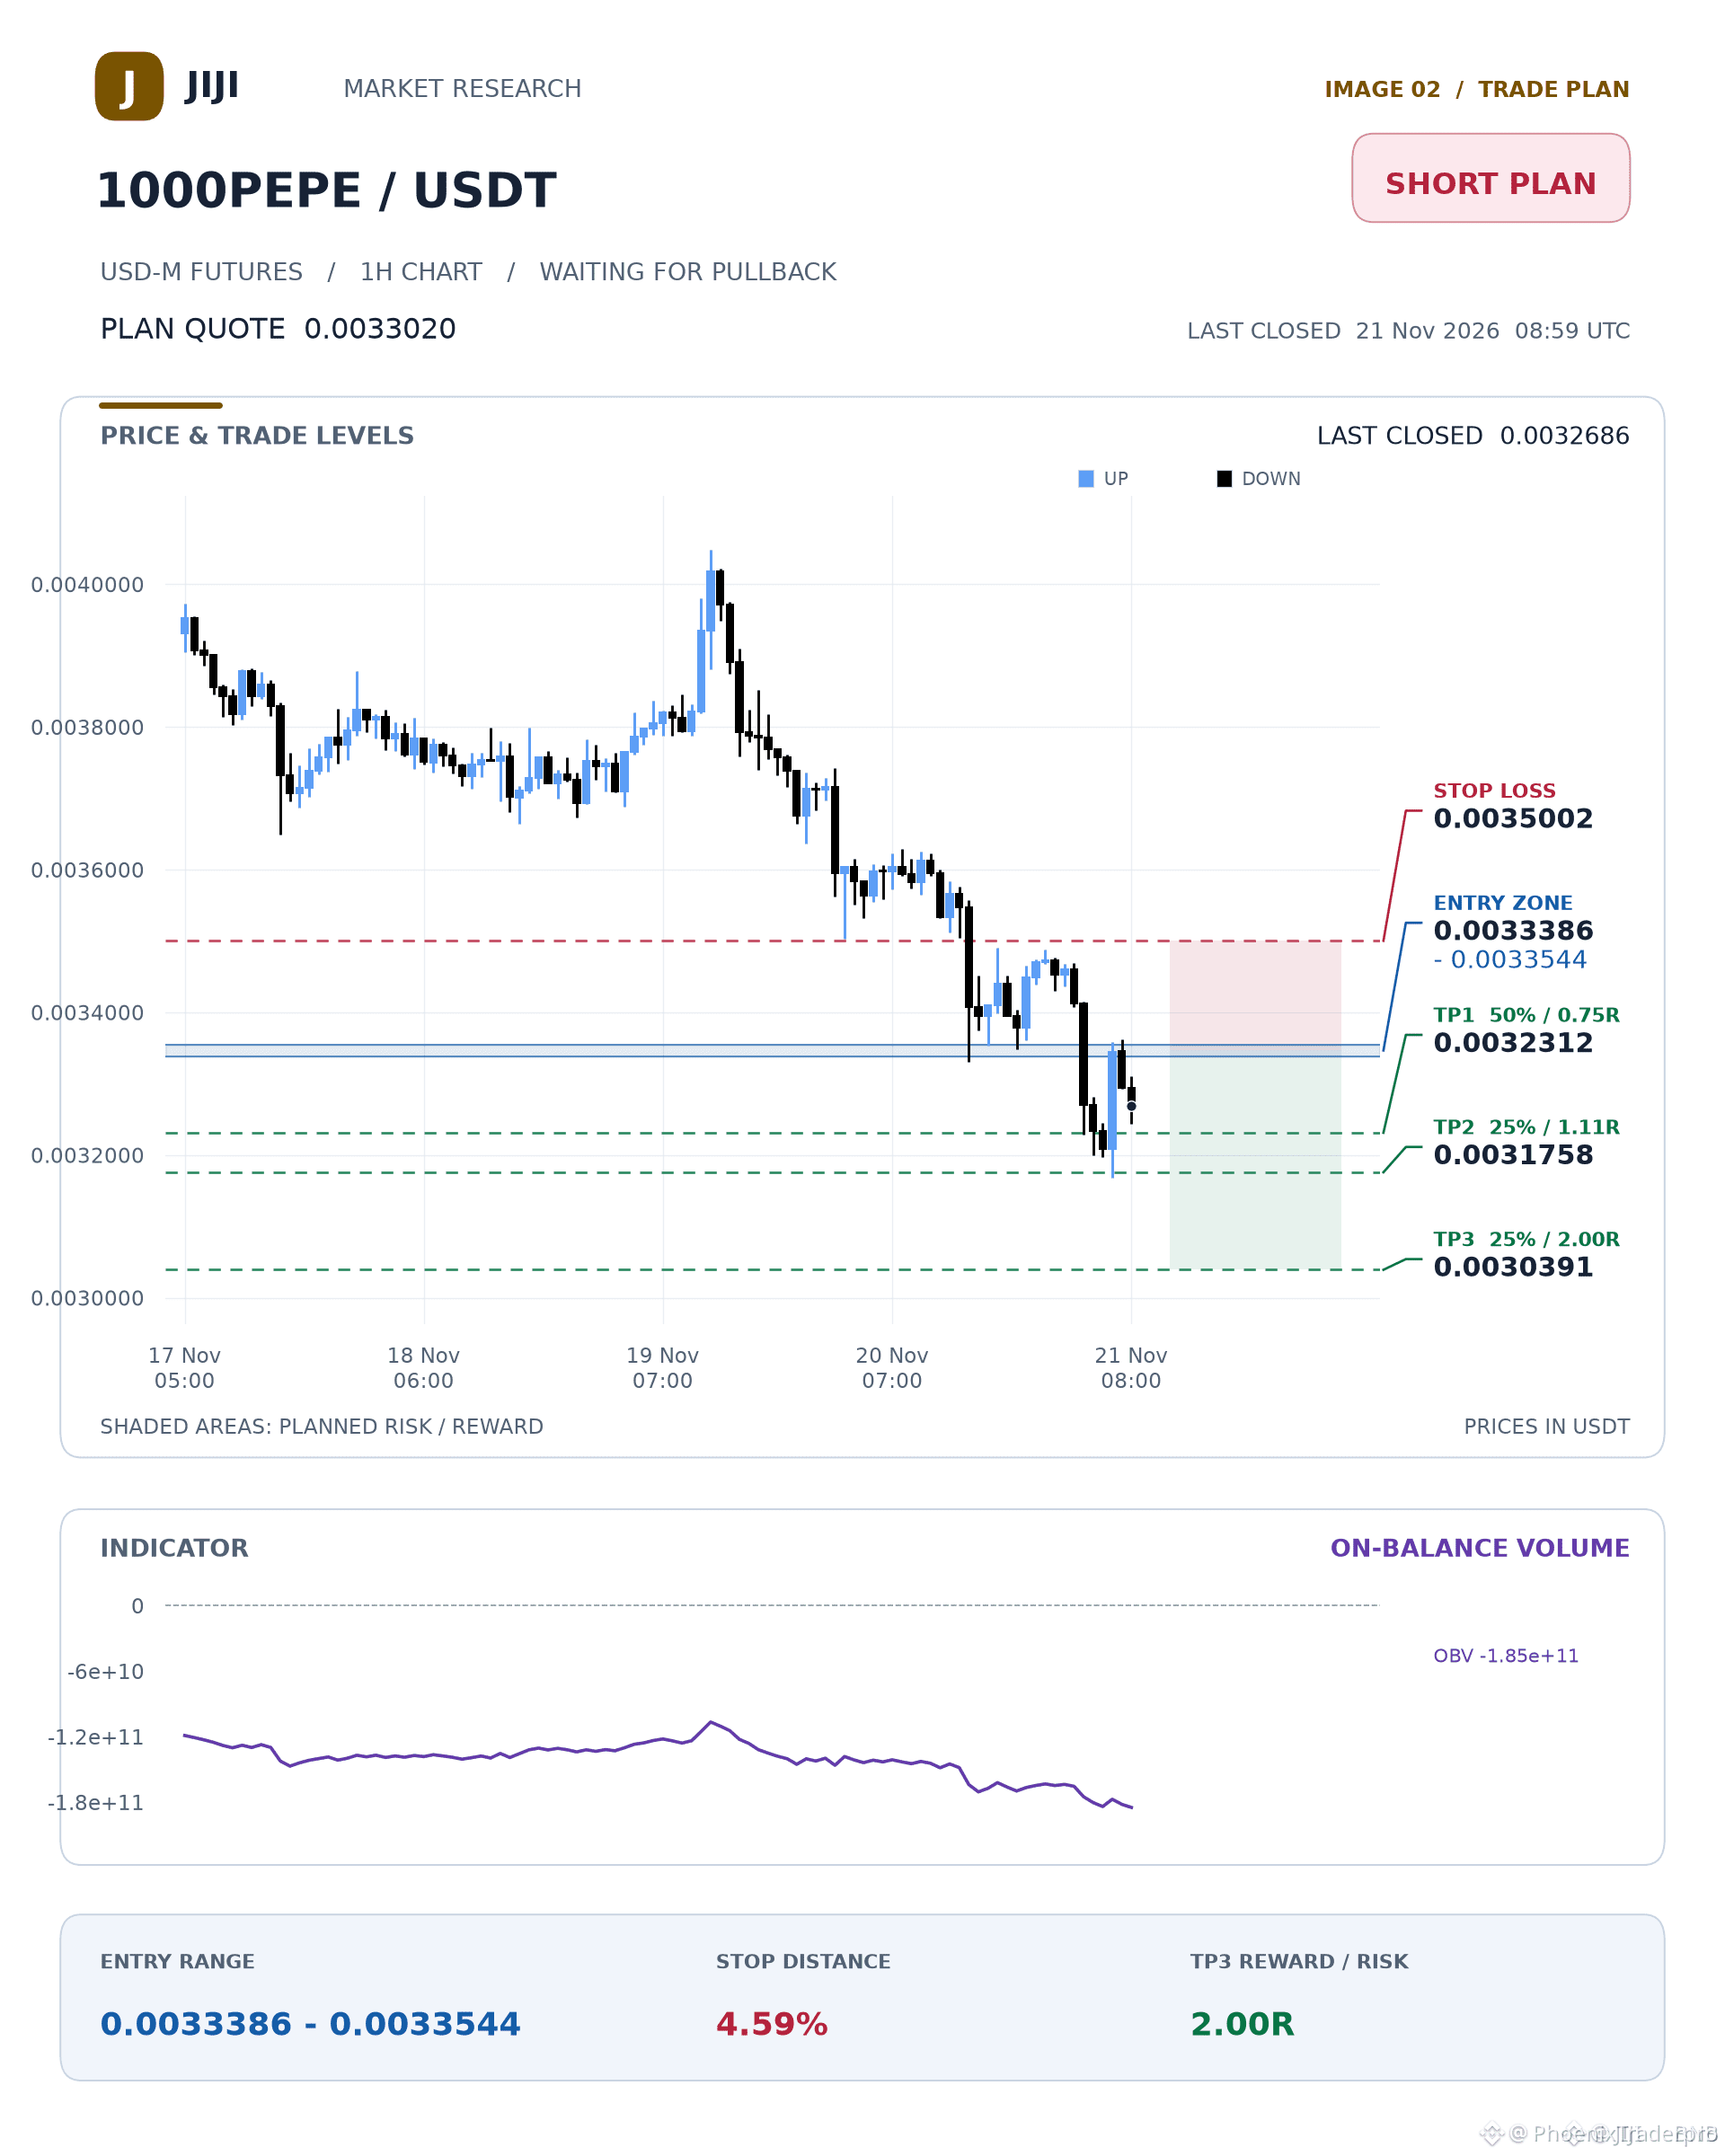
🔴 $1000PEPE BEARISH EMA STACK SIGNALS A DEEP PULLBACK READY TO UNWIND! 📉
Entry: 0.0033386 ⚡
Target: 0.0032312 🎯
Stop Loss: 0.0035002 ⚠️
The 4-hour chart prints a clean bearish EMA stack while the 1-hour RSI lingers at 35.6, showing heavy distribution pressure. We are watching for a measured pullback into the zone to front-run the next leg down. 📊
ADX strength metrics confirm seller dominance is far from exhausted despite short-term extension. Discipline dictates waiting for the exact retest rather than chasing moving price action. 🔍
💬 Are you positioning for this downside continuation or waiting for a reclaim above resistance? 👇
⚠️ Not financial advice. Always manage your risk. 🛡️
🏷️ #1000PEPE #ShortSetup #CryptoTrading #TechnicalAnalysis
🐻 📉
🔴 $1000PEPE BEARISH EMA STACK SIGNALS A DEEP PULLBACK READY TO UNWIND! 📉
Entry: 0.0033386 ⚡
Target: 0.0032312 🎯
Stop Loss: 0.0035002 ⚠️
The 4-hour chart prints a clean bearish EMA stack while the 1-hour RSI lingers at 35.6, showing heavy distribution pressure. We are watching for a measured pullback into the zone to front-run the next leg down. 📊
ADX strength metrics confirm seller dominance is far from exhausted despite short-term extension. Discipline dictates waiting for the exact retest rather than chasing moving price action. 🔍
💬 Are you positioning for this downside continuation or waiting for a reclaim above resistance? 👇
⚠️ Not financial advice. Always manage your risk. 🛡️
🏷️ #1000PEPE #ShortSetup #CryptoTrading #TechnicalAnalysis
🐻 📉
Entry: 0.0033386 ⚡
Target: 0.0032312 🎯
Stop Loss: 0.0035002 ⚠️
The 4-hour chart prints a clean bearish EMA stack while the 1-hour RSI lingers at 35.6, showing heavy distribution pressure. We are watching for a measured pullback into the zone to front-run the next leg down. 📊
ADX strength metrics confirm seller dominance is far from exhausted despite short-term extension. Discipline dictates waiting for the exact retest rather than chasing moving price action. 🔍
💬 Are you positioning for this downside continuation or waiting for a reclaim above resistance? 👇
⚠️ Not financial advice. Always manage your risk. 🛡️
🏷️ #1000PEPE #ShortSetup #CryptoTrading #TechnicalAnalysis
🐻 📉
6
·
--
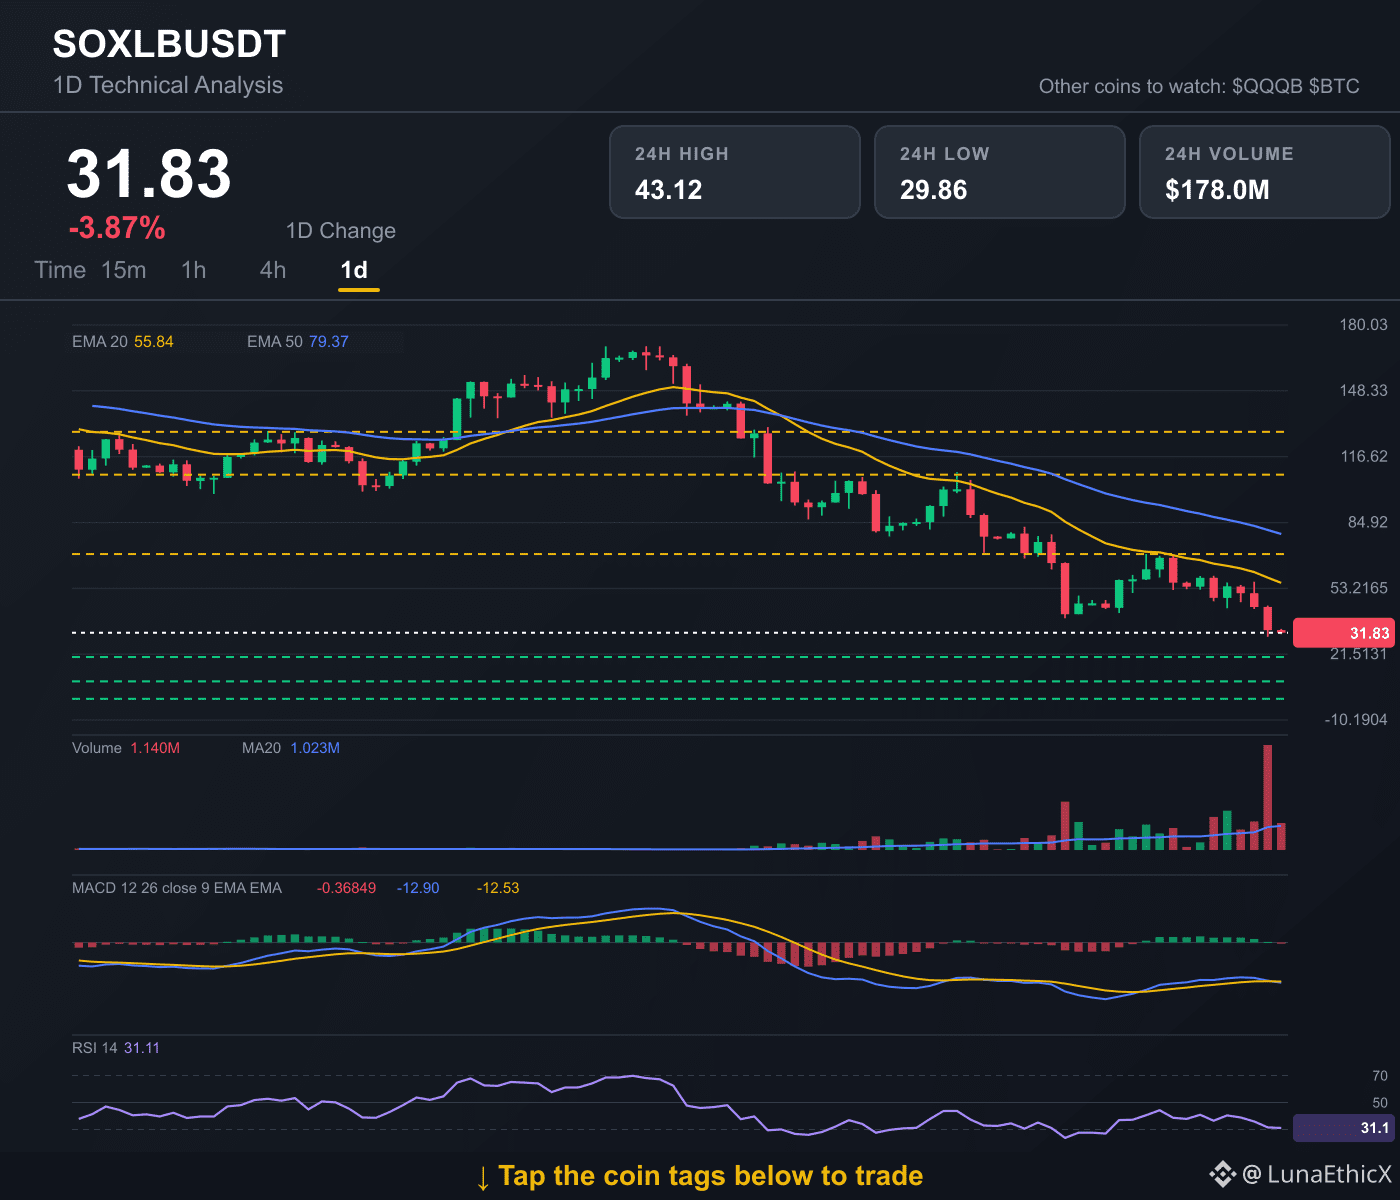
$SOXLB 1D BEARISH STRUCTURE IN FOCUS 🔍
At 31.83, price is trading under EMA20 55.8386 and EMA50 79.3658, leaving the structure under pressure. Momentum remains soft as RSI 31.11 combines with MACD -12.90098 below signal -12.53249. Upside hurdles are positioned near 69.71, 107.96 and 128.575. Downside cushions remain around 20.1263, 8.4226 and 0.
Watching how $QQQB and $BTC behave as well. 🔍
📊 See the live chart directly through the coin tags below.
#TechnicalAnalysis #CryptoAnalysis #BinanceSquare
$SOXLB $QQQB $BTC
$SOXLB 1D BEARISH STRUCTURE IN FOCUS 🔍
At 31.83, price is trading under EMA20 55.8386 and EMA50 79.3658, leaving the structure under pressure. Momentum remains soft as RSI 31.11 combines with MACD -12.90098 below signal -12.53249. Upside hurdles are positioned near 69.71, 107.96 and 128.575. Downside cushions remain around 20.1263, 8.4226 and 0.
Watching how $QQQB and $BTC behave as well. 🔍
📊 See the live chart directly through the coin tags below.
#TechnicalAnalysis #CryptoAnalysis #BinanceSquare
$SOXLB $QQQB $BTC
At 31.83, price is trading under EMA20 55.8386 and EMA50 79.3658, leaving the structure under pressure. Momentum remains soft as RSI 31.11 combines with MACD -12.90098 below signal -12.53249. Upside hurdles are positioned near 69.71, 107.96 and 128.575. Downside cushions remain around 20.1263, 8.4226 and 0.
Watching how $QQQB and $BTC behave as well. 🔍
📊 See the live chart directly through the coin tags below.
#TechnicalAnalysis #CryptoAnalysis #BinanceSquare
$SOXLB $QQQB $BTC
2
Log in to explore more content
Join global crypto users on Binance Square
⚡️ Get latest and useful information about crypto.
💬 Trusted by the world’s largest crypto exchange.
👍 Discover real insights from verified creators.
Email / Phone number
Trending Topics
1
#CanBTCReboundAfterFallingBelow60K?
365,279 views
1,528 Discussing
2
#GlobalStocksFaceLongestLosingStreakSince2023
120,655 views
1,088 Discussing
3
#BlackRockIBITPostsRecord$541MSingleDayOutflow
648 views
17 Discussing
4
#AnthropicPlungesTowardIPOPriceonDay2
58,140 views
588 Discussing
5
#TwentyOneCapitalAdds172.25BTC
10,865 views
161 Discussing
6
#HKBillWouldExcludeTokenizedDepositsFromVirtualAssets
924 views
14 Discussing
7
#BNBDropsBelow540USDTWith8.46%DailyDecline
31,527 views
270 Discussing
8
#HKBillProposesHK$100KFineForUnauthorizedCryptoTitles
1,033 views
14 Discussing
9
#BitMineFaces$10.1BUnrealizedETHLoss
1,985 views
18 Discussing
10
#StrategyReports$35BNetReserves
1,867 views
18 Discussing