
#technicalanalys
technicalanalys
110,705 views
448 Discussing
Hot
Latest

·
--
Bearish
$SOL
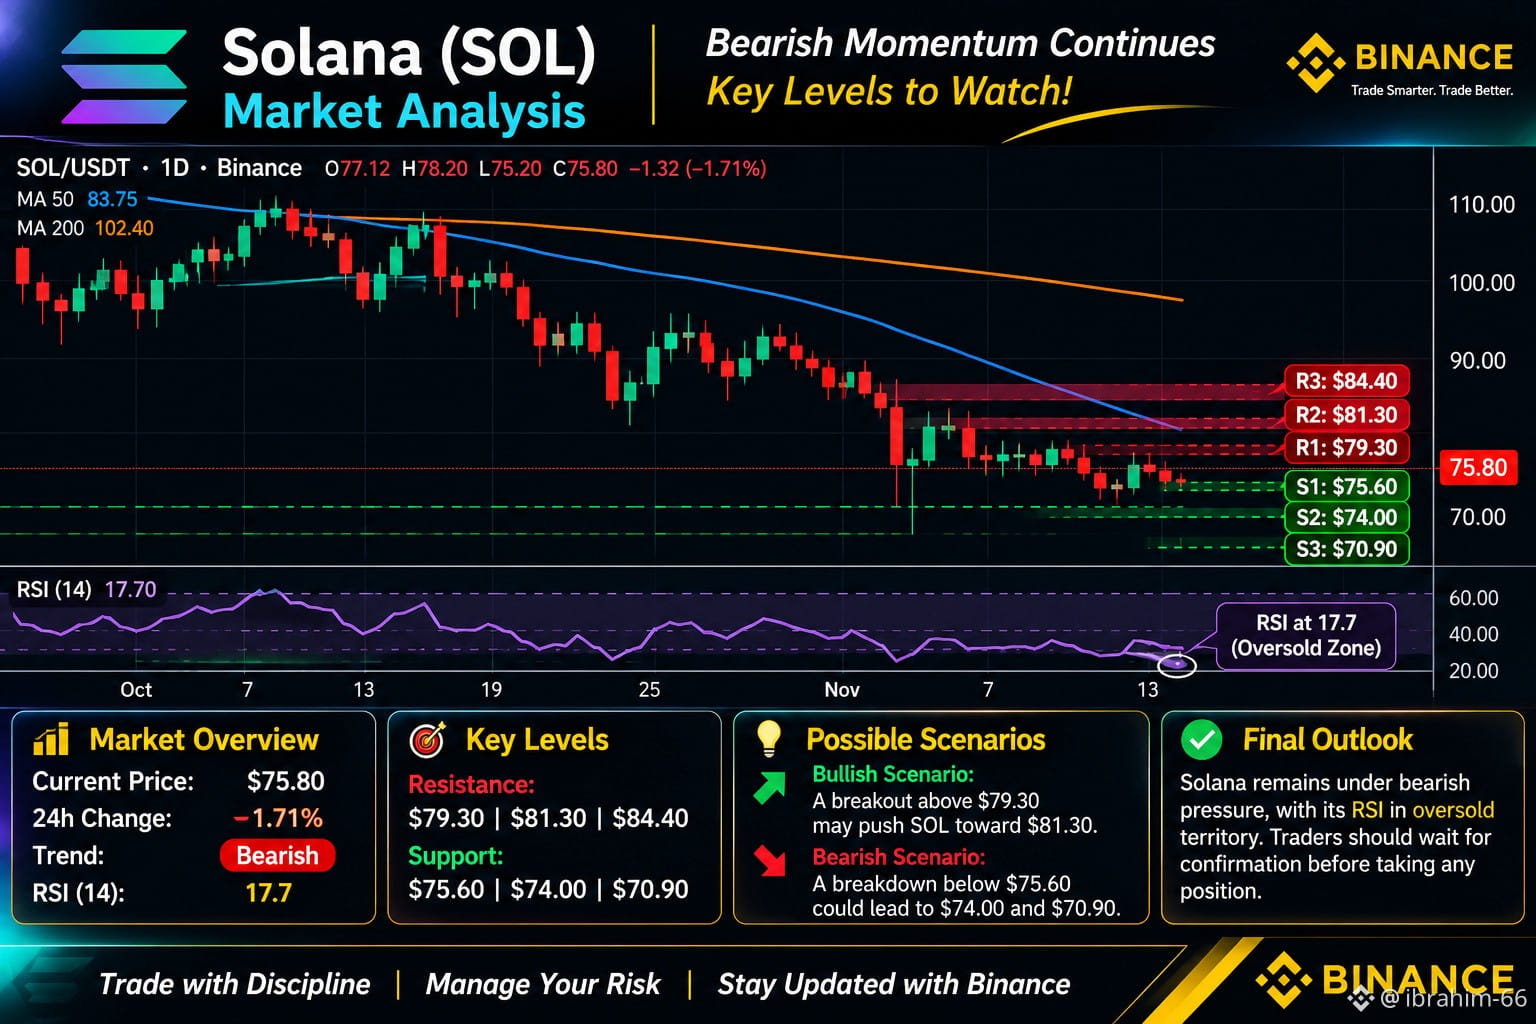
Solana (SOL) Market Analysis | November 14, 2026
SOL Faces Selling Pressure as Bearish Momentum Strengthens
Solana continues to experience significant downside pressure, with its daily chart reflecting a strong bearish market structure. Recent price action suggests that sellers remain dominant, while buyers are struggling to establish a convincing recovery.
📊 Market Overview
Current Price: Approximately $75.80
Daily Trend: Bearish
RSI (14): Approximately 17.7
Market Momentum: Strong selling pressure
Volatility: Elevated
SOL is currently trading in an oversold region, which may create conditions for a temporary rebound. However, oversold conditions alone are not sufficient confirmation of a trend reversal.
🔍 Technical Analysis
Solana's daily structure continues to show lower highs and lower lows, reflecting persistent bearish momentum.
The price remains below key moving averages, suggesting that the broader trend is still under pressure.
🎯 Key Levels to Watch
🔴 Resistance Levels
$79.30
$81.30
$84.40
🟢 Support Levels
$75.60
$74.00
$70.90
These levels represent technical reference zones rather than guaranteed price reactions.
📈 Possible Market Scenarios
Bullish Scenario:
A strong recovery above $79.30 could improve short-term momentum and potentially open the way toward $81.30.
Bearish Scenario:
A confirmed breakdown below $75.60 may increase downside pressure, bringing $74.00 and potentially $70.90 into focus.
🧠 Analyst's Perspective
Solana remains bearish on the daily timeframe. Although its oversold RSI suggests that a relief rally is possible, buyers need to demonstrate strength before a bullish reversal can be considered credible.
For now, confirmation and disciplined risk management remain essential.
Final Thoughts
The crypto market rewards patience, not impulsive decisions. Watching price action, volume, and market structure can help traders avoid emotional entries.
📉 Stay disciplined. Protect your capital. Trade with a plan.
#Solana #TechnicalAnalys #CryptoMarket #TradingStrategy
{future}(SOLUSDT)
$SOL
Solana (SOL) Market Analysis | November 14, 2026
SOL Faces Selling Pressure as Bearish Momentum Strengthens
Solana continues to experience significant downside pressure, with its daily chart reflecting a strong bearish market structure. Recent price action suggests that sellers remain dominant, while buyers are struggling to establish a convincing recovery.
📊 Market Overview
Current Price: Approximately $75.80
Daily Trend: Bearish
RSI (14): Approximately 17.7
Market Momentum: Strong selling pressure
Volatility: Elevated
SOL is currently trading in an oversold region, which may create conditions for a temporary rebound. However, oversold conditions alone are not sufficient confirmation of a trend reversal.
🔍 Technical Analysis
Solana's daily structure continues to show lower highs and lower lows, reflecting persistent bearish momentum.
The price remains below key moving averages, suggesting that the broader trend is still under pressure.
🎯 Key Levels to Watch
🔴 Resistance Levels
$79.30
$81.30
$84.40
🟢 Support Levels
$75.60
$74.00
$70.90
These levels represent technical reference zones rather than guaranteed price reactions.
📈 Possible Market Scenarios
Bullish Scenario:
A strong recovery above $79.30 could improve short-term momentum and potentially open the way toward $81.30.
Bearish Scenario:
A confirmed breakdown below $75.60 may increase downside pressure, bringing $74.00 and potentially $70.90 into focus.
🧠 Analyst's Perspective
Solana remains bearish on the daily timeframe. Although its oversold RSI suggests that a relief rally is possible, buyers need to demonstrate strength before a bullish reversal can be considered credible.
For now, confirmation and disciplined risk management remain essential.
Final Thoughts
The crypto market rewards patience, not impulsive decisions. Watching price action, volume, and market structure can help traders avoid emotional entries.
📉 Stay disciplined. Protect your capital. Trade with a plan.
#Solana #TechnicalAnalys #CryptoMarket #TradingStrategy
Solana (SOL) Market Analysis | November 14, 2026
SOL Faces Selling Pressure as Bearish Momentum Strengthens
Solana continues to experience significant downside pressure, with its daily chart reflecting a strong bearish market structure. Recent price action suggests that sellers remain dominant, while buyers are struggling to establish a convincing recovery.
📊 Market Overview
Current Price: Approximately $75.80
Daily Trend: Bearish
RSI (14): Approximately 17.7
Market Momentum: Strong selling pressure
Volatility: Elevated
SOL is currently trading in an oversold region, which may create conditions for a temporary rebound. However, oversold conditions alone are not sufficient confirmation of a trend reversal.
🔍 Technical Analysis
Solana's daily structure continues to show lower highs and lower lows, reflecting persistent bearish momentum.
The price remains below key moving averages, suggesting that the broader trend is still under pressure.
🎯 Key Levels to Watch
🔴 Resistance Levels
$79.30
$81.30
$84.40
🟢 Support Levels
$75.60
$74.00
$70.90
These levels represent technical reference zones rather than guaranteed price reactions.
📈 Possible Market Scenarios
Bullish Scenario:
A strong recovery above $79.30 could improve short-term momentum and potentially open the way toward $81.30.
Bearish Scenario:
A confirmed breakdown below $75.60 may increase downside pressure, bringing $74.00 and potentially $70.90 into focus.
🧠 Analyst's Perspective
Solana remains bearish on the daily timeframe. Although its oversold RSI suggests that a relief rally is possible, buyers need to demonstrate strength before a bullish reversal can be considered credible.
For now, confirmation and disciplined risk management remain essential.
Final Thoughts
The crypto market rewards patience, not impulsive decisions. Watching price action, volume, and market structure can help traders avoid emotional entries.
📉 Stay disciplined. Protect your capital. Trade with a plan.
#Solana #TechnicalAnalys #CryptoMarket #TradingStrategy
66

·
--
🚨 $ANKR
{spot}(ANKRUSDT)
Oversold Signals Flash — Is a Relief Bounce Near?
📉 TREND: BEARISH (4H + DAILY + WEEKLY)
💰 Price: $0.003510
🔴 24H: -4.36%
📊 RSI: 33.7
⚠️ Warning Signals
- 18 technical indicators are bearish.
- Price is below all 8 major moving averages.
- Selling pressure remains strong.
📍 Key Levels
- Support: $0.003419
- Major Support: $0.003270
- Resistance: $0.003569
🟢 Above $0.003569 → Recovery attempt.
🔴 Below $0.003419 → Further downside risk.
MY VIEW: Bears dominate, but an oversold bounce is possible. Wait for confirmation.
🔥 BOUNCE OR ANOTHER DROP?
#ankr #crypto #altcoins #TechnicalAnalys
🚨 $ANKR
Oversold Signals Flash — Is a Relief Bounce Near?
📉 TREND: BEARISH (4H + DAILY + WEEKLY)
💰 Price: $0.003510
🔴 24H: -4.36%
📊 RSI: 33.7
⚠️ Warning Signals
- 18 technical indicators are bearish.
- Price is below all 8 major moving averages.
- Selling pressure remains strong.
📍 Key Levels
- Support: $0.003419
- Major Support: $0.003270
- Resistance: $0.003569
🟢 Above $0.003569 → Recovery attempt.
🔴 Below $0.003419 → Further downside risk.
MY VIEW: Bears dominate, but an oversold bounce is possible. Wait for confirmation.
🔥 BOUNCE OR ANOTHER DROP?
#ankr #crypto #altcoins #TechnicalAnalys
Oversold Signals Flash — Is a Relief Bounce Near?
📉 TREND: BEARISH (4H + DAILY + WEEKLY)
💰 Price: $0.003510
🔴 24H: -4.36%
📊 RSI: 33.7
⚠️ Warning Signals
- 18 technical indicators are bearish.
- Price is below all 8 major moving averages.
- Selling pressure remains strong.
📍 Key Levels
- Support: $0.003419
- Major Support: $0.003270
- Resistance: $0.003569
🟢 Above $0.003569 → Recovery attempt.
🔴 Below $0.003419 → Further downside risk.
MY VIEW: Bears dominate, but an oversold bounce is possible. Wait for confirmation.
🔥 BOUNCE OR ANOTHER DROP?
#ankr #crypto #altcoins #TechnicalAnalys

5
107

·
--
🚀 $BULLA /USDT – ANOTHER BIG MOVE AHEAD? 🟢
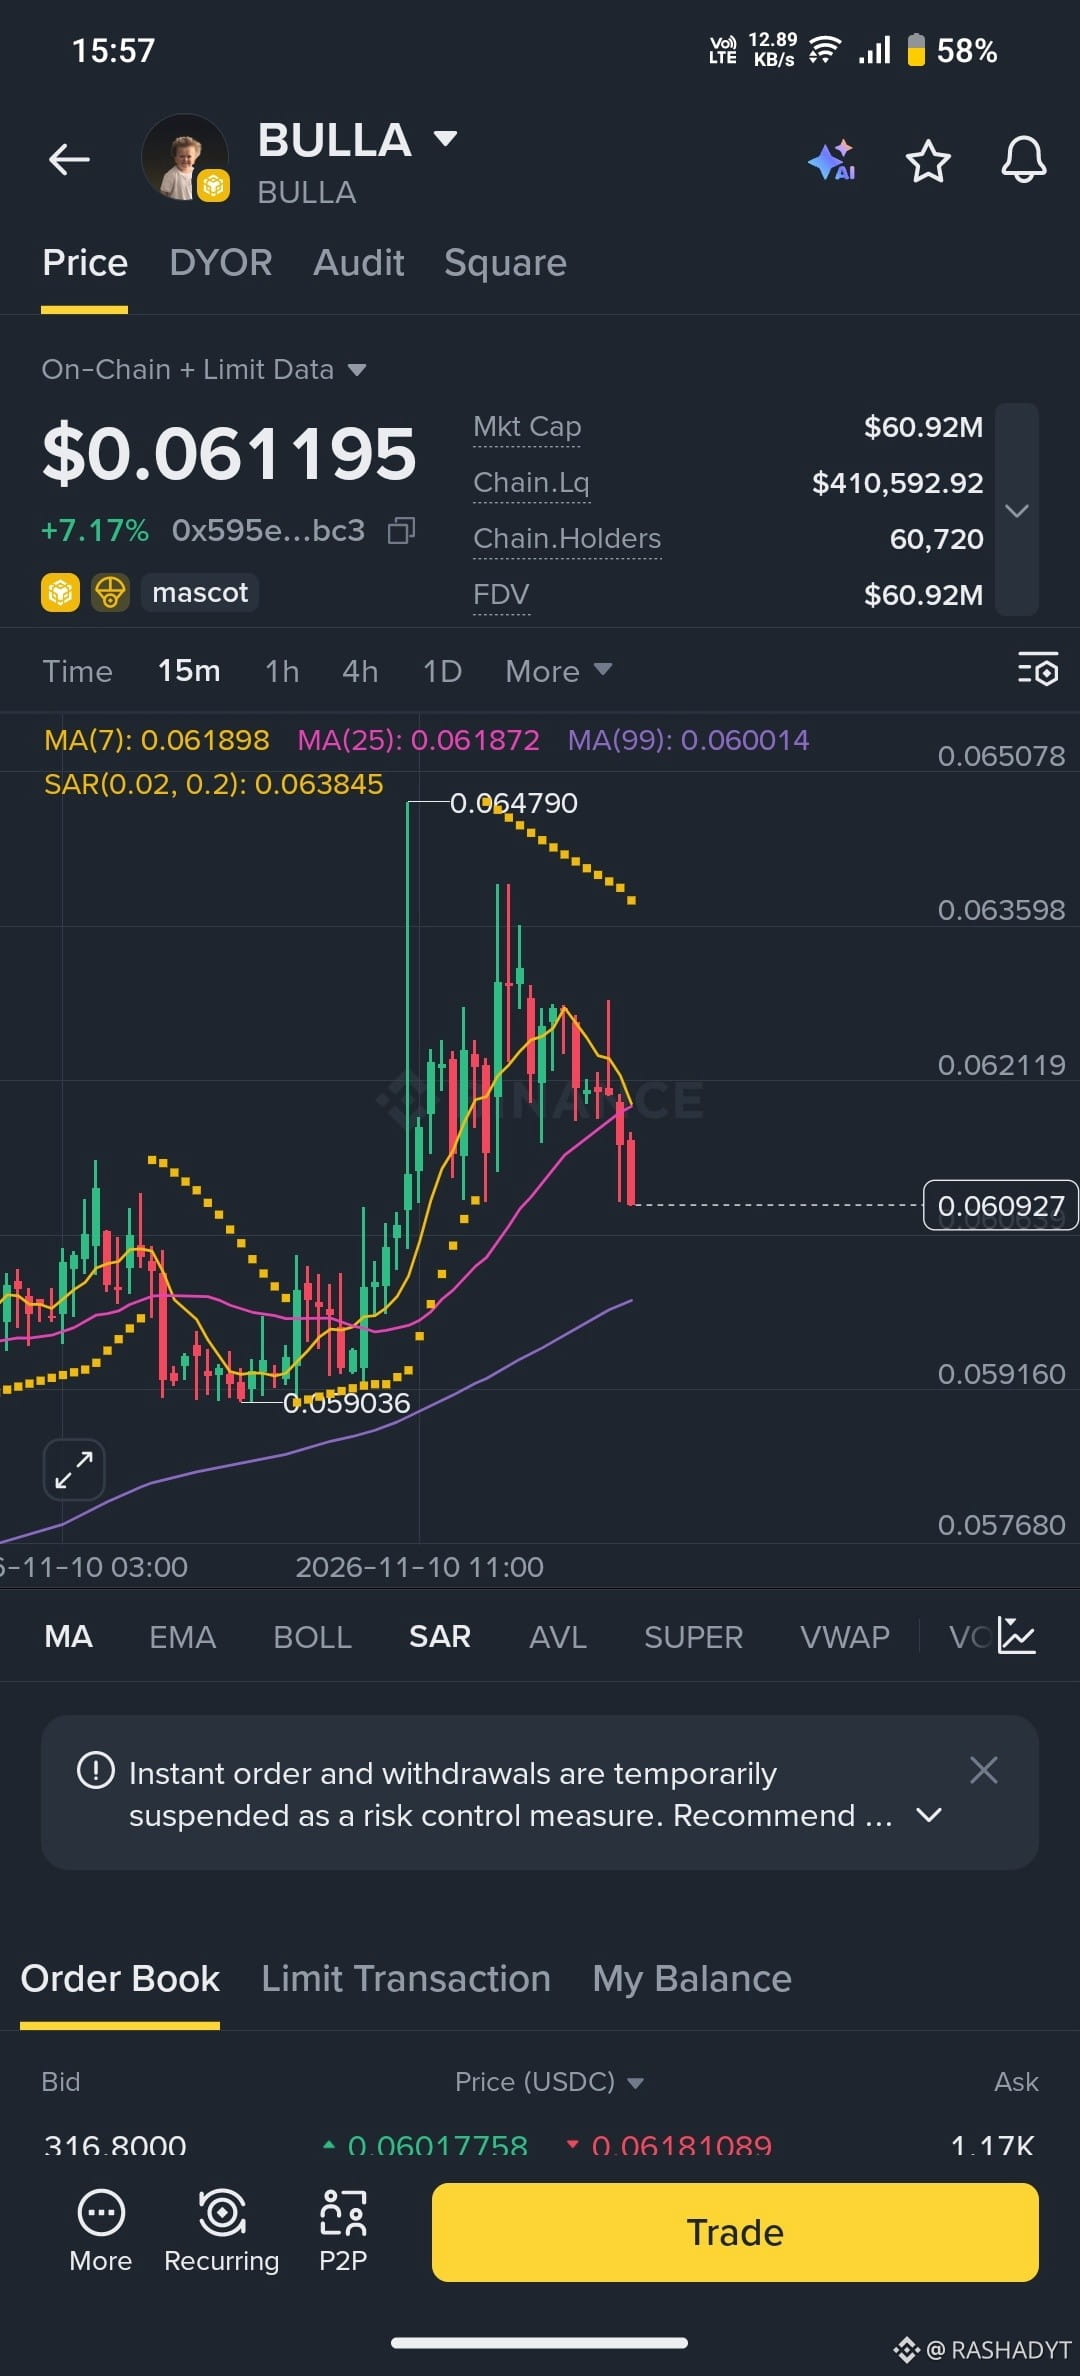
BULLA has gained strong momentum, reaching +7.17%, but sellers are now creating short-term pressure after the recent rally.
📊 MARKET OVERVIEW
- Current Price: $0.061195
- 24H Change: +7.17%
- Market Cap: $60.92M
- Holders: 60,720
- MA(7): $0.061898
- MA(25): $0.061872
- MA(99): $0.060014
- SAR: $0.063845
🎯 KEY RESISTANCE
- Resistance 1: $0.062119
- Resistance 2: $0.063598
- Major Resistance: $0.064790
🛡️ KEY SUPPORT
- Support 1: $0.060927
- Support 2: $0.060014
- Strong Support: $0.059160
📈 BULLISH SCENARIO
A recovery above $0.0619 could bring buyers back into control. A confirmed breakout above $0.0621 may open the way toward higher resistance.
⚠️ IMPORTANT
The price is currently below MA(7) and MA(25), while SAR is above the candles. This suggests short-term bearish pressure despite the broader recent recovery.
🔥 MY OUTLOOK
BULLA is at an important decision zone. I'm watching support and waiting for a clear breakout confirmation before expecting another rally.
💬 YOUR PREDICTION:
Will BULLA reclaim $0.0620 or test lower support first?
#BULLA #BULLAUSDT #Binance #CryptoAnalysis #Altcoins #MarketUpdate
{future}(BULLAUSDT)
#TechnicalAnalys sis
🚀 $BULLA /USDT – ANOTHER BIG MOVE AHEAD? 🟢
BULLA has gained strong momentum, reaching +7.17%, but sellers are now creating short-term pressure after the recent rally.
📊 MARKET OVERVIEW
- Current Price: $0.061195
- 24H Change: +7.17%
- Market Cap: $60.92M
- Holders: 60,720
- MA(7): $0.061898
- MA(25): $0.061872
- MA(99): $0.060014
- SAR: $0.063845
🎯 KEY RESISTANCE
- Resistance 1: $0.062119
- Resistance 2: $0.063598
- Major Resistance: $0.064790
🛡️ KEY SUPPORT
- Support 1: $0.060927
- Support 2: $0.060014
- Strong Support: $0.059160
📈 BULLISH SCENARIO
A recovery above $0.0619 could bring buyers back into control. A confirmed breakout above $0.0621 may open the way toward higher resistance.
⚠️ IMPORTANT
The price is currently below MA(7) and MA(25), while SAR is above the candles. This suggests short-term bearish pressure despite the broader recent recovery.
🔥 MY OUTLOOK
BULLA is at an important decision zone. I'm watching support and waiting for a clear breakout confirmation before expecting another rally.
💬 YOUR PREDICTION:
Will BULLA reclaim $0.0620 or test lower support first?
#BULLA #BULLAUSDT #Binance #CryptoAnalysis #Altcoins #MarketUpdate
#TechnicalAnalys sis
BULLA has gained strong momentum, reaching +7.17%, but sellers are now creating short-term pressure after the recent rally.
📊 MARKET OVERVIEW
- Current Price: $0.061195
- 24H Change: +7.17%
- Market Cap: $60.92M
- Holders: 60,720
- MA(7): $0.061898
- MA(25): $0.061872
- MA(99): $0.060014
- SAR: $0.063845
🎯 KEY RESISTANCE
- Resistance 1: $0.062119
- Resistance 2: $0.063598
- Major Resistance: $0.064790
🛡️ KEY SUPPORT
- Support 1: $0.060927
- Support 2: $0.060014
- Strong Support: $0.059160
📈 BULLISH SCENARIO
A recovery above $0.0619 could bring buyers back into control. A confirmed breakout above $0.0621 may open the way toward higher resistance.
⚠️ IMPORTANT
The price is currently below MA(7) and MA(25), while SAR is above the candles. This suggests short-term bearish pressure despite the broader recent recovery.
🔥 MY OUTLOOK
BULLA is at an important decision zone. I'm watching support and waiting for a clear breakout confirmation before expecting another rally.
💬 YOUR PREDICTION:
Will BULLA reclaim $0.0620 or test lower support first?
#BULLA #BULLAUSDT #Binance #CryptoAnalysis #Altcoins #MarketUpdate
#TechnicalAnalys sis
1
1
254

Article
BTC Daily Timeframe Market Structure AnalysisBitcoin's daily Timeframe Market Structure Analysis
Let's break down $BTC daily structure.
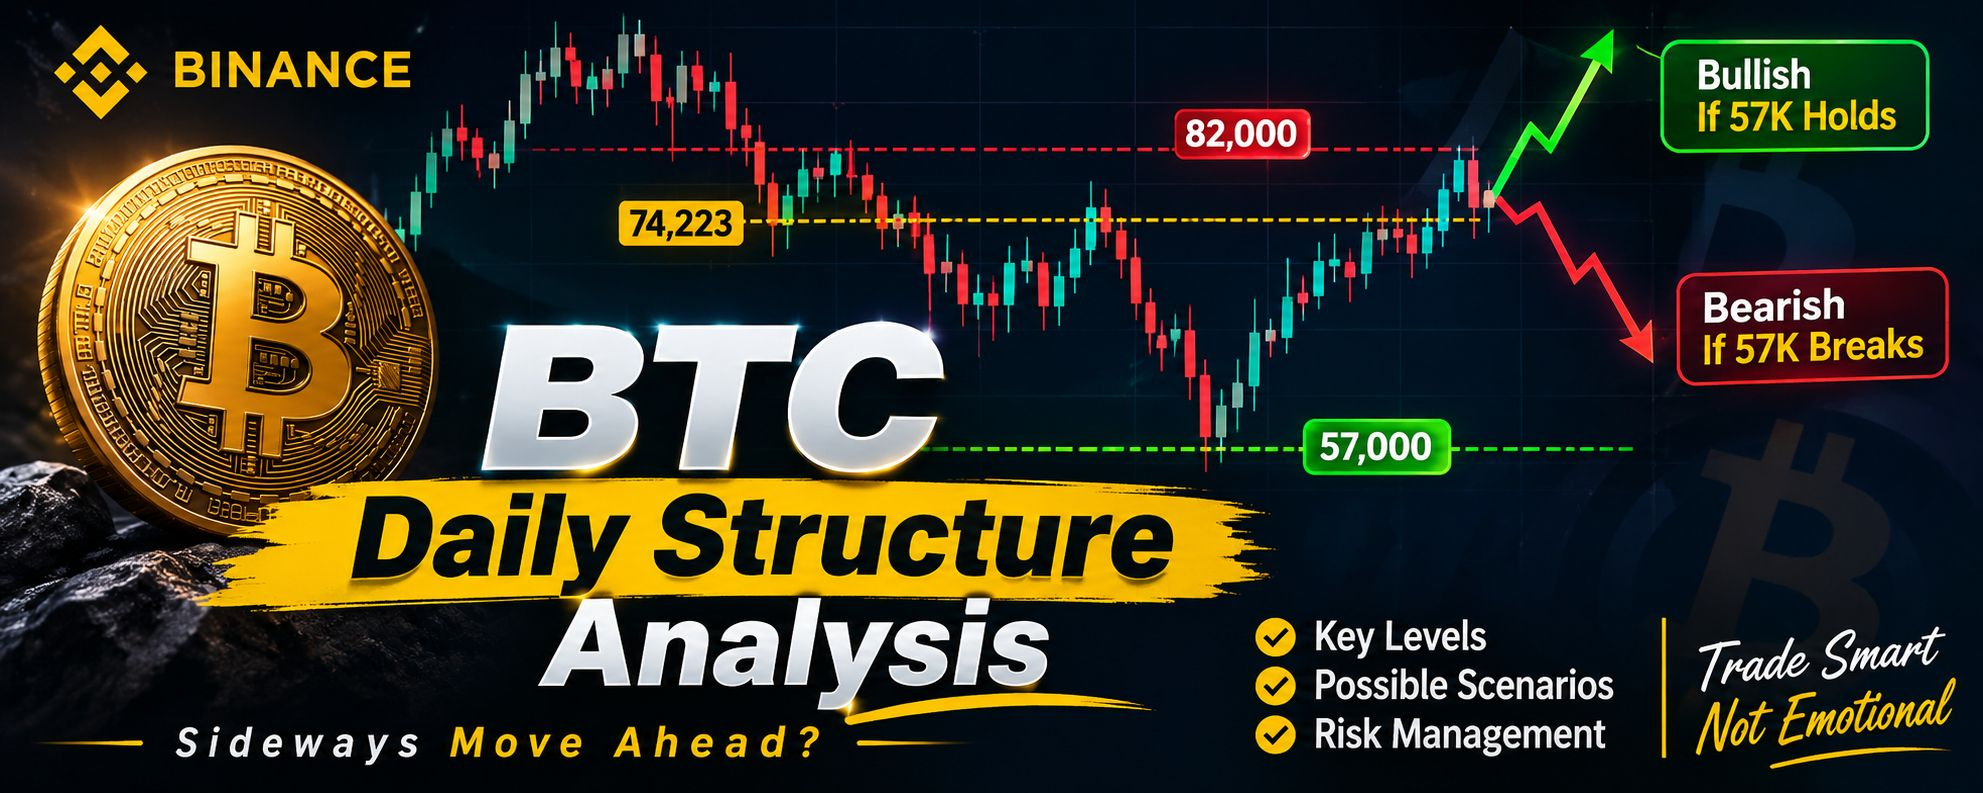
Current Market Condition: Sideways / Indecision
First, let's look at the major structural developments.
🔴 Bearish Structural Break
In April, $BTC broke its major confirmed higher low around $74,500. This was an important structural development and an early indication of potential bearish pressure.
However, the market did not immediately establish a sustained bearish structure. Eventually, BTC experienced a significant decline towards the $57,000 region.
{spot}(BTCUSDT)
🟢 Recent Recovery
After the decline, BTC recovered and moved above the $82,000 level.
However, this recovery alone does not confirm a complete bullish structural shift. We still need stronger evidence of bullish continuation.
🔍 What I'm Watching Next
Two important scenarios
Scenario 1 – Bullish Recovery
If BTC holds the $57,700 key support and develops stronger bullish structure, we could see further upside momentum.
Scenario 2 – Bearish Continuation
If BTC breaks below $57,700 with a confirmed daily candle close, it could indicate renewed bearish pressure and a potential shift towards further downside.
My Current View
For now, I prefer to remain patient rather than assume a clear directional trend.
Preserve capital, manage risk and monitor important liquidity levels on both sides of the market.
Remember: Understanding market structure is more important than predicting every move.
Regards,
Liquidity hunter
#BTC #Marketstructure #TechnicalAnalys #CryptoTrading
BTC Daily Timeframe Market Structure Analysis
Bitcoin's daily Timeframe Market Structure Analysis
Let's break down $BTC daily structure.
Current Market Condition: Sideways / Indecision
First, let's look at the major structural developments.
🔴 Bearish Structural Break
In April, $BTC broke its major confirmed higher low around $74,500. This was an important structural development and an early indication of potential bearish pressure.
However, the market did not immediately establish a sustained bearish structure. Eventually, BTC experienced a significant decline towards the $57,000 region.
🟢 Recent Recovery
After the decline, BTC recovered and moved above the $82,000 level.
However, this recovery alone does not confirm a complete bullish structural shift. We still need stronger evidence of bullish continuation.
🔍 What I'm Watching Next
Two important scenarios
Scenario 1 – Bullish Recovery
If BTC holds the $57,700 key support and develops stronger bullish structure, we could see further upside momentum.
Scenario 2 – Bearish Continuation
If BTC breaks below $57,700 with a confirmed daily candle close, it could indicate renewed bearish pressure and a potential shift towards further downside.
My Current View
For now, I prefer to remain patient rather than assume a clear directional trend.
Preserve capital, manage risk and monitor important liquidity levels on both sides of the market.
Remember: Understanding market structure is more important than predicting every move.
Regards,
Liquidity hunter
#BTC #Marketstructure #TechnicalAnalys #CryptoTrading
Let's break down $BTC daily structure.
Current Market Condition: Sideways / Indecision
First, let's look at the major structural developments.
🔴 Bearish Structural Break
In April, $BTC broke its major confirmed higher low around $74,500. This was an important structural development and an early indication of potential bearish pressure.
However, the market did not immediately establish a sustained bearish structure. Eventually, BTC experienced a significant decline towards the $57,000 region.
🟢 Recent Recovery
After the decline, BTC recovered and moved above the $82,000 level.
However, this recovery alone does not confirm a complete bullish structural shift. We still need stronger evidence of bullish continuation.
🔍 What I'm Watching Next
Two important scenarios
Scenario 1 – Bullish Recovery
If BTC holds the $57,700 key support and develops stronger bullish structure, we could see further upside momentum.
Scenario 2 – Bearish Continuation
If BTC breaks below $57,700 with a confirmed daily candle close, it could indicate renewed bearish pressure and a potential shift towards further downside.
My Current View
For now, I prefer to remain patient rather than assume a clear directional trend.
Preserve capital, manage risk and monitor important liquidity levels on both sides of the market.
Remember: Understanding market structure is more important than predicting every move.
Regards,
Liquidity hunter
#BTC #Marketstructure #TechnicalAnalys #CryptoTrading
1
80

Sure, here's the English version with hashtags, ready to post on your banners:
$ZEC
{spot}(ZECUSDT)
USDT Perp Chart Analysis (Zcash)**
- **Trading pair:** ZECUSDT Perpetual Futures (Zcash), on Binance
- **Current price:** about 1,186.64 USDT (roughly ₨328,485)
- **24h range:** High 1,225.00, Low 1,118.80
- **24h change:** +3.10%
- **1h chart:** Price fell from 1,225 to around 1,176, then recovered to about 1,186. Recent candles are small, showing market uncertainty.
- **Volume:** Higher volume came with the earlier sell-off. Volume has eased recently.
- **Performance:** Today -0.17% | 7 days +3.76% | 30 days -23.80% | 90 days +141.29% | 1 year +364.46%
**Risk note:** Perpetual futures use leverage and carry high risk. Crypto prices are very volatile, and past moves do not predict future results. Always use stop-losses and only trade what you can afford to lose.
#ZECUSDT #CryptoAnalysis" #TechnicalAnalys #RiskManagementMastery #crypto
Sure, here's the English version with hashtags, ready to post on your banners:
$ZEC
USDT Perp Chart Analysis (Zcash)**
- **Trading pair:** ZECUSDT Perpetual Futures (Zcash), on Binance
- **Current price:** about 1,186.64 USDT (roughly ₨328,485)
- **24h range:** High 1,225.00, Low 1,118.80
- **24h change:** +3.10%
- **1h chart:** Price fell from 1,225 to around 1,176, then recovered to about 1,186. Recent candles are small, showing market uncertainty.
- **Volume:** Higher volume came with the earlier sell-off. Volume has eased recently.
- **Performance:** Today -0.17% | 7 days +3.76% | 30 days -23.80% | 90 days +141.29% | 1 year +364.46%
**Risk note:** Perpetual futures use leverage and carry high risk. Crypto prices are very volatile, and past moves do not predict future results. Always use stop-losses and only trade what you can afford to lose.
#ZECUSDT #CryptoAnalysis" #TechnicalAnalys #RiskManagementMastery #crypto
$ZEC
USDT Perp Chart Analysis (Zcash)**
- **Trading pair:** ZECUSDT Perpetual Futures (Zcash), on Binance
- **Current price:** about 1,186.64 USDT (roughly ₨328,485)
- **24h range:** High 1,225.00, Low 1,118.80
- **24h change:** +3.10%
- **1h chart:** Price fell from 1,225 to around 1,176, then recovered to about 1,186. Recent candles are small, showing market uncertainty.
- **Volume:** Higher volume came with the earlier sell-off. Volume has eased recently.
- **Performance:** Today -0.17% | 7 days +3.76% | 30 days -23.80% | 90 days +141.29% | 1 year +364.46%
**Risk note:** Perpetual futures use leverage and carry high risk. Crypto prices are very volatile, and past moves do not predict future results. Always use stop-losses and only trade what you can afford to lose.
#ZECUSDT #CryptoAnalysis" #TechnicalAnalys #RiskManagementMastery #crypto
230

·
--
Bullish
🚨 ZEC under pressure! Are we seeing a strong rebound or another drop?
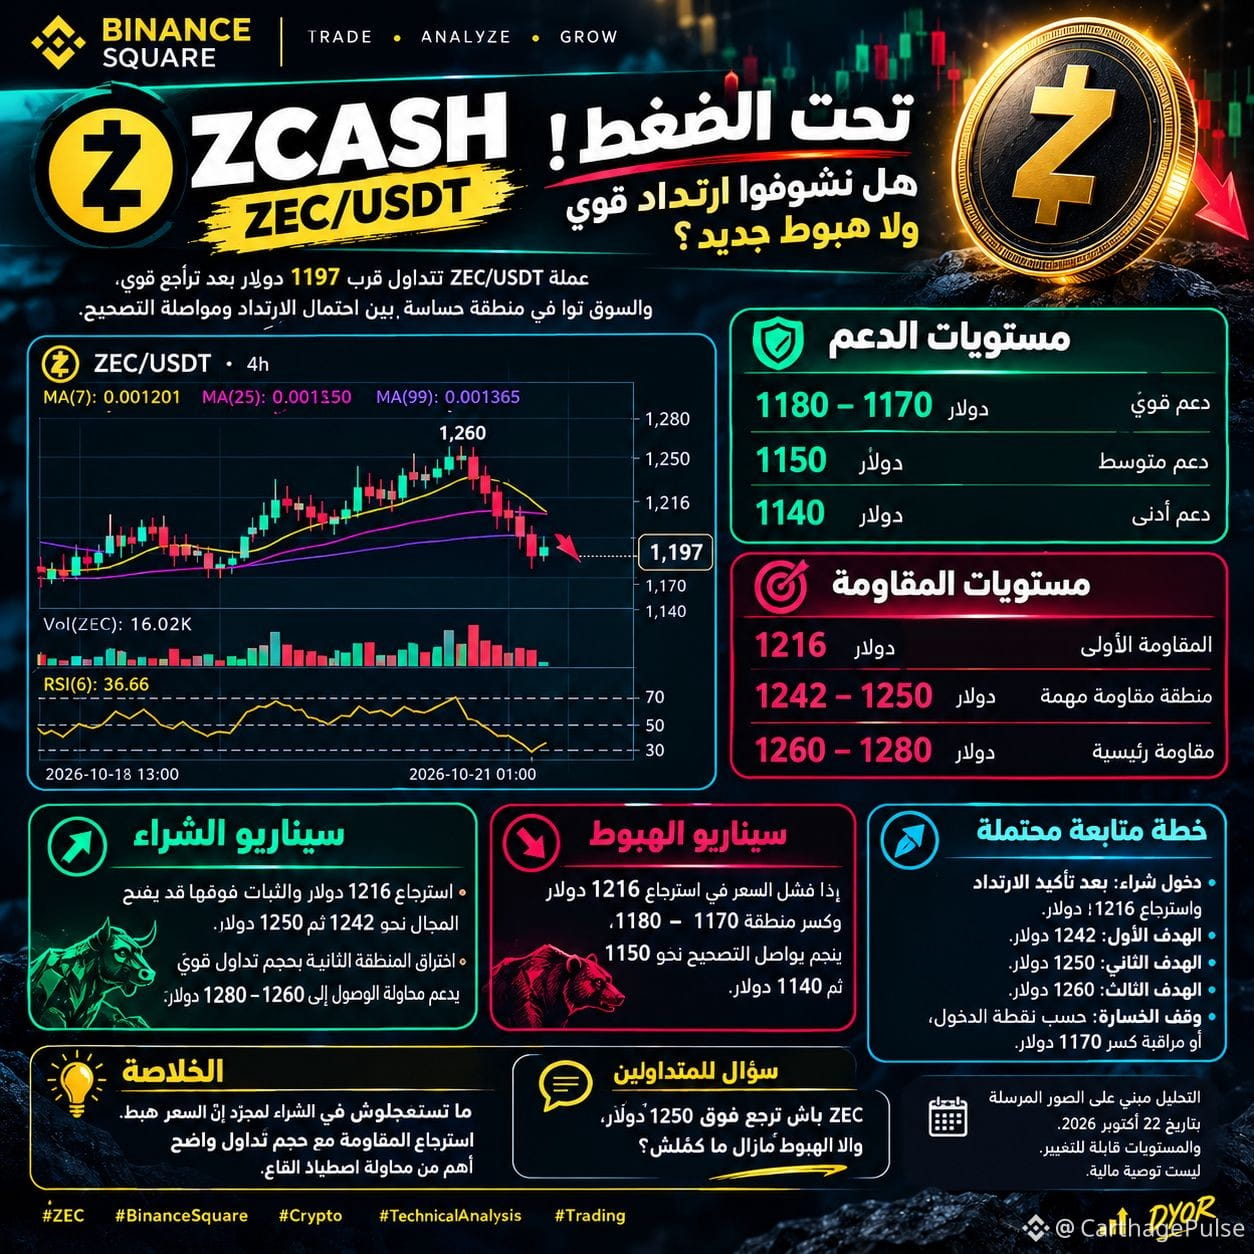
The ZEC/USDT coin is trading near $1,197 after a sharp decline, and the market is now at a sensitive zone between a potential rebound and further correction.
📊 Support levels:
🟢 $1,180–$1,170
🟢 $1,150
🟢 $1,140
🔴 Resistance levels:
1️⃣ $1,216
2️⃣ $1,242–$1,250
3️⃣ $1,260–$1,280
📈 Bullish scenario:
Reclaiming $1,216 and holding above it could open the way toward $1,242, then $1,250. A breakout above the second zone on strong trading volume would support an attempt to reach $1,260–$1,280.
📉 Bearish scenario:
If the price fails to reclaim $1,216 and breaks below the $1,170–$1,180 zone, it could continue correcting toward $1,150, then $1,140.
🎯 Potential trading plan:
- Buy entry: After a confirmed rebound and reclaiming $1,216.
- First target: $1,242.
- Second target: $1,250.
- Third target: $1,260.
- Stop-loss: Set based on the entry point; a break below $1,170 can be monitored as a sign of weakness.
💡 Bottom line: Don’t rush into buying just because the price has dropped. Reclaiming resistance with clear trading volume matters more than trying to catch the bottom.
🔥 Question for traders: Will ZEC get back above $1,250, or is the drop not over yet?
⚠️ These levels are estimates as of October 22, 2026, and are not live prices or financial advice. Check the current price before placing any trade.
#ZECUSDT C #BinanceSquare #crypto #TechnicalAnalys sis #trading $ZEC
{future}(ZECUSDT)
🚨 ZEC under pressure! Are we seeing a strong rebound or another drop?
The ZEC/USDT coin is trading near $1,197 after a sharp decline, and the market is now at a sensitive zone between a potential rebound and further correction.
📊 Support levels:
🟢 $1,180–$1,170
🟢 $1,150
🟢 $1,140
🔴 Resistance levels:
1️⃣ $1,216
2️⃣ $1,242–$1,250
3️⃣ $1,260–$1,280
📈 Bullish scenario:
Reclaiming $1,216 and holding above it could open the way toward $1,242, then $1,250. A breakout above the second zone on strong trading volume would support an attempt to reach $1,260–$1,280.
📉 Bearish scenario:
If the price fails to reclaim $1,216 and breaks below the $1,170–$1,180 zone, it could continue correcting toward $1,150, then $1,140.
🎯 Potential trading plan:
- Buy entry: After a confirmed rebound and reclaiming $1,216.
- First target: $1,242.
- Second target: $1,250.
- Third target: $1,260.
- Stop-loss: Set based on the entry point; a break below $1,170 can be monitored as a sign of weakness.
💡 Bottom line: Don’t rush into buying just because the price has dropped. Reclaiming resistance with clear trading volume matters more than trying to catch the bottom.
🔥 Question for traders: Will ZEC get back above $1,250, or is the drop not over yet?
⚠️ These levels are estimates as of October 22, 2026, and are not live prices or financial advice. Check the current price before placing any trade.
#ZECUSDT C #BinanceSquare #crypto #TechnicalAnalys sis #trading $ZEC
The ZEC/USDT coin is trading near $1,197 after a sharp decline, and the market is now at a sensitive zone between a potential rebound and further correction.
📊 Support levels:
🟢 $1,180–$1,170
🟢 $1,150
🟢 $1,140
🔴 Resistance levels:
1️⃣ $1,216
2️⃣ $1,242–$1,250
3️⃣ $1,260–$1,280
📈 Bullish scenario:
Reclaiming $1,216 and holding above it could open the way toward $1,242, then $1,250. A breakout above the second zone on strong trading volume would support an attempt to reach $1,260–$1,280.
📉 Bearish scenario:
If the price fails to reclaim $1,216 and breaks below the $1,170–$1,180 zone, it could continue correcting toward $1,150, then $1,140.
🎯 Potential trading plan:
- Buy entry: After a confirmed rebound and reclaiming $1,216.
- First target: $1,242.
- Second target: $1,250.
- Third target: $1,260.
- Stop-loss: Set based on the entry point; a break below $1,170 can be monitored as a sign of weakness.
💡 Bottom line: Don’t rush into buying just because the price has dropped. Reclaiming resistance with clear trading volume matters more than trying to catch the bottom.
🔥 Question for traders: Will ZEC get back above $1,250, or is the drop not over yet?
⚠️ These levels are estimates as of October 22, 2026, and are not live prices or financial advice. Check the current price before placing any trade.
#ZECUSDT C #BinanceSquare #crypto #TechnicalAnalys sis #trading $ZEC
146

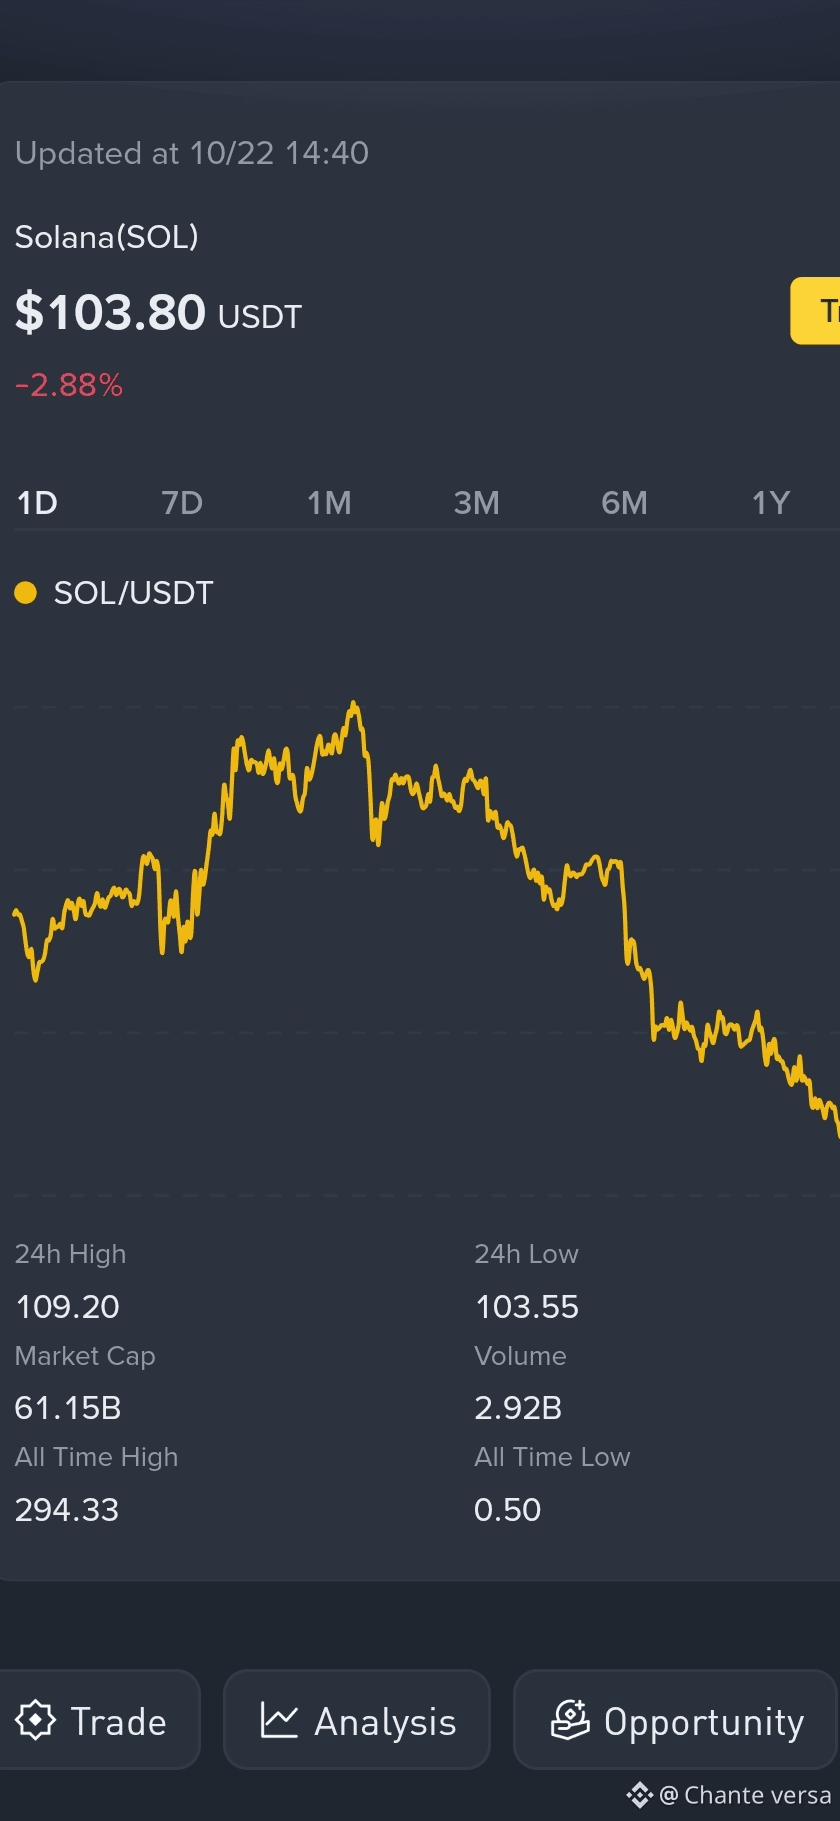
$SOL ’s daily candle is showing volatility.
The price is around $103.81, and today’s candle is trading below its open. The RSI is near 34, while the MACD is currently showing a bearish trend.
Rather than looking at the candle alone, it’s important to also check volume, support and resistance, and the overall market trend.
#SOL #Crypto_Jobs🎯 o #candlestick ck #trading #TechnicalAnalys is #BİNANCE
$SOL ’s daily candle is showing volatility.
The price is around $103.81, and today’s candle is trading below its open. The RSI is near 34, while the MACD is currently showing a bearish trend.
Rather than looking at the candle alone, it’s important to also check volume, support and resistance, and the overall market trend.
#SOL #Crypto_Jobs🎯 o #candlestick ck #trading #TechnicalAnalys is #BİNANCE
The price is around $103.81, and today’s candle is trading below its open. The RSI is near 34, while the MACD is currently showing a bearish trend.
Rather than looking at the candle alone, it’s important to also check volume, support and resistance, and the overall market trend.
#SOL #Crypto_Jobs🎯 o #candlestick ck #trading #TechnicalAnalys is #BİNANCE
69

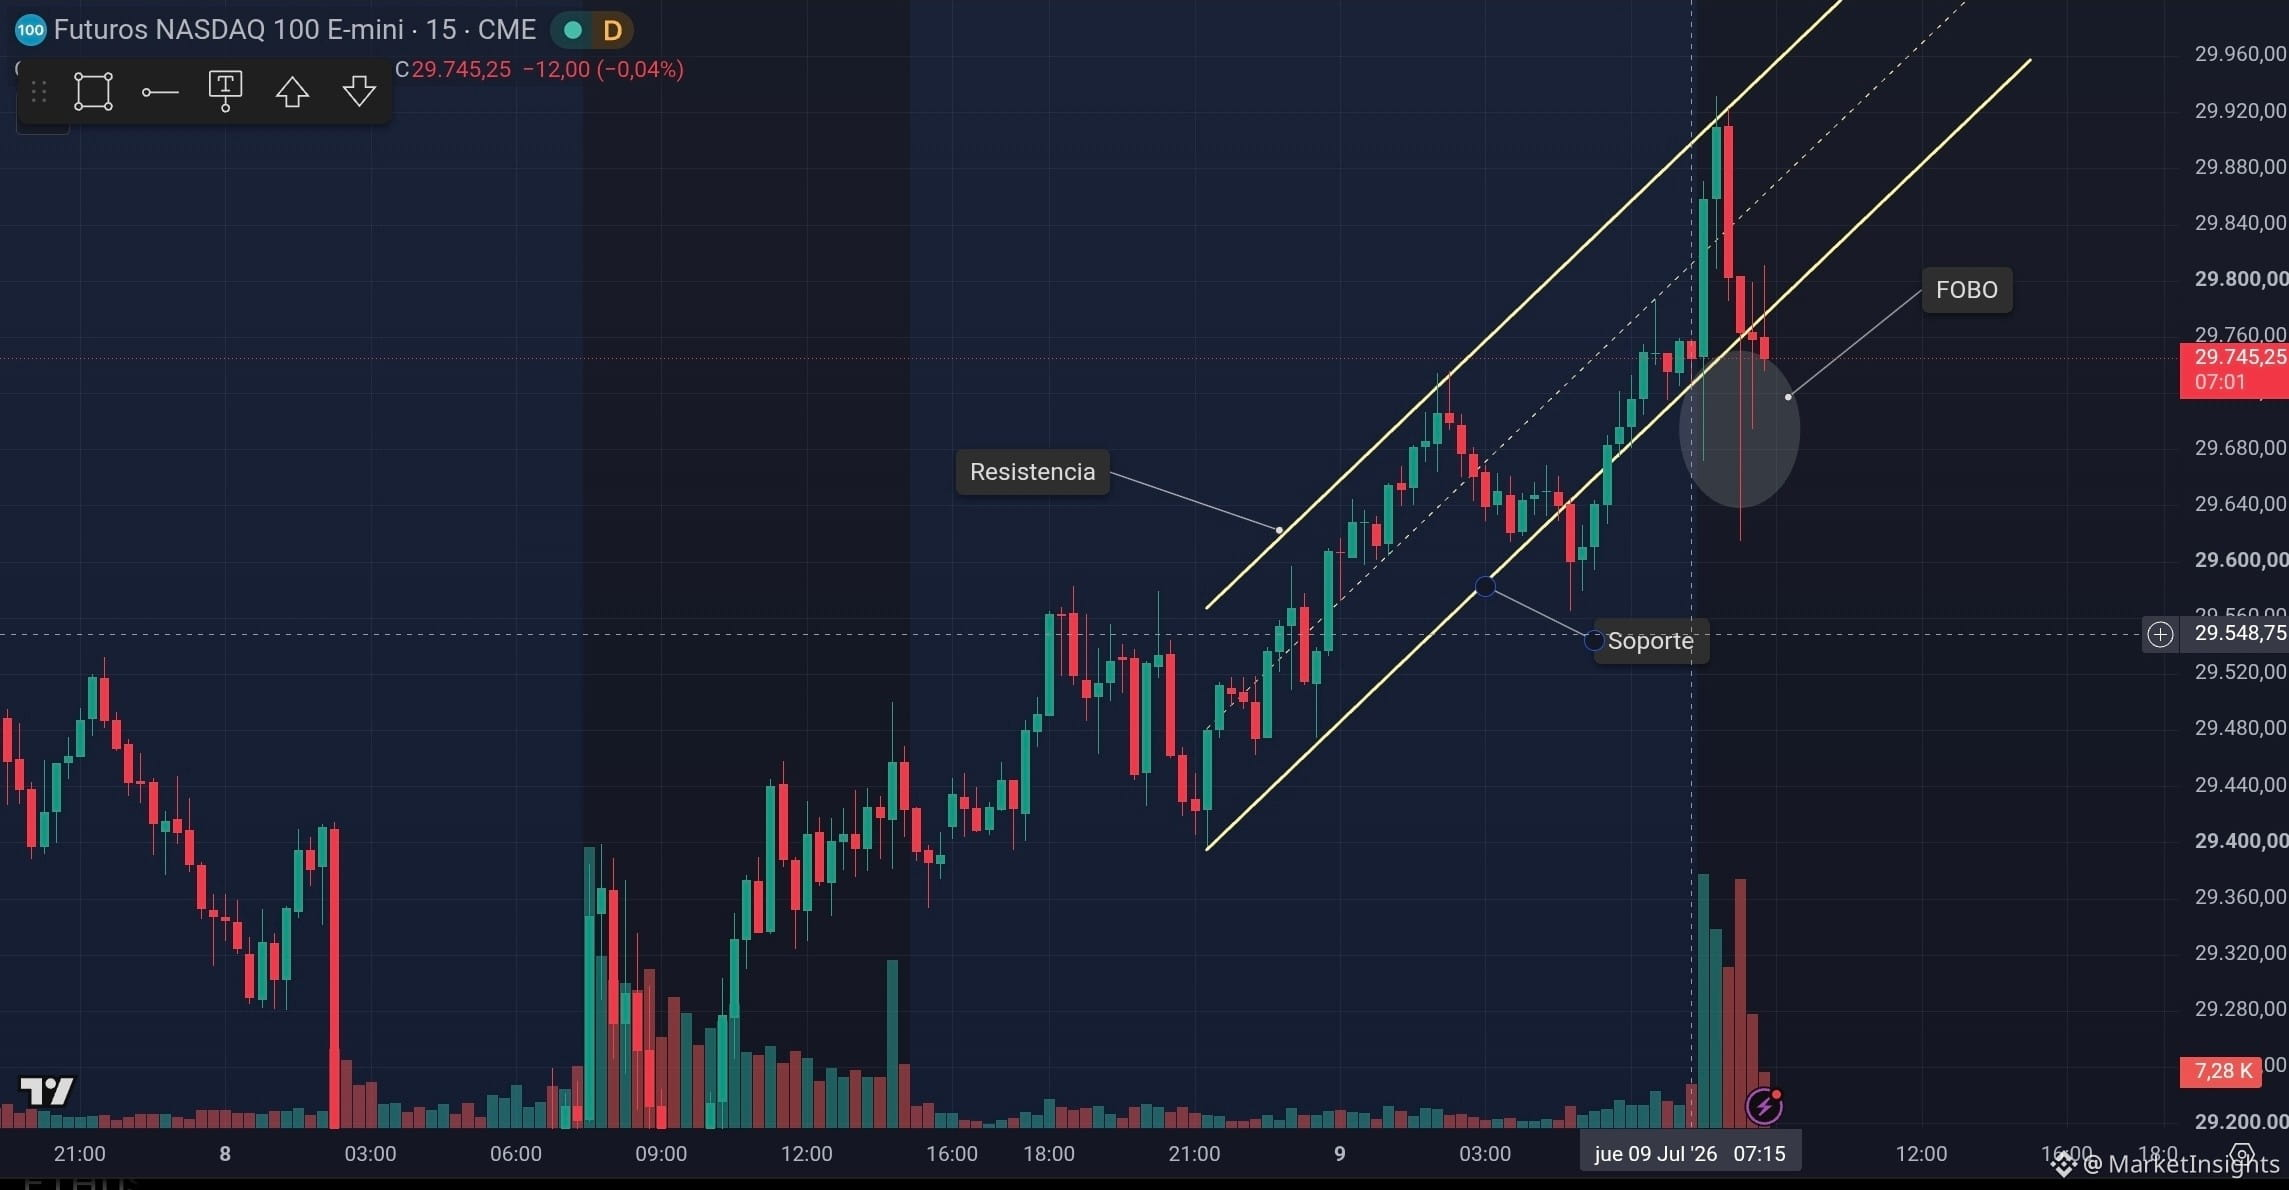
📊 Market Insights | Nasdaq 100 (NQ) Analysis
📅 July 09, 2026
The Nasdaq 100 was moving within an uptrend channel. We saw a FOBO (false breakout) after briefly losing the channel, but now the price is returning to test the former resistance.
If the price manages to break upward again and turn that resistance into support, a possible bullish continuation would be confirmed. On the other hand, if the price fails to break above resistance and returns to the sideways range, we would prefer to wait for a clearer reaction before anticipating the next move.
⚠️ This analysis represents a technical scenario based on price action and does not constitute investment advice.
💬 Do you think the Nasdaq will regain the channel or continue trading in a range? I’m reading your thoughts in the comments!
#MarketInsights #Nasdaq #NQ #tradingtechnique #TechnicalAnalys #MercadosFinancieros
📊 Market Insights | Nasdaq 100 (NQ) Analysis
📅 July 09, 2026
The Nasdaq 100 was moving within an uptrend channel. We saw a FOBO (false breakout) after briefly losing the channel, but now the price is returning to test the former resistance.
If the price manages to break upward again and turn that resistance into support, a possible bullish continuation would be confirmed. On the other hand, if the price fails to break above resistance and returns to the sideways range, we would prefer to wait for a clearer reaction before anticipating the next move.
⚠️ This analysis represents a technical scenario based on price action and does not constitute investment advice.
💬 Do you think the Nasdaq will regain the channel or continue trading in a range? I’m reading your thoughts in the comments!
#MarketInsights #Nasdaq #NQ #tradingtechnique #TechnicalAnalys #MercadosFinancieros
📅 July 09, 2026
The Nasdaq 100 was moving within an uptrend channel. We saw a FOBO (false breakout) after briefly losing the channel, but now the price is returning to test the former resistance.
If the price manages to break upward again and turn that resistance into support, a possible bullish continuation would be confirmed. On the other hand, if the price fails to break above resistance and returns to the sideways range, we would prefer to wait for a clearer reaction before anticipating the next move.
⚠️ This analysis represents a technical scenario based on price action and does not constitute investment advice.
💬 Do you think the Nasdaq will regain the channel or continue trading in a range? I’m reading your thoughts in the comments!
#MarketInsights #Nasdaq #NQ #tradingtechnique #TechnicalAnalys #MercadosFinancieros
1
253

·
--
$BTC
$BSB
{future}(BSBUSDT)
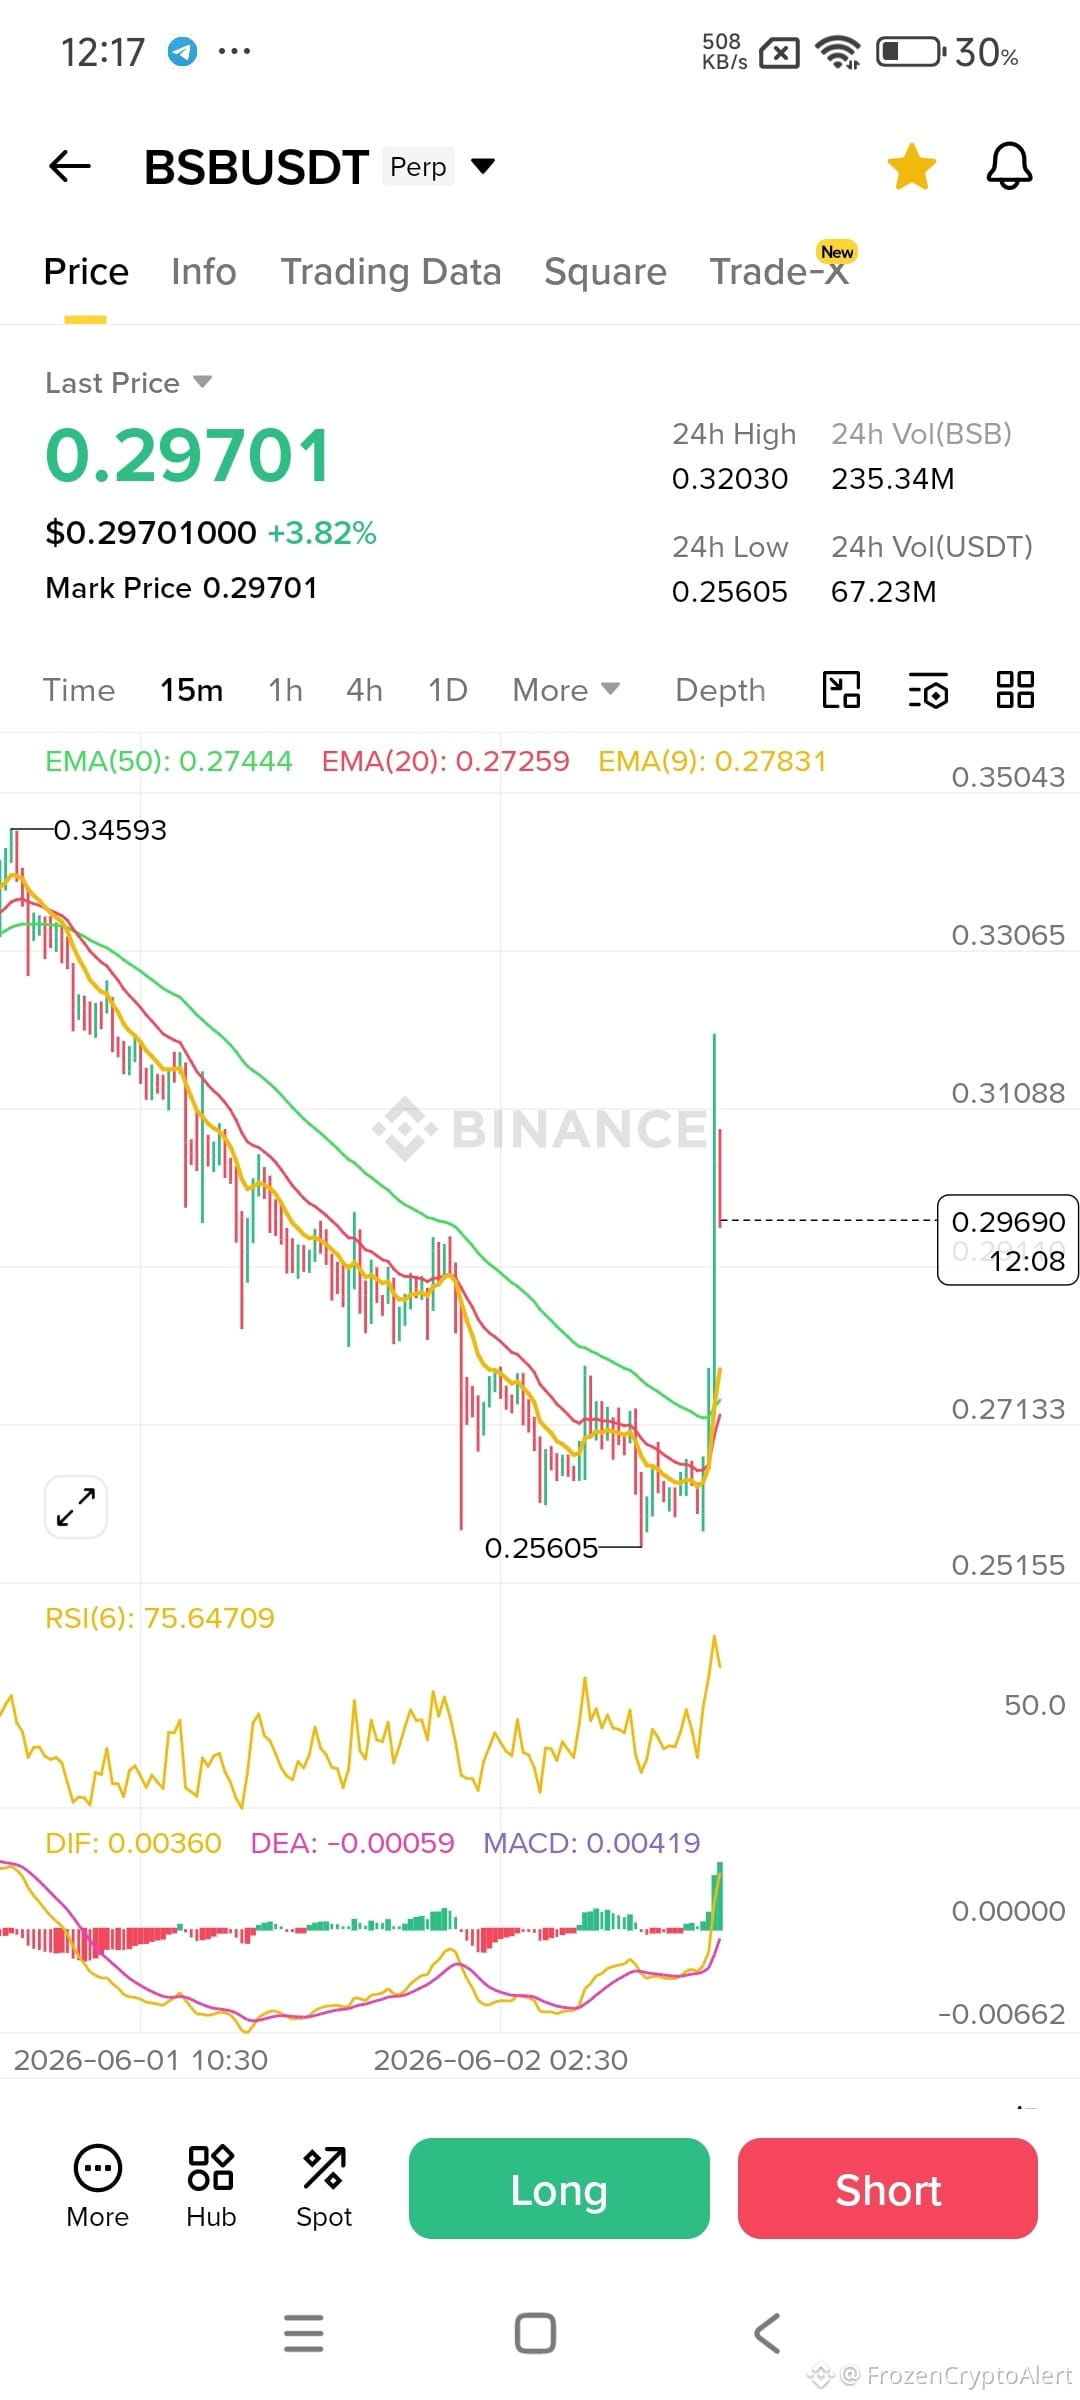
Watching BSBUSDT closely today! 📈 The chart is showing some interesting movement. Keeping an eye on the order book to see if the bulls can break through the next resistance level. Let's see if we can catch the trend!
#BSBUSDT #CryptoTradingTip #TechnicalAnalys
$BTC
$BSB
Watching BSBUSDT closely today! 📈 The chart is showing some interesting movement. Keeping an eye on the order book to see if the bulls can break through the next resistance level. Let's see if we can catch the trend!
#BSBUSDT #CryptoTradingTip #TechnicalAnalys
$BSB
Watching BSBUSDT closely today! 📈 The chart is showing some interesting movement. Keeping an eye on the order book to see if the bulls can break through the next resistance level. Let's see if we can catch the trend!
#BSBUSDT #CryptoTradingTip #TechnicalAnalys

50000shiba
From FrozenCryptoAlert
252

·
--
Bearish
📉 SIGNAL: #BICOUSDT Perp — SHORT Entry 🔴
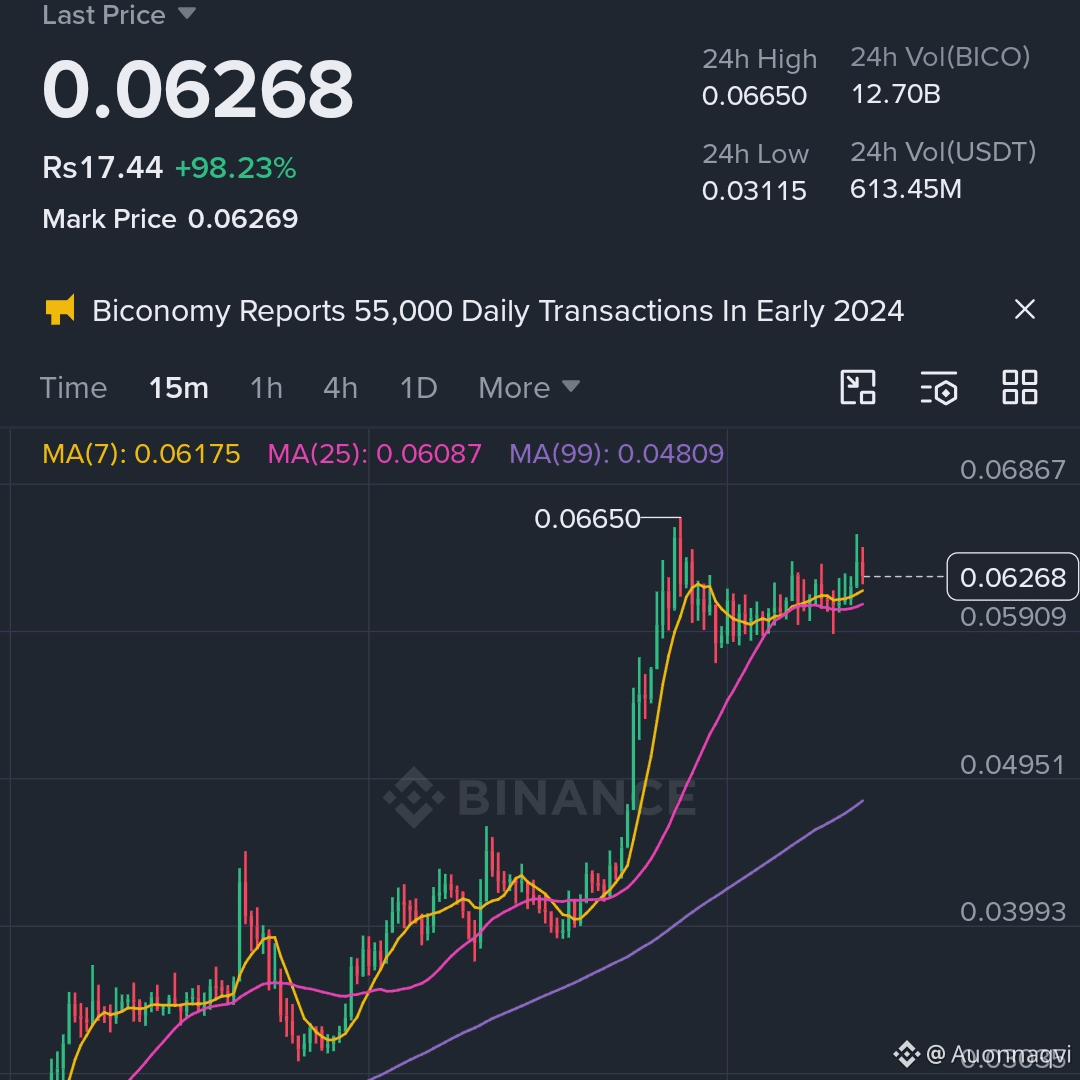
BICO has surged over +80% on the 1-hour chart, but order flow shows a heavy divergence. Retail is heavily longing, while large Whales have built a massive $1.89M Short position. Expect a fast, volatile push upward to clear liquidity before a sharp market correction.
Do not chase market entries; use laddered limit orders to safely catch the squeeze.
Direction: SHORT 📉
Leverage: Cross (Keep it low: 3x - 5x recommended due to high volatility)
🎯 Entry Strategy (Laddered Limits)
Entry 1 (35%): $0.06380 - 0.06450
Entry 2 (65%): $0.06620 - 0.06690 (Hunting the 24h High liquidity)
💰 Take Profit (TP)
TP 1: 0.05450 (Front-running whale support)
TP 2: 0.04850 (Dynamic 1H MA-25 support)
🛡️ Risk Management
Stop Loss (SL): 0.06850
{future}(BICOUSDT)
Disclaimer: Parabolic setups are highly volatile. Manage your margin size carefully and always trade with capital you can afford to risk.
#BICO #TechnicalAnalys #cryptosignals
📉 SIGNAL: #BICOUSDT Perp — SHORT Entry 🔴
BICO has surged over +80% on the 1-hour chart, but order flow shows a heavy divergence. Retail is heavily longing, while large Whales have built a massive $1.89M Short position. Expect a fast, volatile push upward to clear liquidity before a sharp market correction.
Do not chase market entries; use laddered limit orders to safely catch the squeeze.
Direction: SHORT 📉
Leverage: Cross (Keep it low: 3x - 5x recommended due to high volatility)
🎯 Entry Strategy (Laddered Limits)
Entry 1 (35%): $0.06380 - 0.06450
Entry 2 (65%): $0.06620 - 0.06690 (Hunting the 24h High liquidity)
💰 Take Profit (TP)
TP 1: 0.05450 (Front-running whale support)
TP 2: 0.04850 (Dynamic 1H MA-25 support)
🛡️ Risk Management
Stop Loss (SL): 0.06850
Disclaimer: Parabolic setups are highly volatile. Manage your margin size carefully and always trade with capital you can afford to risk.
#BICO #TechnicalAnalys #cryptosignals
BICO has surged over +80% on the 1-hour chart, but order flow shows a heavy divergence. Retail is heavily longing, while large Whales have built a massive $1.89M Short position. Expect a fast, volatile push upward to clear liquidity before a sharp market correction.
Do not chase market entries; use laddered limit orders to safely catch the squeeze.
Direction: SHORT 📉
Leverage: Cross (Keep it low: 3x - 5x recommended due to high volatility)
🎯 Entry Strategy (Laddered Limits)
Entry 1 (35%): $0.06380 - 0.06450
Entry 2 (65%): $0.06620 - 0.06690 (Hunting the 24h High liquidity)
💰 Take Profit (TP)
TP 1: 0.05450 (Front-running whale support)
TP 2: 0.04850 (Dynamic 1H MA-25 support)
🛡️ Risk Management
Stop Loss (SL): 0.06850
Disclaimer: Parabolic setups are highly volatile. Manage your margin size carefully and always trade with capital you can afford to risk.
#BICO #TechnicalAnalys #cryptosignals
178

·
--
Bearish
$ETH 🆕 "Looks like the BEARS are cooking up another brutal plan... Keep your eyes locked to the charts! 😈🔥🐻" (09-06-2026)
SHORT ETH only below 1620
(Based on 1H candlestick chart. If 1H candle closes below 1620, it will get activated)
SL 💔- 1675 (closing basis)
Target 🎯 1552--1506--1468
Ultimate Target 🥏 1313
#PaperTrading
#TechnicalAnalys
#CryptoTrading
#CryptoAnalysis
NOTE---
***For educational purpose only. Do paper trade only.***
🔥Disclaimer 👉 This is my personal analysis for educational purposes , Buy/Sell/Trade at your own risk. I am not a Financial Advisor.
$ETH 🆕 "Looks like the BEARS are cooking up another brutal plan... Keep your eyes locked to the charts! 😈🔥🐻" (09-06-2026)
SHORT ETH only below 1620
(Based on 1H candlestick chart. If 1H candle closes below 1620, it will get activated)
SL 💔- 1675 (closing basis)
Target 🎯 1552--1506--1468
Ultimate Target 🥏 1313
#PaperTrading
#TechnicalAnalys
#CryptoTrading
#CryptoAnalysis
NOTE---
***For educational purpose only. Do paper trade only.***
🔥Disclaimer 👉 This is my personal analysis for educational purposes , Buy/Sell/Trade at your own risk. I am not a Financial Advisor.
SHORT ETH only below 1620
(Based on 1H candlestick chart. If 1H candle closes below 1620, it will get activated)
SL 💔- 1675 (closing basis)
Target 🎯 1552--1506--1468
Ultimate Target 🥏 1313
#PaperTrading
#TechnicalAnalys
#CryptoTrading
#CryptoAnalysis
NOTE---
***For educational purpose only. Do paper trade only.***
🔥Disclaimer 👉 This is my personal analysis for educational purposes , Buy/Sell/Trade at your own risk. I am not a Financial Advisor.
128

·
--
$SOL HAS THE FLOWS NOW PRICE NEEDS TO CONFIRM
The interesting part of Solana right now isn’t just the chart.
U.S. spot Solana ETFs just posted their strongest weekly inflow since launch, pulling in about 188M USD across the five sessions through September 25. All seven funds recorded net inflows.
But price action is telling a more cautious story.
At the latest Binance market update, SOL is around 118.33 USD, with a 24h range of 116.53–121.49.
So institutional demand is strong but the market still needs to prove that demand can translate into sustained spot strength.
📊 THE LEVELS I’M WATCHING
116.5–117.0 → Near-term support
120.2–121.5 → Immediate resistance zone
Above 121.5 → Breakout needs confirmation
Below 116.5 → Short-term structure weakens
This is the key distinction:
ETF inflows show capital is entering the investment products.
They do NOT automatically guarantee that SOL price will continue higher.
For me, the next signal is simple:
Does price reclaim the upper end of the current range while liquidity stays supportive?
That reaction matters more than the headline.
What are you watching first ETF flows or the SOL chart?
#sol #Crypto #altcoins #TechnicalAnalys is #CryptoMarket
$SOL HAS THE FLOWS NOW PRICE NEEDS TO CONFIRM
The interesting part of Solana right now isn’t just the chart.
U.S. spot Solana ETFs just posted their strongest weekly inflow since launch, pulling in about 188M USD across the five sessions through September 25. All seven funds recorded net inflows.
But price action is telling a more cautious story.
At the latest Binance market update, SOL is around 118.33 USD, with a 24h range of 116.53–121.49.
So institutional demand is strong but the market still needs to prove that demand can translate into sustained spot strength.
📊 THE LEVELS I’M WATCHING
116.5–117.0 → Near-term support
120.2–121.5 → Immediate resistance zone
Above 121.5 → Breakout needs confirmation
Below 116.5 → Short-term structure weakens
This is the key distinction:
ETF inflows show capital is entering the investment products.
They do NOT automatically guarantee that SOL price will continue higher.
For me, the next signal is simple:
Does price reclaim the upper end of the current range while liquidity stays supportive?
That reaction matters more than the headline.
What are you watching first ETF flows or the SOL chart?
#sol #Crypto #altcoins #TechnicalAnalys is #CryptoMarket
The interesting part of Solana right now isn’t just the chart.
U.S. spot Solana ETFs just posted their strongest weekly inflow since launch, pulling in about 188M USD across the five sessions through September 25. All seven funds recorded net inflows.
But price action is telling a more cautious story.
At the latest Binance market update, SOL is around 118.33 USD, with a 24h range of 116.53–121.49.
So institutional demand is strong but the market still needs to prove that demand can translate into sustained spot strength.
📊 THE LEVELS I’M WATCHING
116.5–117.0 → Near-term support
120.2–121.5 → Immediate resistance zone
Above 121.5 → Breakout needs confirmation
Below 116.5 → Short-term structure weakens
This is the key distinction:
ETF inflows show capital is entering the investment products.
They do NOT automatically guarantee that SOL price will continue higher.
For me, the next signal is simple:
Does price reclaim the upper end of the current range while liquidity stays supportive?
That reaction matters more than the headline.
What are you watching first ETF flows or the SOL chart?
#sol #Crypto #altcoins #TechnicalAnalys is #CryptoMarket

72

·
--
Bullish
🚀 $WLD — BULLISH BREAKOUT Setup
{future}(WLDUSDT)
$WLD is holding an important support zone around $0.54–$0.56 while approaching the key resistance area at $0.58–$0.60.
🟢 Bullish Scenario
If buyers defend $0.54–$0.56 and WLD breaks and holds above $0.59–$0.60, the next upside targets could be:
🎯 TP1: $0.65
🎯 TP2: $0.70+
📌 Key Support: $0.54–$0.56
🔥 Breakout Zone: $0.59–$0.60
✅ Confirmation: Strong 4H close above resistance.
A confirmed breakout could bring fresh bullish momentum toward the next resistance levels. 🚀
⚠️ Wait for confirmation and manage risk
#WLDUSDT #TechnicalAnalys
🚀 $WLD — BULLISH BREAKOUT Setup
$WLD is holding an important support zone around $0.54–$0.56 while approaching the key resistance area at $0.58–$0.60.
🟢 Bullish Scenario
If buyers defend $0.54–$0.56 and WLD breaks and holds above $0.59–$0.60, the next upside targets could be:
🎯 TP1: $0.65
🎯 TP2: $0.70+
📌 Key Support: $0.54–$0.56
🔥 Breakout Zone: $0.59–$0.60
✅ Confirmation: Strong 4H close above resistance.
A confirmed breakout could bring fresh bullish momentum toward the next resistance levels. 🚀
⚠️ Wait for confirmation and manage risk
#WLDUSDT #TechnicalAnalys
$WLD is holding an important support zone around $0.54–$0.56 while approaching the key resistance area at $0.58–$0.60.
🟢 Bullish Scenario
If buyers defend $0.54–$0.56 and WLD breaks and holds above $0.59–$0.60, the next upside targets could be:
🎯 TP1: $0.65
🎯 TP2: $0.70+
📌 Key Support: $0.54–$0.56
🔥 Breakout Zone: $0.59–$0.60
✅ Confirmation: Strong 4H close above resistance.
A confirmed breakout could bring fresh bullish momentum toward the next resistance levels. 🚀
⚠️ Wait for confirmation and manage risk
#WLDUSDT #TechnicalAnalys
247

·
--
$PYTH
{future}(PYTHUSDT)
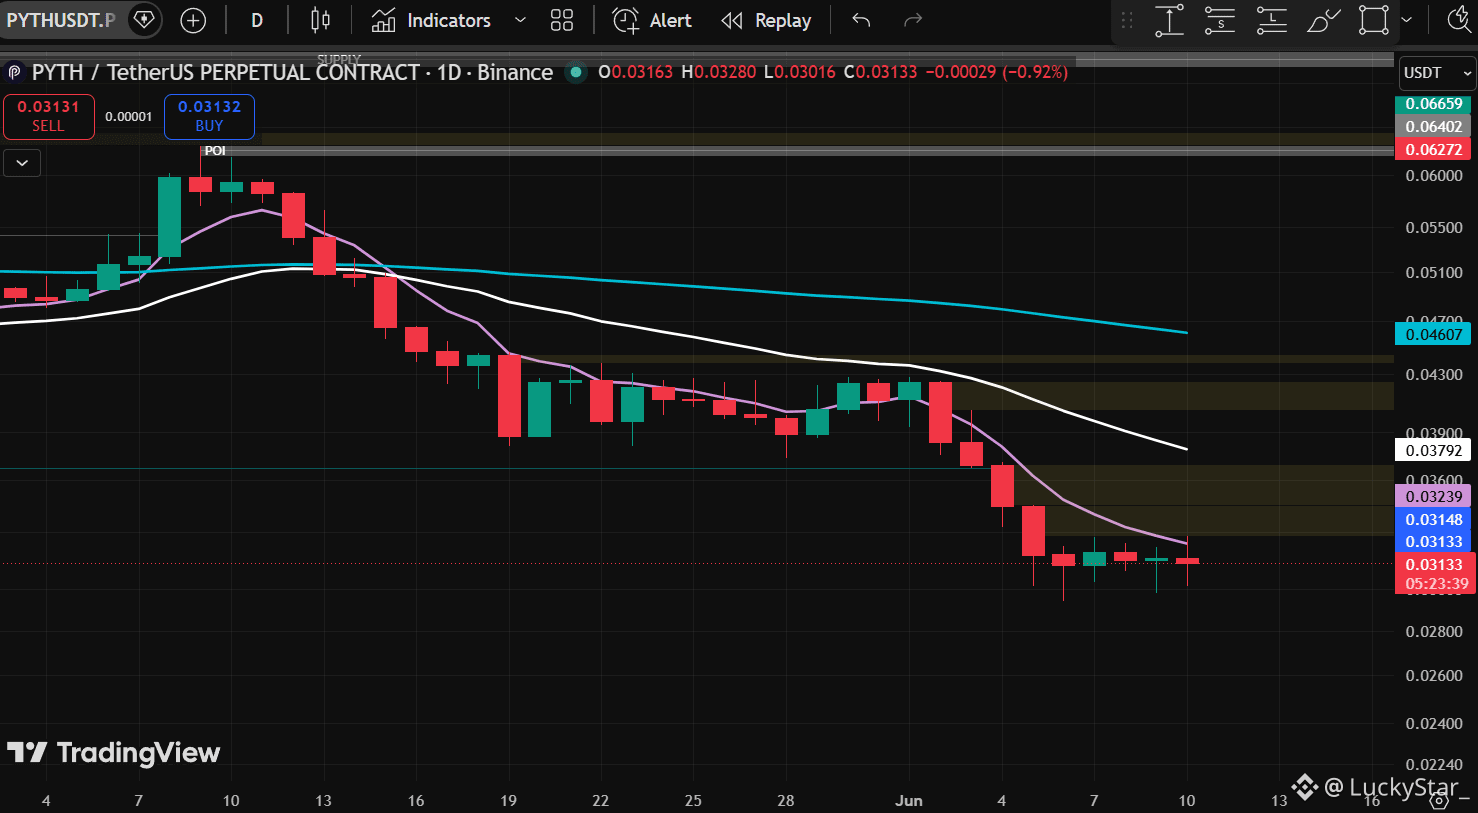
PYTH is testing a strong Demand Zone after a prolonged decline. A confirmed bounce could trigger a short‑term recovery toward 0.046 USDT, while failure to hold above 0.030 USDT may lead to renewed bearish pressure and continuation of the downtrend.
#PYTHUSDT #TradingCommunity #TechnicalAnalys
$PYTH
PYTH is testing a strong Demand Zone after a prolonged decline. A confirmed bounce could trigger a short‑term recovery toward 0.046 USDT, while failure to hold above 0.030 USDT may lead to renewed bearish pressure and continuation of the downtrend.
#PYTHUSDT #TradingCommunity #TechnicalAnalys
PYTH is testing a strong Demand Zone after a prolonged decline. A confirmed bounce could trigger a short‑term recovery toward 0.046 USDT, while failure to hold above 0.030 USDT may lead to renewed bearish pressure and continuation of the downtrend.
#PYTHUSDT #TradingCommunity #TechnicalAnalys
153
·
--
$HAEDAL
{future}(HAEDALUSDT)
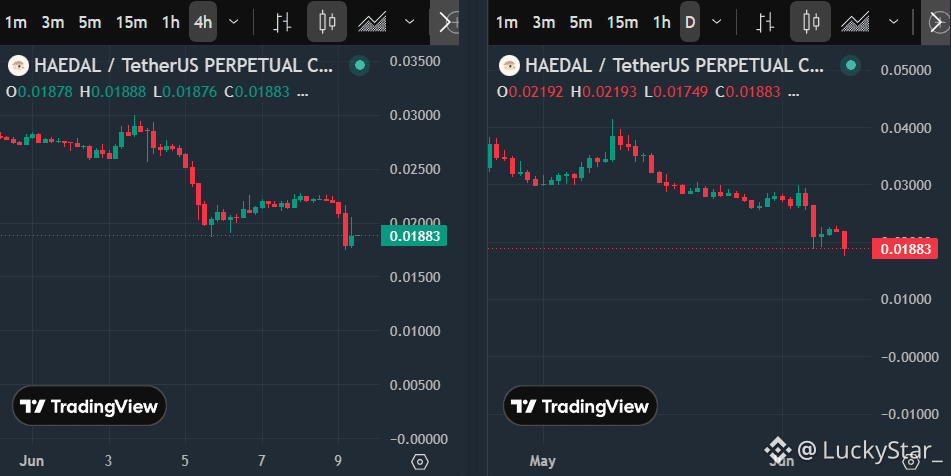
Sellers are firmly defending resistance, keeping downward pressure intact
Target 1: 0.016
Target 2: 0.015
#HAEDALTrading #crypto #trading #TechnicalAnalys
$HAEDAL
Sellers are firmly defending resistance, keeping downward pressure intact
Target 1: 0.016
Target 2: 0.015
#HAEDALTrading #crypto #trading #TechnicalAnalys
Sellers are firmly defending resistance, keeping downward pressure intact
Target 1: 0.016
Target 2: 0.015
#HAEDALTrading #crypto #trading #TechnicalAnalys
134

🔥 $SPCX Bulls vs Bears 🔥
✅ Entry: $161.20–161.80
🎯 TP1: $164.20
🎯 TP2: $167.00
🛑 SL: $159.70
The chart is approaching an important decision area. I’ll only stay in the trade while the setup remains valid.
What’s your target for $SPCX? 🚀👇
#SPCX #CryptoTrading #TechnicalAnalys
🔥 $SPCX Bulls vs Bears 🔥
✅ Entry: $161.20–161.80
🎯 TP1: $164.20
🎯 TP2: $167.00
🛑 SL: $159.70
The chart is approaching an important decision area. I’ll only stay in the trade while the setup remains valid.
What’s your target for $SPCX ? 🚀👇
#SPCX #CryptoTrading #TechnicalAnalys
✅ Entry: $161.20–161.80
🎯 TP1: $164.20
🎯 TP2: $167.00
🛑 SL: $159.70
The chart is approaching an important decision area. I’ll only stay in the trade while the setup remains valid.
What’s your target for $SPCX ? 🚀👇
#SPCX #CryptoTrading #TechnicalAnalys
1
76

·
--
Bullish
🧐 $SIREN coin after a violent drop.. has the moment of the price explosion arrived? 🚀
📉 After a sharp pullback from the 1.37000 peak, we notice on the daily timeframe that the coin has entered a very stable, horizontal accumulation (consolidation) path near the 0.03500 levels. Technically, this price pressure often precedes strong rebounds.
🧩 Key levels to watch:
🟢 Critical support (safety): 0.03050 (keeping it intact ensures a chance for upside)
🎯 Near-term targets if a rebound occurs: 0.03610 then 0.04110
👇 Share your thoughts in the comments: do you see this sideways stability as the calm before the storm and a strong rebound, or is there a new bottom waiting for the coin?
#BinanceSquareFamily #Signal. #TechnicalAnalys
{future}(SIRENUSDT)
#CryptoPatience
🧐 $SIREN coin after a violent drop.. has the moment of the price explosion arrived? 🚀
📉 After a sharp pullback from the 1.37000 peak, we notice on the daily timeframe that the coin has entered a very stable, horizontal accumulation (consolidation) path near the 0.03500 levels. Technically, this price pressure often precedes strong rebounds.
🧩 Key levels to watch:
🟢 Critical support (safety): 0.03050 (keeping it intact ensures a chance for upside)
🎯 Near-term targets if a rebound occurs: 0.03610 then 0.04110
👇 Share your thoughts in the comments: do you see this sideways stability as the calm before the storm and a strong rebound, or is there a new bottom waiting for the coin?
#BinanceSquareFamily #Signal. #TechnicalAnalys
#CryptoPatience
📉 After a sharp pullback from the 1.37000 peak, we notice on the daily timeframe that the coin has entered a very stable, horizontal accumulation (consolidation) path near the 0.03500 levels. Technically, this price pressure often precedes strong rebounds.
🧩 Key levels to watch:
🟢 Critical support (safety): 0.03050 (keeping it intact ensures a chance for upside)
🎯 Near-term targets if a rebound occurs: 0.03610 then 0.04110
👇 Share your thoughts in the comments: do you see this sideways stability as the calm before the storm and a strong rebound, or is there a new bottom waiting for the coin?
#BinanceSquareFamily #Signal. #TechnicalAnalys
#CryptoPatience
286
·
--
$KAITO
{future}(KAITOUSDT)
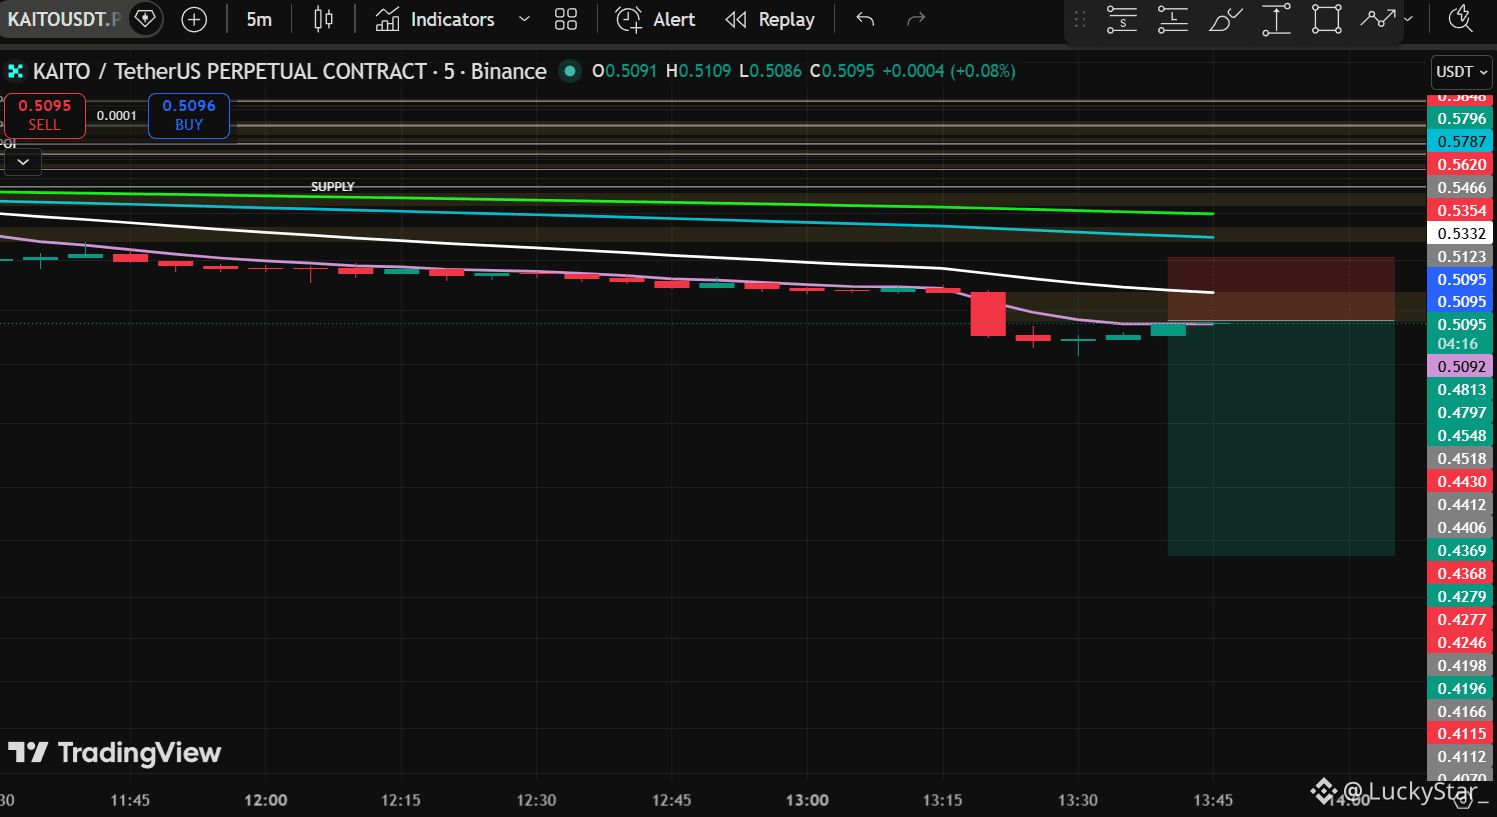
💡 Instead of guessing the direction, it's better to look at the price reaction.
SHORT SETUP IS FORMING
The market is gradually coming under the full control of sellers.
The current structure supports the downward movement.
After the formation of a sellers' signal, a short position was opened.
The development of a downward movement is expected.
#trading #TechnicalAnalys #short
$KAITO
💡 Instead of guessing the direction, it's better to look at the price reaction.
SHORT SETUP IS FORMING
The market is gradually coming under the full control of sellers.
The current structure supports the downward movement.
After the formation of a sellers' signal, a short position was opened.
The development of a downward movement is expected.
#trading #TechnicalAnalys #short
💡 Instead of guessing the direction, it's better to look at the price reaction.
SHORT SETUP IS FORMING
The market is gradually coming under the full control of sellers.
The current structure supports the downward movement.
After the formation of a sellers' signal, a short position was opened.
The development of a downward movement is expected.
#trading #TechnicalAnalys #short
1
194

·
--
Bullish
HOODB (Hood) — Bullish Momentum 📈
Signal: 🟩 BULLISH
Current Price: $108.47 (+1.89%) | Status: Rapid Riser
Technical Analysis & Outlook:
$HOODB displays high-conviction buying above the $105 anchor zone. Volume profiles reveal minimal overhead resistance until the $115 level, giving buyers clean runway to push higher.
$HOODB
{spot}(HOODBUSDT)
Key Trade Levels:
Entry Zone: $106.00 – $108.00
Target 1: $114.50
Target 2: $122.00
Stop Loss: $102.50
Market Sentiment:
High-value assets showing steady percentage gains often lead sector runs. Maintain strict risk management given the higher price range.
#HOODB #CryptoBreakout #Bulls #TechnicalAnalys
HOODB (Hood) — Bullish Momentum 📈
Signal: 🟩 BULLISH
Current Price: $108.47 (+1.89%) | Status: Rapid Riser
Technical Analysis & Outlook:
$HOODB displays high-conviction buying above the $105 anchor zone. Volume profiles reveal minimal overhead resistance until the $115 level, giving buyers clean runway to push higher.
$HOODB
Key Trade Levels:
Entry Zone: $106.00 – $108.00
Target 1: $114.50
Target 2: $122.00
Stop Loss: $102.50
Market Sentiment:
High-value assets showing steady percentage gains often lead sector runs. Maintain strict risk management given the higher price range.
#HOODB #CryptoBreakout #Bulls #TechnicalAnalys
Signal: 🟩 BULLISH
Current Price: $108.47 (+1.89%) | Status: Rapid Riser
Technical Analysis & Outlook:
$HOODB displays high-conviction buying above the $105 anchor zone. Volume profiles reveal minimal overhead resistance until the $115 level, giving buyers clean runway to push higher.
$HOODB
Key Trade Levels:
Entry Zone: $106.00 – $108.00
Target 1: $114.50
Target 2: $122.00
Stop Loss: $102.50
Market Sentiment:
High-value assets showing steady percentage gains often lead sector runs. Maintain strict risk management given the higher price range.
#HOODB #CryptoBreakout #Bulls #TechnicalAnalys
1
54

·
--
Bullish
📉 $BTC — Bearish Divergence on Watch
Bitcoin is forming a potential bearish divergence, with price making higher highs while momentum indicators are failing to confirm the strength.
This can be an early warning of a potential pullback or short-term correction.
⚠️ Divergence alone isn’t a trade signal. I’d wait for clear breakdown confirmation before taking any position.
For spot holders and leveraged traders, this is a yellow flag worth monitoring closely.
$BTC #bitcoin #BTC
#Crypto #TechnicalAnalys
{spot}(BTCUSDT)
📉 $BTC — Bearish Divergence on Watch
Bitcoin is forming a potential bearish divergence, with price making higher highs while momentum indicators are failing to confirm the strength.
This can be an early warning of a potential pullback or short-term correction.
⚠️ Divergence alone isn’t a trade signal. I’d wait for clear breakdown confirmation before taking any position.
For spot holders and leveraged traders, this is a yellow flag worth monitoring closely.
$BTC #bitcoin #BTC
#Crypto #TechnicalAnalys
Bitcoin is forming a potential bearish divergence, with price making higher highs while momentum indicators are failing to confirm the strength.
This can be an early warning of a potential pullback or short-term correction.
⚠️ Divergence alone isn’t a trade signal. I’d wait for clear breakdown confirmation before taking any position.
For spot holders and leveraged traders, this is a yellow flag worth monitoring closely.
$BTC #bitcoin #BTC
#Crypto #TechnicalAnalys
89
Log in to explore more content
Join global crypto users on Binance Square
⚡️ Get latest and useful information about crypto.
💬 Trusted by the world’s largest crypto exchange.
👍 Discover real insights from verified creators.
Email / Phone number
Trending Topics
1
#CanBTCReboundAfterFallingBelow60K?
365,279 views
1,521 Discussing
2
#GlobalStocksFaceLongestLosingStreakSince2023
119,016 views
1,079 Discussing
3
#BlackRockIBITPostsRecord$541MSingleDayOutflow
613 views
16 Discussing
4
#AnthropicPlungesTowardIPOPriceonDay2
57,449 views
581 Discussing
5
#TwentyOneCapitalAdds172.25BTC
10,155 views
157 Discussing
6
#HKBillWouldExcludeTokenizedDepositsFromVirtualAssets
861 views
14 Discussing
7
#BNBDropsBelow540USDTWith8.46%DailyDecline
30,925 views
263 Discussing
8
#HKBillProposesHK$100KFineForUnauthorizedCryptoTitles
1,009 views
14 Discussing
9
#BitMineFaces$10.1BUnrealizedETHLoss
1,967 views
18 Discussing
10
#StrategyReports$35BNetReserves
1,834 views
18 Discussing