
#timeframes
timeframes
5,028 views
28 Discussing
Hot
Latest

A token can post a strong weekly return and still experience a difficult trading session.
Around November 20, $SHELL was reported to be up approximately 30–33% over seven days, while some 24-hour snapshots showed declines of 3–14%.
These figures describe different time windows. A weekly gain does not cancel out short-term selling pressure, and a daily decline does not automatically erase the broader move.
Looking at multiple time frames gives a more balanced view of market behavior.
#SHELL #CryptoAnalysis #Timeframes
A token can post a strong weekly return and still experience a difficult trading session.
Around November 20, $SHELL was reported to be up approximately 30–33% over seven days, while some 24-hour snapshots showed declines of 3–14%.
These figures describe different time windows. A weekly gain does not cancel out short-term selling pressure, and a daily decline does not automatically erase the broader move.
Looking at multiple time frames gives a more balanced view of market behavior.
#SHELL #CryptoAnalysis #Timeframes
Around November 20, $SHELL was reported to be up approximately 30–33% over seven days, while some 24-hour snapshots showed declines of 3–14%.
These figures describe different time windows. A weekly gain does not cancel out short-term selling pressure, and a daily decline does not automatically erase the broader move.
Looking at multiple time frames gives a more balanced view of market behavior.
#SHELL #CryptoAnalysis #Timeframes
143

📚 TRADING LESSON #24 — Multiple timeframes — 1H trend, 15m entry
Use big timeframes for direction and small ones for timing. If the 4H trend is up, look for LONG entries on the 1H or 15m — never SHORT against the 4H trend. A setup that looks perfect on 15m but fights the 4H trend is a trap. Always ask: what does the bigger picture say? Trade in the direction of the higher timeframe, enter on the lower one.
❓ Which timeframes do you combine?
🔔 Follow Inam Pro Trader — a new lesson every day.
📅 19 Nov 2026
#LearnTrading #Timeframes #TechnicalAnalysis
📚 TRADING LESSON #24 — Multiple timeframes — 1H trend, 15m entry
Use big timeframes for direction and small ones for timing. If the 4H trend is up, look for LONG entries on the 1H or 15m — never SHORT against the 4H trend. A setup that looks perfect on 15m but fights the 4H trend is a trap. Always ask: what does the bigger picture say? Trade in the direction of the higher timeframe, enter on the lower one.
❓ Which timeframes do you combine?
🔔 Follow Inam Pro Trader — a new lesson every day.
📅 19 Nov 2026
#LearnTrading #Timeframes #TechnicalAnalysis
Use big timeframes for direction and small ones for timing. If the 4H trend is up, look for LONG entries on the 1H or 15m — never SHORT against the 4H trend. A setup that looks perfect on 15m but fights the 4H trend is a trap. Always ask: what does the bigger picture say? Trade in the direction of the higher timeframe, enter on the lower one.
❓ Which timeframes do you combine?
🔔 Follow Inam Pro Trader — a new lesson every day.
📅 19 Nov 2026
#LearnTrading #Timeframes #TechnicalAnalysis
When looking at the $SHELL chart, separate 24-hour movements from the 7-day or 30-day trend. A slight rise in one session may simply be short-term fluctuation during an accumulation phase. To assess a trend change, observe subsequent sessions, volume, and price structure over a longer time frame.
#Timeframes #PriceAnalysis #SHELL
When looking at the $SHELL chart, separate 24-hour movements from the 7-day or 30-day trend. A slight rise in one session may simply be short-term fluctuation during an accumulation phase. To assess a trend change, observe subsequent sessions, volume, and price structure over a longer time frame.
#Timeframes #PriceAnalysis #SHELL
#Timeframes #PriceAnalysis #SHELL
17
$SHELL | Why a Green Week Can Still Exist Inside a Downtrend
Recent market data cited in the research report showed a modest positive change over seven days on some trackers, while the 30-day performance remained negative, around 20% down in several snapshots.
At first glance, these figures may appear contradictory. They are not. Different timeframes measure different parts of the market's movement.
The seven-day change tells us how price has performed over the past week. The 30-day change captures a much longer period. A token can recover over several sessions while remaining significantly below its level from a month earlier.
This distinction is especially important when analyzing a market that has experienced a prolonged decline. A short-term rebound may represent a relief rally, a temporary response to selling pressure or the beginning of a broader recovery. Price performance alone cannot tell us which explanation is correct.
Traders often examine market structure for additional clues. Are recent highs getting higher or lower? Does price reclaim an important resistance level? Is buying volume expanding during advances? Does the market hold newly established support after a breakout?
A stronger trend-change argument generally requires several pieces of evidence rather than one positive weekly percentage.
The lesson is simple: always state the timeframe behind a performance figure. “Up this week” and “in a longer-term recovery” are two different claims.
#TechnicalAnalysis #Timeframes #MarketStructure CryptoEducation Altcoins
$SHELL | Why a Green Week Can Still Exist Inside a Downtrend
Recent market data cited in the research report showed a modest positive change over seven days on some trackers, while the 30-day performance remained negative, around 20% down in several snapshots.
At first glance, these figures may appear contradictory. They are not. Different timeframes measure different parts of the market's movement.
The seven-day change tells us how price has performed over the past week. The 30-day change captures a much longer period. A token can recover over several sessions while remaining significantly below its level from a month earlier.
This distinction is especially important when analyzing a market that has experienced a prolonged decline. A short-term rebound may represent a relief rally, a temporary response to selling pressure or the beginning of a broader recovery. Price performance alone cannot tell us which explanation is correct.
Traders often examine market structure for additional clues. Are recent highs getting higher or lower? Does price reclaim an important resistance level? Is buying volume expanding during advances? Does the market hold newly established support after a breakout?
A stronger trend-change argument generally requires several pieces of evidence rather than one positive weekly percentage.
The lesson is simple: always state the timeframe behind a performance figure. “Up this week” and “in a longer-term recovery” are two different claims.
#TechnicalAnalysis #Timeframes #MarketStructure CryptoEducation Altcoins
Recent market data cited in the research report showed a modest positive change over seven days on some trackers, while the 30-day performance remained negative, around 20% down in several snapshots.
At first glance, these figures may appear contradictory. They are not. Different timeframes measure different parts of the market's movement.
The seven-day change tells us how price has performed over the past week. The 30-day change captures a much longer period. A token can recover over several sessions while remaining significantly below its level from a month earlier.
This distinction is especially important when analyzing a market that has experienced a prolonged decline. A short-term rebound may represent a relief rally, a temporary response to selling pressure or the beginning of a broader recovery. Price performance alone cannot tell us which explanation is correct.
Traders often examine market structure for additional clues. Are recent highs getting higher or lower? Does price reclaim an important resistance level? Is buying volume expanding during advances? Does the market hold newly established support after a breakout?
A stronger trend-change argument generally requires several pieces of evidence rather than one positive weekly percentage.
The lesson is simple: always state the timeframe behind a performance figure. “Up this week” and “in a longer-term recovery” are two different claims.
#TechnicalAnalysis #Timeframes #MarketStructure CryptoEducation Altcoins

81

What Is a Timeframe and Which One to Use?
A timeframe is the period that each candle represents on your chart. If you look at 1H, each candle = 1 hour of price. If you look at 1D, each candle = a full day.
Which one should you choose? It depends on your availability and style:
• 5m-15m: scalping, many trades, requires full-time attention.
• 1H-4H: day/swing trading, a balance between detail and context.
• 1D: long swing, ideal if you can’t stay glued to the screen.
The pro technique: use three timeframes. A higher one (daily) to see the bigger trend, a middle one (4H) to find your entry, and a smaller one (1H) to confirm.
Example: BTC is rising on the daily, breaks resistance on 4H, and you confirm momentum on 1H. That’s where you enter. If you watch only one timeframe, you trade without context.
Beginner: start with 4H. It’s fast enough to spot opportunities and slow enough that you won’t drown in noise. Lower timeframes amplify every mistake.
Follow us for more guides that save you months of trial and error.
#Timeframes
What Is a Timeframe and Which One to Use?
A timeframe is the period that each candle represents on your chart. If you look at 1H, each candle = 1 hour of price. If you look at 1D, each candle = a full day.
Which one should you choose? It depends on your availability and style:
• 5m-15m: scalping, many trades, requires full-time attention.
• 1H-4H: day/swing trading, a balance between detail and context.
• 1D: long swing, ideal if you can’t stay glued to the screen.
The pro technique: use three timeframes. A higher one (daily) to see the bigger trend, a middle one (4H) to find your entry, and a smaller one (1H) to confirm.
Example: BTC is rising on the daily, breaks resistance on 4H, and you confirm momentum on 1H. That’s where you enter. If you watch only one timeframe, you trade without context.
Beginner: start with 4H. It’s fast enough to spot opportunities and slow enough that you won’t drown in noise. Lower timeframes amplify every mistake.
Follow us for more guides that save you months of trial and error.
#Timeframes
A timeframe is the period that each candle represents on your chart. If you look at 1H, each candle = 1 hour of price. If you look at 1D, each candle = a full day.
Which one should you choose? It depends on your availability and style:
• 5m-15m: scalping, many trades, requires full-time attention.
• 1H-4H: day/swing trading, a balance between detail and context.
• 1D: long swing, ideal if you can’t stay glued to the screen.
The pro technique: use three timeframes. A higher one (daily) to see the bigger trend, a middle one (4H) to find your entry, and a smaller one (1H) to confirm.
Example: BTC is rising on the daily, breaks resistance on 4H, and you confirm momentum on 1H. That’s where you enter. If you watch only one timeframe, you trade without context.
Beginner: start with 4H. It’s fast enough to spot opportunities and slow enough that you won’t drown in noise. Lower timeframes amplify every mistake.
Follow us for more guides that save you months of trial and error.
#Timeframes
121
$SHELL | Why the Same RSI Can Show Two Different Numbers
Here's something that confuses a lot of newcomers: SHELL's RSI(6) reads 40.16 on the daily chart, but 64.07 on the 1-hour chart. Same asset, same indicator, very different numbers. Is the data wrong? No.
RSI isn't one single number for an asset. It's calculated separately for each chart interval you pick, using the candles from that interval. The daily RSI looks at the last 6 daily candles; the 1-hour RSI looks at the last 6 hourly candles. They're answering two different questions: how has SHELL moved over the last 6 days, versus the last 6 hours.
That's why checking just one timeframe and treating it as "the" RSI of an asset misses part of the picture.
#SHELL #CryptoEducation #Timeframes
$SHELL | Why the Same RSI Can Show Two Different Numbers
Here's something that confuses a lot of newcomers: SHELL's RSI(6) reads 40.16 on the daily chart, but 64.07 on the 1-hour chart. Same asset, same indicator, very different numbers. Is the data wrong? No.
RSI isn't one single number for an asset. It's calculated separately for each chart interval you pick, using the candles from that interval. The daily RSI looks at the last 6 daily candles; the 1-hour RSI looks at the last 6 hourly candles. They're answering two different questions: how has SHELL moved over the last 6 days, versus the last 6 hours.
That's why checking just one timeframe and treating it as "the" RSI of an asset misses part of the picture.
#SHELL #CryptoEducation #Timeframes
Here's something that confuses a lot of newcomers: SHELL's RSI(6) reads 40.16 on the daily chart, but 64.07 on the 1-hour chart. Same asset, same indicator, very different numbers. Is the data wrong? No.
RSI isn't one single number for an asset. It's calculated separately for each chart interval you pick, using the candles from that interval. The daily RSI looks at the last 6 daily candles; the 1-hour RSI looks at the last 6 hourly candles. They're answering two different questions: how has SHELL moved over the last 6 days, versus the last 6 hours.
That's why checking just one timeframe and treating it as "the" RSI of an asset misses part of the picture.
#SHELL #CryptoEducation #Timeframes
1
137

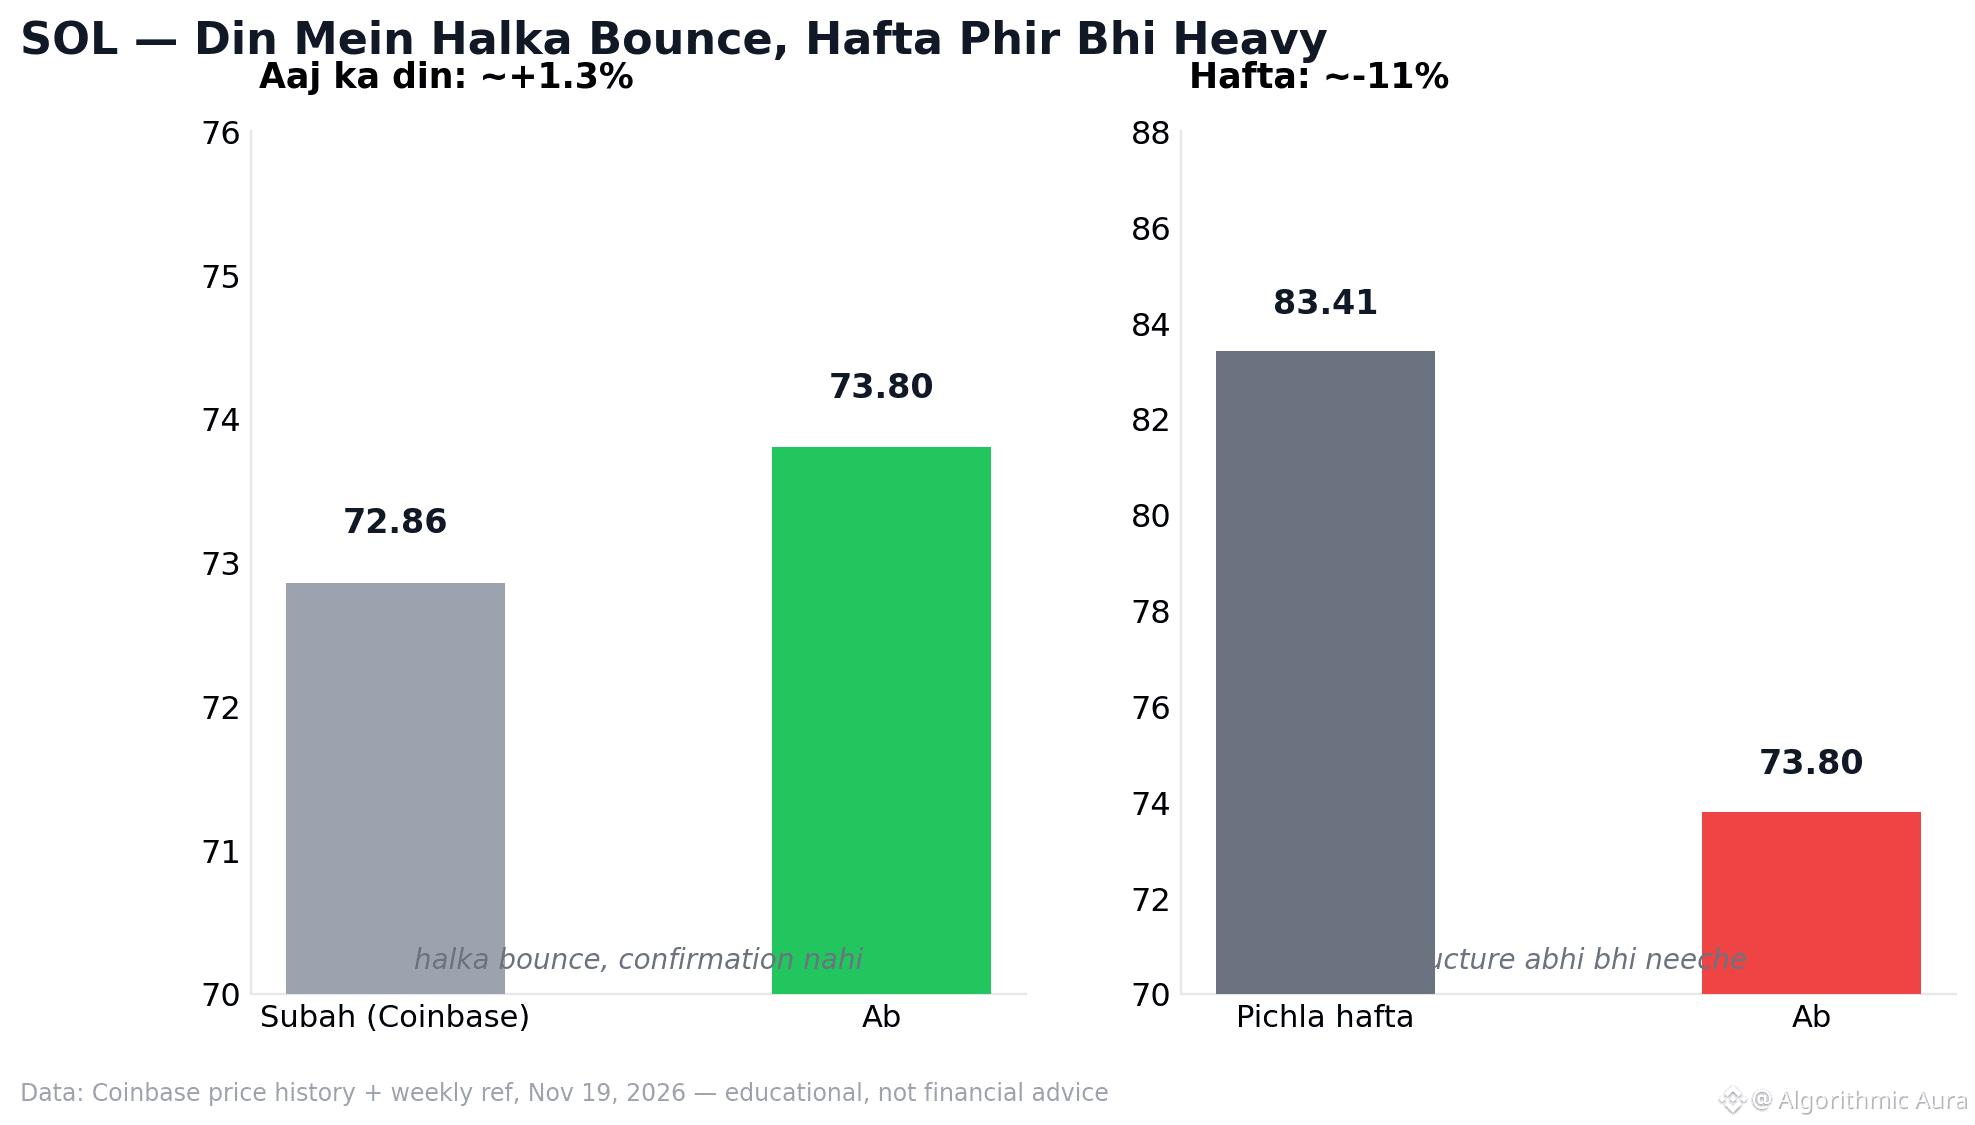
🟣 One chart: SOL — day vs. week, two different truths.
Panel A (day): 72.86 → 73.80, ~+1.3%
Panel B (week): 83.41 → 73.80, ~-11%
🧮 Both numbers belong to the same coin — change the timeframe and the story changes. That’s why drawing conclusions about a trend from a single day is the cheapest trap.
🎯 Fundamental watch: stablecoin payments, network fees — their growth is what tells you the quality of the bounce.
🟣 Price bounce ≠ trend change. Data is the guide.
$SOL
#Solana #Altcoins #Timeframes #CryptoMarket #DataCharts
🟣 One chart: SOL — day vs. week, two different truths.
Panel A (day): 72.86 → 73.80, ~+1.3%
Panel B (week): 83.41 → 73.80, ~-11%
🧮 Both numbers belong to the same coin — change the timeframe and the story changes. That’s why drawing conclusions about a trend from a single day is the cheapest trap.
🎯 Fundamental watch: stablecoin payments, network fees — their growth is what tells you the quality of the bounce.
🟣 Price bounce ≠ trend change. Data is the guide.
$SOL
#Solana #Altcoins #Timeframes #CryptoMarket #DataCharts
Panel A (day): 72.86 → 73.80, ~+1.3%
Panel B (week): 83.41 → 73.80, ~-11%
🧮 Both numbers belong to the same coin — change the timeframe and the story changes. That’s why drawing conclusions about a trend from a single day is the cheapest trap.
🎯 Fundamental watch: stablecoin payments, network fees — their growth is what tells you the quality of the bounce.
🟣 Price bounce ≠ trend change. Data is the guide.
$SOL
#Solana #Altcoins #Timeframes #CryptoMarket #DataCharts
4

·
--
The 3 timeframes
⏰ 3 charts = 1 good trader
Daily → The overall trend (what to trade)
4h → The setup (when to trade)
1h → The precise entry (where to enter)
Never trade against the Daily trend.
#Timeframes #TradingTips"
The 3 timeframes
⏰ 3 charts = 1 good trader
Daily → The overall trend (what to trade)
4h → The setup (when to trade)
1h → The precise entry (where to enter)
Never trade against the Daily trend.
#Timeframes #TradingTips"
⏰ 3 charts = 1 good trader
Daily → The overall trend (what to trade)
4h → The setup (when to trade)
1h → The precise entry (where to enter)
Never trade against the Daily trend.
#Timeframes #TradingTips"
92

·
--
#BinanceWillListHyperliquid(HYPE)
🔥 Crypto Market Alert: The Next Big Move is Loading! 🚀The market is showing strong liquidations and key support retests right now. If you are waiting on the sidelines, you might miss the absolute best entry ⛔ zone of the month.Here is exactly what I am watching on the charts today:📊 The Technical Breakdown:Key Support Zone: Institutional buyers are heavily bidding at this exact level. If it holds, a massive bounce is imminent.Volume Analysis: Selling pressure is drying up on the lower #timeframes , signaling a potential trend reversal.Liquidations: Over-leveraged shorts are getting trapped, which could trigger a massive short squeeze very soon.💡 My Trading Strategy Today:Patience First: Waiting for a clean 4-hour candle confirmation before scaling into any new positions.Risk Management: Keeping stop-losses tight. Protecting capital is always priority number one.Spot Accumulation: Layering orders into high-utility altcoins that are currently sitting at deep discount levels.👇 What is your next move? Are you buying this dip or waiting for a deeper correction? Let me know your targets in the comments!#CryptoTrading #BinanceSquare #TechnicalAnalysis #Bitcoin #altcoins #TradingSignals $BITCOIN $TUT $BEAT
#BinanceWillListHyperliquid(HYPE)
🔥 Crypto Market Alert: The Next Big Move is Loading! 🚀The market is showing strong liquidations and key support retests right now. If you are waiting on the sidelines, you might miss the absolute best entry ⛔ zone of the month.Here is exactly what I am watching on the charts today:📊 The Technical Breakdown:Key Support Zone: Institutional buyers are heavily bidding at this exact level. If it holds, a massive bounce is imminent.Volume Analysis: Selling pressure is drying up on the lower #timeframes , signaling a potential trend reversal.Liquidations: Over-leveraged shorts are getting trapped, which could trigger a massive short squeeze very soon.💡 My Trading Strategy Today:Patience First: Waiting for a clean 4-hour candle confirmation before scaling into any new positions.Risk Management: Keeping stop-losses tight. Protecting capital is always priority number one.Spot Accumulation: Layering orders into high-utility altcoins that are currently sitting at deep discount levels.👇 What is your next move? Are you buying this dip or waiting for a deeper correction? Let me know your targets in the comments!#CryptoTrading #BinanceSquare #TechnicalAnalysis #Bitcoin #altcoins #TradingSignals $BITCOIN $TUT $BEAT
🔥 Crypto Market Alert: The Next Big Move is Loading! 🚀The market is showing strong liquidations and key support retests right now. If you are waiting on the sidelines, you might miss the absolute best entry ⛔ zone of the month.Here is exactly what I am watching on the charts today:📊 The Technical Breakdown:Key Support Zone: Institutional buyers are heavily bidding at this exact level. If it holds, a massive bounce is imminent.Volume Analysis: Selling pressure is drying up on the lower #timeframes , signaling a potential trend reversal.Liquidations: Over-leveraged shorts are getting trapped, which could trigger a massive short squeeze very soon.💡 My Trading Strategy Today:Patience First: Waiting for a clean 4-hour candle confirmation before scaling into any new positions.Risk Management: Keeping stop-losses tight. Protecting capital is always priority number one.Spot Accumulation: Layering orders into high-utility altcoins that are currently sitting at deep discount levels.👇 What is your next move? Are you buying this dip or waiting for a deeper correction? Let me know your targets in the comments!#CryptoTrading #BinanceSquare #TechnicalAnalysis #Bitcoin #altcoins #TradingSignals $BITCOIN $TUT $BEAT

3
1k

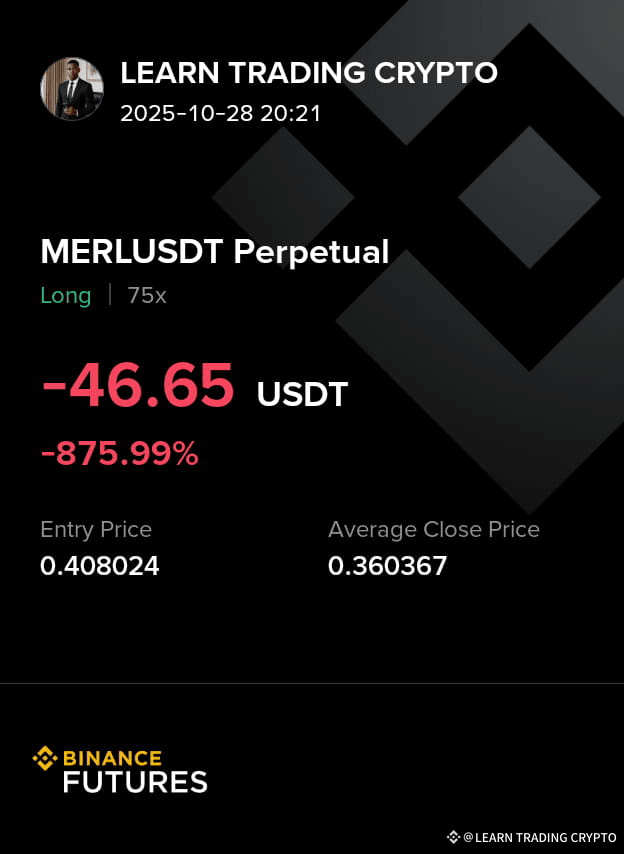
My Followers. .. .. the market always teaches in a hard way.....the #priceaction speaks but we don't listen. .. .. we ignore the longer timeframes and put much emphasis on the shorter #timeframes .. .. .l opened a long position at the peak hopping for more bullish rally but instead my entrance became the whales exit that l lost the trade reaching an extent of getting liquidated . .. .l learnt my lesson , never to repeat that mistake again
$MERL
My Followers. .. .. the market always teaches in a hard way.....the #priceaction speaks but we don't listen. .. .. we ignore the longer timeframes and put much emphasis on the shorter #timeframes .. .. .l opened a long position at the peak hopping for more bullish rally but instead my entrance became the whales exit that l lost the trade reaching an extent of getting liquidated . .. .l learnt my lesson , never to repeat that mistake again
$MERL
$MERL
4
12
697
Log in to explore more content
Join global crypto users on Binance Square
⚡️ Get latest and useful information about crypto.
💬 Trusted by the world’s largest crypto exchange.
👍 Discover real insights from verified creators.
Email / Phone number
Trending Topics
1
#CanBTCReboundAfterFallingBelow60K?
418,790 views
1,817 Discussing
2
#GlobalStocksFaceLongestLosingStreakSince2023
140,649 views
1,270 Discussing
3
#BlackRockIBITPostsRecord$541MSingleDayOutflow
2,976 views
37 Discussing
4
#AnthropicPlungesTowardIPOPriceonDay2
67,063 views
718 Discussing
5
#TwentyOneCapitalAdds172.25BTC
18,667 views
252 Discussing
6
#HKBillWouldExcludeTokenizedDepositsFromVirtualAssets
2,139 views
26 Discussing
7
#BNBDropsBelow540USDTWith8.46%DailyDecline
39,003 views
356 Discussing
8
#HKBillProposesHK$100KFineForUnauthorizedCryptoTitles
1,328 views
19 Discussing
9
#BitMineFaces$10.1BUnrealizedETHLoss
2,356 views
24 Discussing
10
#StrategyReports$35BNetReserves
2,248 views
18 Discussing